
 ?Mathematical formulae have been encoded as MathML and are displayed in this HTML version using MathJax in order to improve their display. Uncheck the box to turn MathJax off. This feature requires Javascript. Click on a formula to zoom.
ABSTRACT
DNA methylation (DNAm) has a well-established association with age in many tissues, including peripheral blood mononuclear cells (PBMCs). Compared to DNAm, the closely related epigenetic modification known as DNA hydroxymethylation (DNAhm) was much more recently discovered in mammals. Preliminary investigations have observed a positive correlation between gene body DNAhm and cis-gene expression. While some of these studies have observed an association between age and global DNAhm, none have investigated region-specific age-related DNAhm in human blood samples. In this study, we investigated DNAhm and gene expression in PBMCs of 10 young and 10 old, healthy female volunteers. Thousands of regions were differentially hydroxymethylated in the old vs. young individuals in gene bodies, exonic regions, enhancers, and promoters. Consistent with previous work, we observed directional consistency between age-related differences in DNAhm and gene expression. Further, age-related DNAhm and genes with high levels of DNAhm were enriched for immune system processes which may support a role of age-related DNAhm in immunosenescence.
Introduction
DNA methylation (DNAm) is the process whereby enzymes known as DNA methyltransferases covalently bind methyl groups (-CH3) to DNA. DNAm usually occurs at a CpG site, i.e. a 5' cytosine nucleotide directly upstream of a 3' guanine nucleotide [Citation1]. An epigenetic modification closely related to DNAm is DNA hydroxymethylation (DNAhm), distinguished by the hydroxylation of the methyl to a hydroxymethyl group (CH2OH). The ten-eleven translocation (TET) enzymes are a family of three proteins (TET1, TET2, TET3) that catalyse the hydroxylation of 5-methylcytosine to 5-hydroxymethylcytosine[Citation2].
DNAm undergoes changes in an orchestrated fashion throughout mammalian development, and coordinates with proteins to regulate gene expression states [Citation1]. A large body of work has established that DNAm robustly associates with age in human whole blood [Citation3–Citation7], whereas age-related changes to DNAhm are less well characterized. This is partially because DNAhm was only discovered in mammals in 2009 [Citation8]. Previously, bisulphite-based methods to detect DNAm were unable to differentiate between DNAm and DNAhm, but newer methods are able to detect and quantify DNAhm [Citation9–Citation13]. Initially, DNAhm was regarded as a transient epigenetic modification intermediate between DNAm and demethylation. However, recent work suggests it can be stably maintained and may serve as a blocker to proteins that would otherwise bind to methylated DNA [Citation14], which opens the possibility that DNAhm could play a more important role in gene regulation than previously recognized.
DNAhm has been most extensively studied in the brain, where 13% of all CpG sites have been reported to have high DNAhm levels [Citation15]. Studies have found that DNAhm is enriched in active genes of human and mouse frontal cortex [Citation15–Citation17], and associates with active transcription and age throughout brain development [Citation18–Citation22]. In neural tissue of mice from embryonic day 7 to 6 weeks, Szulwach et al. (2011) observed an association between developmental stage and increased DNAhm in developmentally active genes [Citation18]. An association between gene activation and gene body DNAhm has also been observed in neural progenitor cells and neurons isolated from mice [Citation19]. These studies suggest that DNAhm may mediate the effect of gene activation on neurodevelopment.
Age-related gene body DNAhm in the brain is enriched for pathways associated with neurodegenerative disorders[Citation21]. A genome-wide decrease in DNAhm was observed in a fragile-X mouse model [Citation23]. In post-mortem human prefrontal cortex, Bernstein et al. (2016) observed differential gene body DNAhm in Alzheimer’s disease in 325 genes in both discovery and replication datasets [Citation24]. DNAhm has also been shown to associate with Alzheimer’s-associated neuritic plaques and neurofibrillary tangles in postmortem human dorsolateral prefrontal cortex tissue [Citation25]. Together, these studies suggest DNAhm may be involved in neurodegeneration.
Most previous studies have examined brain DNAhm, while few have investigated DNAhm in blood. It is possible that whole blood DNAhm has escaped interest due to its low content, which is estimated to be 0.027% [Citation26]. A longitudinal study of peripheral blood samples from mice observed 8,613 genomic regions differentially hydroxymethylated with age, and 28,196 CpG sites differentially methylated with age, with little overlap between the two [Citation27]. Although regional changes with age in DNAhm have yet to be investigated in human blood, global decreases in DNAhm with age have been reported [Citation28,Citation29].
While previous work has established a potential role for DNAhm in active gene transcription as well as development and ageing in brain tissue, its role in blood remains unclear. The objective of our study was to investigate age-related DNAhm in human peripheral blood and its possible gene regulatory and biological roles. To do this, we performed genome-wide DNAhm capture sequencing and RNA-sequencing (RNA-seq) in peripheral blood mononuclear cells (PBMCs) from 10 young and 10 old healthy Caucasian females. Our study is the first to investigate these changes regionally, and one of the first to investigate the interplay between genome-wide gene expression and DNAhm in peripheral blood.
Results
To investigate associations between age, DNAhm, and gene expression, we performed DNAhm capture sequencing[Citation9] and RNA-seq on DNA and RNA samples isolated from PBMCs of 10 young (23–30 years) and 10 old Caucasian females (68–76 years). The number of reads that uniquely mapped to the genome were 11,668,072 to 36,532,555 for DNAhm-capture sequencing and 13,354,493 to 36,314,069 for RNA-seq across samples. Among the samples from the 20 individuals, 48-81% of the DNAhm-capture reads (Table S1) and 74-80% of the RNA-seq reads (Table S2) uniquely mapped to the genome. DNAhm profiles clustered by both batch and age group in a principal components analysis (Figure S1), indicating that both of these variables capture variation in the data. To account for the variation due to batch, batch was included as a covariate in all subsequent analyses of the DNAhm data. The sample gene expression profiles clustered into the young and old age groups (Figure S2). These analyses show that both the gene expression profiles and DNAhm profiles of our sample data capture variation originating from sample age.
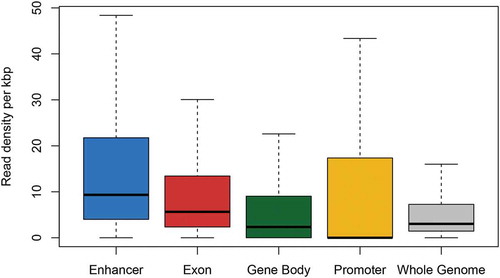
We first investigated DNAhm content across different genomic features. The mean DNAhm read density was highest in enhancers (p < 10−15) (), followed by exons, which had a higher density than that observed in gene bodies (p < 10−15) or genome-wide (p < 10−15). 52% of promoters had no overlapping reads, although the overall mean density was comparable between exons and promoters.
Figure 1. Overlapping reads per kbp across genomic features. To calculate read density, reads that overlapped a genomic feature were counted and averaged across individuals.
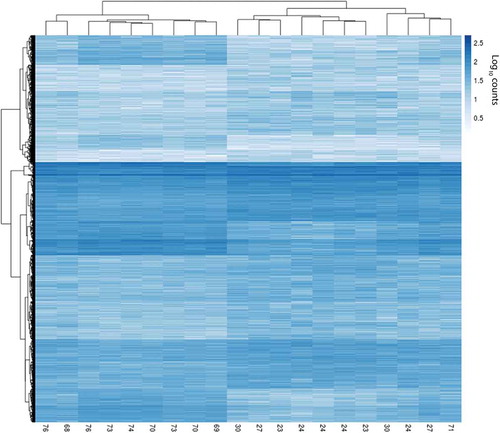
We observed 6,650 differentially hydroxymethylated regions (DhMRs) (FDR<0.05): 4,664 associated with increased ((+) DhMRs) and 1,986 associated with decreased ((-) DhMRs) DNAhm with age (; Table S3). Log2-fold-change ranged from 0.35 to 2.48 for (+) DhMRs and −0.37 to −2.14 for (-) DhMRs (). The read counts for the 20 samples for these 6,650 bins clustered by age group, with one exception (). We observed 732 regions with multiple DhMRs directly adjacent to one another: 658 associated with lower DNAhm and 74 with higher DNAhm in the old age group. Most DhMRs overlapped a gene body, enhancer, or promoter with an overrepresentation of both (+) and (-) DhMRs overlapping gene bodies and enhancers (). The most significant DhMR had decreasing DNAhm with age and occurred on chromosome 20 in an intronic region of TOX2 (Figure S3), which belongs to a family of transcription factors that modify chromatin structure in T cell development [Citation30], and was recently linked to CD8+ T cell exhaustion [Citation31]. The second most significant DhMR was on chromosome 1 and also had decreasing DNAhm with age, and overlapped an exon and intronic regions of the gene LRRN2, which is overexpressed in malignant gliomas (Figure S4) [Citation32]. The most significant DhMR with increasing DNAhm was on chromosome 7 overlapping an intron of STK17A (Figure S5), also known as DRAK1, which is involved in apoptosis and is overexpressed in some cancers [Citation33].
Table 1. Total number (and percentages) of DhMRs showing decreased DNAhm with age, denoted (-) DhMRs, and DhMRs showing increased DNAhm, denoted (+) DhMRs, and for reference, all 2,000 bp bins overlapping at least one promoter, enhancer, or gene body.
Figure 2. Manhattan plot of DhMR analysis. The y-axis represents the signed negative log10-p-value and the x-axis represents the chromosome number and position, with chromosome X appearing to the very right.
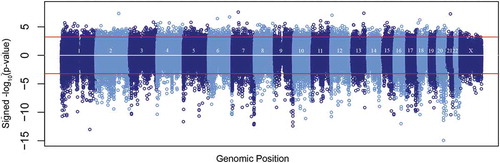
Figure 3. Volcano plot of DhMRs in 2000 bp bins. Bins in light blue are those with FDR<0.05.
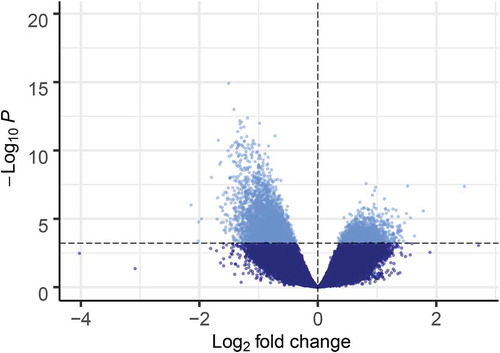
Figure 4. Heatmap of log10-normalized read counts of the 6,650 DhMRs. The numbers along the x-axis indicate ages.
To investigate whether our DhMRs mapped to regions showing differential DNAhm with age in brain, we compared our results to two studies of post-mortem cerebellar tissue samples. To maximize comparability, we re-analysed raw data from the previous studies using similar methods of genome tiling, quality control, and testing for DhMRs between the studies. We observed a small but significant positive correlation between test statistics (0.12 ≤ r ≤ 0.37; Figure S6) in a comparison of our DhMRs to age-DhMRs called from 19 publicly available cerebellar tissue DNAhm samples (age range: 4–55 years) [Citation34]. However, we observed no correlation between the test statistics corresponding to our DhMRs and DhMRs called from DNAhm profiles of 6 young (<20 years) and 6 old (>69 years) cerebellar tissue samples from the NIH NeuroBioBank tissues repositories (r < 0.02; Figure S7) [Citation35] To investigate whether our DhMRs mapped to regions showing differential DNAm with age, we compared our DhMRs to age-related differential DNAm identified in human whole blood samples from two cohorts, one with similar demographics to our 20-sample cohort (European-American) and one African-American cohort [Citation36,Citation37]. Although differentially methylated regions (DMRs) were highly correlated between the two cohorts (r = 0.95; Figure S8), we did not observe a correlation between our DhMR test statistics and DNAm test statistics for either cohort (r < 0.1, Figure S8).
To investigate the potential gene regulatory role of age-related DNAhm, we performed an age-related differential gene expression analysis. We observed 124 differentially expressed genes (DEGs) (FDR<0.05), 45 with higher ((+) DEGs) and 79 with lower ((-) DEGs) expression in old vs. young samples (Table S4). For these 124 DEGs, the RNA-seq read counts clustered perfectly by age group (Figure S9). We compared our DESeq2 test statistics to the published Z-scores of 1,497 genes significantly associated with age in a previous study of gene expression in whole blood [Citation38] and observed a significant correlation between the two (r = 0.58; p < 10−15; Figure S10), indicating that our results were consistent with those from a much larger study (N = 14,983). We next investigated the overlap between DEGs and DhMRs in our study. 160 DhMRs overlapped 39 of the 124 DEGs. We observed directional consistency between age-related DNAhm and gene expression at 159 of these 160 DhMRs (Table S5). 154 of these DhMRs exhibited age-related decreases in both DNAhm and gene expression.
Because DNAm marks cell lineage skewing [Citation39] and age-related cell lineage skewing is observed in both peripheral blood [Citation40] and haematopoietic stem cells (HSCs) [Citation41], we investigated the possibility that age-related changes in cell type proportions could explain our age-related results. To do this, we estimated cell type proportions (Figure S11) from our RNA-seq data using the DeconRNASeq package [Citation42]. The DESeq2 test statistics generated with estimates of cell type proportions as covariates strongly correlated with the test statistics obtained without cell type proportions included as covariates for both DEGs (Figure S12; r = 0.64) and DhMRs (Figure S13; r = 0.83). All DhMRs and 123 of the 124 DEGs from the original models showed directional consistency in the models with cell types as covariates, suggesting that our age-related results are robust to cell composition.
We also evaluated whether gene body, exonic, promoter, or enhancer DNAhm associated with gene expression of the same gene controlling for age and batch. We observed 16 genes with a significant positive association between gene expression and exonic DNAhm and none with a negative association (FDR<0.05; Table S6). 25 genes had a significant association between gene expression and gene body DNAhm, 23 of which had a positive association (FDR<0.05; Table S7). 3 of these 25 genes overlapped with the 16 genes with a significant association between exonic DNAhm and gene expression. The lack of overlapping results between exonic regions and gene bodies could be because exonic regions do not make up a large portion of the total gene length (~16%). Thus, 5hmC could feasibly overlap the gene body without overlapping an exon. We also observed 1 significant association between gene expression and enhancer DNAhm for an enhancer linked to the gene TBX21 (p = 5.3x10⁻⁸). However, this enhancer overlaps a substantial portion of the gene body (2274 bp) and we also observed a significant association between gene expression and 5hmC in both gene body and exonic regions for TBX21; thus, it is not clear which to attribute the association to, although the association is strongest in the analysis of the enhancer region (Figure S14). We did not observe a significant association between gene expression and promoter DNAhm for any gene. Among both significant and non-significant results, the majority of genes had a positive slope coefficient of gene expression on DNAhm in gene bodies (62%), exonic regions (58%), promoters (56%), and enhancers (55%) (Figure S15). Further, the average T-statistic corresponding to the slope coefficient of gene expression on DNAhm was significantly greater than zero for all four genomic features (p < 10−15). The positive association between DNAhm and gene expression for most significant genes is consistent with previous work observing enrichment of DNAhm in active genes in the brain [Citation17,Citation19,Citation22,Citation43].
To test whether age moderates the association between DNAhm and gene expression, we performed additional analyses that included an interaction term between age and DNAhm. We only tested for an interaction among genes that were significant in the main effect analysis described above. We did not observe a significant interaction for exonic or enhancer regions. For gene body 5hmC, we detected a significant interaction between 5hmC and age in predicting expression of a tumour suppressor gene known as PRDM5[Citation44] (p = 4.9x10⁻⁵; Figure S16), suggesting a large positive correlation between 5hmC and gene expression in older individuals that was not seen in young individuals.
We performed gene ontology (GO) analyses on 9 gene sets: the 1500 genes with the highest DNAhm content, genes showing age-related increased or decreased DNAhm in gene bodies, promoters, and enhancers, and (+) and (-) DEGs. After Bonferroni adjustment (p < 3.8x10⁻⁶) we observed enrichment for a total of 94 GO terms (Table S8). We observed 7 GO terms enriched in positive gene body DhMRs as well as 1 enriched in negative enhancer DhMRs and 19 enriched in positive enhancer DhMRs (). Genes with high DNAhm were enriched for 66 GO terms and positive DEGs were enriched for 1 GO term. Many of the significant GO terms observed are involved in immune system function. Genes with high DNAhm were enriched for cell activation involved in immune response, immune system development, immune effector process, immune response-activating cell surface receptor signalling pathway, immune response-regulating signalling pathway, phagocytosis, Fc-receptor signalling pathway, and Fc-gamma receptor signalling pathway involved in phagocytosis. Positive gene body DhMRs associated with leukocyte mediated immunity, neutrophil activation, neutrophil degranulation, and myeloid cell activation involved in immune response. The set of genes with positive enhancer DhMRs were enriched for neutrophil degranulation, immune response, immune system development, and positive regulation of leukocyte differentiation.
Table 2. Significantly enriched GO terms by direction of differential DNAhm and genomic feature showing differential DNAhm.
Discussion
Our study is the first to discover region-specific changes in DNAhm with age in human blood. Among overlapping DhmRs and DEGs, the vast majority had the same direction of effect, i.e. both with associated increases with age or both with associated decreases with age. Further, we observed a positive correlation between gene expression and DNAhm, supporting a possible gene regulatory role for DNAhm in PBMCs. We observed no correlation in test statistics between DMRs and DhMRs (Figure S6), which could suggest that DNAm and DNAhm regulate distinct genes. Based on these results, it is possible that DNAm and DNAhm work in tandem to shape the development and function of tissues throughout life.
Unlike CpG island promoter DNAm, which typically holds genes in a stably repressed state [Citation45,Citation46], the relationship between promoter DNAhm and gene transcription may depend on the presence of certain transcription factors. Unlike DNAm, DNAhm does not bind to methyl-binding proteins (MBD1, MBD2, and MBD4), which are known repressors of transcription [Citation47,Citation48]. However, a transcriptional repressor known as methyl CpG binding protein-2 (MeCP2) binds to DNAm and DNAhm with similar affinity [Citation43]. Further, work suggests that promoter DNAhm may mediate the binding of MeCP2 thereby blocking transcription [Citation49]. Among both significant and non-significant results, we observed 56% of genes to have a positive correlation between promoter DNAhm and gene expression. This contrasts a previous report of promoter eCpGs having a negative correlation between DNAm and gene expression ~80% of the time [Citation50]. The difference in the direction of association with gene expression between DNAm and DNAhm at promoters could be a result of a lack of transcriptional repressors that bind to DNAhm.
The link between DNAhm and active transcription has been better established for gene bodies than promoter regions. Consistent with previous work [Citation19–Citation23,Citation43], we observed mostly positive associations between DNAhm and gene expression: 16 of the 16 genes were positively associated among genes with an association between exonic DNAhm and gene expression, and 23 of 25 genes were positively associated among genes with an association between gene body DNAhm and gene expression. Further, for 62% of all genes tested (including those that were not significant), the test statistic corresponding to the correlation between gene expression and gene body DNAhm was positive. In contrast, previous work on human blood samples observed 60-80% of CpG sites with a significant association between gene expression and DNAm to be negatively correlated in both exons and promoters, as well as other genomic contexts [Citation50].
Among the 23 genes with an association between gene body DNAhm and gene expression, the gene PRDM5 had a significant interaction between DNAhm and age (Figure S16), indicative of a much stronger association among old subjects compared to young subjects. PRDM5 is a tumour suppressor gene, which is downregulated in some carcinoma cell lines, as well as a stress response gene whose response to stress has been reported to be impaired by promoter DNAm [Citation44]. The association we observed between gene body DNAhm and gene expression at PRDM5 in our healthy old subjects, but not young subjects, suggests DNAhm may regulate the expression of this gene in healthy ageing.
Previous work in prefrontal cortex has observed the highest levels of DNAhm in exons and enhancers [Citation23]. Consistent with this study, we observed the highest density of read counts overlapping enhancers followed by exons. The density in both enhancers and exons was significantly higher than gene bodies and genome-wide, and nominally significantly higher than promoters. It is unclear what role DNAhm might play in enhancers, but its similarly high abundance in both brain and blood may be indicative of a congruent role of this epigenetic modification across tissues.
Gene ontology analyses support the interpretation that DNAhm is involved in immune system function, similar to DNAm [Citation47]. In our study, genes showing increased DNAhm in gene bodies in older subjects were enriched for biological processes related to myeloid cell activation involved in immune response. One of the hallmarks of the ageing immune system is skewing towards the myeloid lineage of HSCs [Citation41]. Experiments in mice have shown that both DNAm and DNAhm alter lineage skewing in HSCs [Citation51–Citation53]. Cell types of the myeloid lineage undergo major changes during immunosenescence such as an age-related impairment of phagocytosis among monocytes [Citation54], which are the most abundant mononuclear phagocytes found in blood [Citation55]. Our findings could indicate that age-related DNAhm is involved in these changes. Another myeloid cell type that incurs age-related changes is neutrophils, including an age-related impairment of degranulation [Citation56]. We observed genes showing increased DNAhm in older subjects to be enriched for biological processes related to neutrophil function including neutrophil activation and degranulation. Interestingly, neutrophils are not mononuclear and therefore should not be present in PBMCs. Although contamination of PBMCs with low-density granulocytes has been observed, this is more typically observed in diseases such as systemic lupus erythematosus, whereas such contamination is usually negligible in healthy individuals [Citation57], such as the subjects in our study. The enrichment with neutrophil function could be an indication of cross-talk between cell types, that is, age-related DNAhm could be regulating genes related to neutrophil function in PBMCs which is subsequently communicated to neutrophils.
In addition to age-related DNAhm, we observed enrichment for immune system function among genes with the highest levels of DNAhm, which suggests a possible role of DNAhm in the regulation of immune-related genes independent of age. One of the enriched biological processes was the Fc-gamma receptor signalling pathway involved in phagocytosis, which becomes activated in both macrophages [Citation58] and neutrophils [Citation56,Citation59] to combat pathogens. We also observed enrichment for biological processes suggesting DNAhm is involved in immune response, including immune effector process, immune response-activating cell surface receptor signalling pathway, cell activation involved in immune response, and immune response-regulating signalling pathway.
One of the limitations of this study is the small sample size, which limits power and is likely why we only detected 124 DEGs, much fewer than a previous study that observed 1,497 DEGs in PBMCs of 14,983 individuals of European ancestry [Citation38]. In addition, we used a capture based approach (hMe-Seal), which quantifies DNAhm regionally rather than at CpG site resolution. Thus, our age-related DNAhm results could potentially differ from those generated at CpG site resolution. Another limitation is the differences in sequencing lengths for batch 1 (151 bp) and batch 2 (51 bp), which could explain the lower alignment rate of batch 2 compared to batch 1 (Table S1). Because batches were randomized, and batch was included as a covariate in all analyses, this difference will not bias or confound our analysis, but the lower coverage in batch 2 represents a further limit on power. Finally, all 20 subjects were Caucasian and female and are thus not representative of other demographic groups. While the homogeneity of our sample means it is unlikely that sex or ancestry could confound our results, it is possible that our results may not generalize to males or people of non-European ancestry. However, this was a pilot study intended to investigate 1) the possible presence of region-specific age-related DNAhm in PBMCs and 2) whether DNAhm was enriched for active transcription. We observed evidence of both of these phenomena. Further, our GO analyses suggest that age-related DNAhm may be involved in immune system function in PBMCs. Our findings motivate future investigations into age-related DNAhm in human PBMCs and its possible involvement in gene regulation and immunosenescence, ideally in cohorts that are larger and more heterogeneous.
Conclusion
Our study is the first to show that DNAhm associates with age at thousands of regions in human PBMCs. The directional consistency between age-related differences in DNAhm and gene expression supports previous work in brain reporting that DNAhm is enriched for active transcription. Our study adds to previous work suggesting a possible role of DNAm [Citation51] and DNAhm [Citation52,Citation53] in immununosenescence within HSCs, and supports the premise that age-related DNAhm plays a role in immune system function in PBMCs.
Methods
Data collection
We collected DNAhm and gene expression data from PBMCs of 10 young (23–30 years) and 10 old (68– 76 years) Caucasian females, all of whom were disease-free, unmedicated non-smokers. Ascertainment of participants and sample collection was performed by iSpecimen®, and samples were subsequently shipped to Emory University for analysis. We extracted DNA using the QIAGEN DNeasy Blood and Tissue Kit.
We extracted 1 μg of RNA from each subject using the QIAGEN RNeasy Kit, synthesized cDNA with Invitrogen Oligo(dT)20 primers, and amplified DNA with q-PCR analysis. We performed all laboratory analyses blinded from knowledge of age group of the samples collected.
DNAhm data generation
We performed DNAhm-enrichment using hMe-Seal, a previously described selective chemical labelling method [Citation22]. To perform DNAhm labelling, we used a 100-μl solution containing 50 mM HEPES buffer (pH 7.9), 25 mM MgCl2, 300 ng μl−1 sonicated genomic DNA (100–500 bp), 250 μM UDP-6-N3-Glu, and 2.25 μM wild-type β-glucosyltransferase. We incubated the reactions at 37°C for 1 hour, after which we purified DNA substrates using either a Qiagen DNA purification kit or phenol-chloroform precipitation followed by reconstitution in H2O. With the addition of 150 μM dibenzocyclooctyne modified biotin in the DNA solution, we performed click chemistry followed by incubation of the solution for 2 hours at 37°C. Using Pierce Monomeric Avidin Kit (Thermo), we purified samples according to the manufacturer’s recommendations. Subsequent to elution, we concentrated DNA containing biotin-5-N3-gmC using 10 K Amicon Ultra 0.5-mL Centrifugal Filters (Millipore) and then purified using a Qiagen DNA purification kit.
DNAhm-enriched DNA library preparation
We generated libraries following the Illumina protocol ‘Preparing Samples for ChIP Sequencing of DNA’ (Part# 111,257,047 Rev. A). We initiated the protocol using 25 ng of DNAhm-captured DNA or input genomic DNA. We gel-purified fragments of approximately 150–300 bp subsequent to adapter ligation. We quantified PCR-amplified DNA libraries using an Agilent 2100 Bioanalyzer. We diluted these libraries to 6–8 pM for cluster generation and sequencing. We used version 4 Cluster Generation (Part #15,002,739), Sequencing Kits (#15,005,236) and Version 7.0 recipes to perform 38-cycle single-end sequencing. Due to a change in lab protocol between batches 1 and 2, the sequence read length was 151 bp for batch 1 and 51 bp for batch 2. We processed images and extracted sequences using the standard Illumina Pipeline.
DNAhm data processing
We used Bowtie 2 [Citation60] to align samples to the hg38 build of the human genome using the pre-built index from Illumina’s iGenomes collection. Bowtie 2 outputs SAM-formatted files, which we then sorted, converted to BAM format, and removed reads with MAPQ values lower than 23 (Figure S17; Table S9) using samtools [Citation61].
Creation of DNAhm count matrices
We used the Rsamtools [Citation62], GenomicRanges [Citation63], and BSgenome.Hsapiens.UCSC.hg38 libraries in R Bioconductor to create a 1,544,146-row by 20-column matrix, each row corresponding to a 2000 bp non-overlapping region of the genome and each column corresponding to a sample. The value in the ith row of the jth column indicates the number of DNAhm reads overlapping the ith 2000 bp segment of the jth sample. To create count matrices for reads overlapping gene bodies and exonic regions, we used the same R Bioconductor packages and an Ensembl gene annotation file of 60,675 genes based on the hg38 build of the human genome. To determine DNAhm reads overlapping promoters, we used the NIH Roadmap Epigenomics Consortium’s 18,692 PBMC-specific promoters, which were determined using ChromHMM [Citation64,Citation65]. In our analysis, we used 13,782 of the 18,692 promoters, which were within 2000 bp upstream of the transcription start site of the 60,675 Ensembl genes. We also created a count matrix of DNAhm reads overlapping enhancers using the GeneHancer annotation, which contains annotations of enhancers and their linked genes [Citation66].
RNA-seq library preparation
We generated RNA-seq libraries using 0.5 ug of total RNA samples from young or old PBMCs via the TruSeq RNA Sample Preparation Kit v2 (Illumina). We validated libraries by DNA Chips using Agilent 2100 Bioanalyzer. We then sequenced these libraries using 50-cycle single-end runs with Illumina HiSeq 2000.
RNA-seq data processing
We aligned RNA-seq reads to the hg38 build of the human genome and discarded reads shorter than 50 bps and with quality scores below 20 using the STAR [Citation67] RNA-seq aligner.
We used the Rsamtools, GenomicFeatures, and GenomicAlignments R Bioconductor packages to count RNA-seq reads overlapping each Ensembl-annotated gene of the hg38 build of the human genome. Using the same Ensembl-annotated genome, we counted RNA-seq reads that overlapped exons of these genes.
Quality control of count matrices
For quality control of the RNA-seq and DNAhm read count matrices, we excluded genes/regions that had <10 reads for 5 or more samples. For the DNAhm and RNA-Seq Joint Data Analysis described below, we used genes that passed quality control for both the RNA-seq data using STAR and the DNAhm count matrix of reads overlapping gene exons.
To evaluate data clustering of the gene expression profiles using FPKM values and DNAhm profiles of the 2000 bp binned count matrix, we performed principal component analyses. We then plotted the second principal component against the first principal component for both the gene expression profiles and the DNAhm profiles.
Age-differential analyses of DNAhm and gene expression
To test for age-differentially expressed genes (DEGs) and age-differentially hydroxymethylated 2000 bp regions (DhMRs), we used the R Bioconductor package DESeq2 which models read counts as a negative binomial distribution [Citation68]. Read counts were included as the outcome variable and age group as the predictor variable. When testing for DhMRs we also included batch as a covariate. To correct for multiple testing, we used the Bioconductor qvalue package to apply an FDR cut-off of 0.05 [Citation69].
Comparison of age-related DNAhm and DNAm
To compare our age-related DNAhm to age-related DNAm, we used CpG-specific results from a previous study investigating age-related DNAm (N = 336) [Citation36]. We used Stouffer’s method to combine site-specific T-statistics from the regression of DNAm on age into region-specific Z-scores for each DhMR.
DNAhm and RNA-seq joint data analysis
We used a regression model to test for an association between gene expression (in fragments per kilobase of transcript per million mapped reads, or FPKM values) and quantile-normalized log-transformed DNAhm counts overlapping gene exons, gene bodies, gene enhancers, and gene promoters using the following model:
where the response variable, FPKMij, corresponds to the FPKM value and the predictor variable, DNAhmij, corresponds to the normalized log-transformed DNAhm count for the ith gene and the jth individual. We also included two covariates: Age groupj of the jth individual and Batchj, the batch run for the DNAhm reads of the jth individual. The error term for the ith gene and the jth individual is denoted εij. To test for an interaction between DNAhm and age group, we performed additional regressions for models that had significant main effects by including the interaction term DNAhmij × Age groupj in the model.
Cell mixture estimation
We used previously published cell-type-specific RNA-seq signatures from flow-sorted PBMCs[Citation70] and the R Bioconductor package DeconRNASeq [Citation42] to estimate proportions of myeloid cells, T cells, and B cells in our samples of PBMCs. To investigate whether our models were robust to possible age-related lineage skewing, we compared the DESeq2 analyses run with and without cell type proportions included as covariates for both DEGs and DhMRs.
Gene enrichment analyses
We used the software package GOstats available in R Bioconductor to test for an association between gene sets and Gene Ontology (GO) terms [Citation71]. We first used DESeq2 to perform a feature-based age-differential analysis of DNAhm reads overlapping gene bodies, promoters, and enhancers, applying an FDR<0.05 on the combined set of genomic features. We then did a separate GO analysis on the following nine gene sets: DEGs with decreased and increased expression with age, genes with decreased DNAhm in gene bodies, promoters, enhancers and genes with increased DNAhm in gene bodies, promoters, and enhancers as well as the top 1,500 genes with the most overlapping DNAhm reads. For all GO analyses, we used a Bonferroni correction of α = 0.05.
Data availability
Raw 5hmC- and RNA-seq data are available through dbGaP (accession number phs001916.v1.p1).
Correction Statement
This article has been republished with minor changes. These changes do not impact the academic content of the article.
Supplemental Material
Download Zip (2.4 MB)Disclosure statement
No potential conflict of interest was reported by the authors.
Supplementary material
Supplemental data for this aticle can be accessed here
Additional information
Funding
Related Research Data
References
- Jaenisch R, Bird A. Epigenetic regulation of gene expression: how the genome integrates intrinsic and environmental signals. Nat Genet. 2003;33(Suppl):245–254.
- Ito S, D’Alessio AC, Taranova OV, et al. Role of Tet proteins in 5mC to 5hmC conversion, ES-cell self-renewal and inner cell mass specification. Nature. 2010;466:1129–1133.
- Bell JT, Tsai P-C, Yang T-P, et al. Epigenome-wide scans identify differentially methylated regions for age and age-related phenotypes in a healthy ageing population. PLoS Genet. 2012;8:e1002629.
- Bjornsson HT, Sigurdsson MI, Fallin, MD, et al. Intra-individual change over time in DNA methylation with familial clustering. JAMA. 2008;299:2877–2883.
- Christensen BC, Houseman EA, Marsit CJ, et al. Aging and environmental exposures alter tissue-specific DNA methylation dependent upon CpG island context. PLoS Genet. 2009;5:e1000602.
- Teschendorff AE, Menon U, Gentry-Maharaj A, et al. Age-dependent DNA methylation of genes that are suppressed in stem cells is a hallmark of cancer. Genome Res. 2010;20:440–446.
- Alisch RS, Barwick BG, Chopra P, et al. Age-associated DNA methylation in pediatric populations. Genome Res. 2012;22:623–632.
- Tahiliani M, Koh KP, Shen Y, et al. Conversion of 5-methylcytosine to 5-hydroxymethylcytosine in mammalian DNA by MLL partner TET1. Science. 2009;324:930–935.
- Song C-X, Yi C, He C. Mapping recently identified nucleotide variants in the genome and transcriptome. Nat Biotechnol. 2012;30:1107–1116.
- Terragni J, Bitinaite J, Zheng Y, et al. Biochemical characterization of recombinant β-glucosyltransferase and analysis of global 5-hydroxymethylcytosine in unique genomes. Biochemistry. 2012;51:1009–1019.
- Höbartner C. Enzymatic labeling of 5- hydroxymethylcytosine in DNA. Angew Chem Int Ed Engl. 2011;50:4268–4270.
- Szwagierczak A, Bultmann S, Schmidt CS, et al. Sensitive enzymatic quantification of 5-hydroxymethylcytosine in genomic DNA. Nucleic Acids Res. 2010;38:e181.
- Booth MJ, Branco MR, Ficz G, et al. Quantitative sequencing of 5-methylcytosine and 5- hydroxymethylcytosine at single- base resolution. Science. 2012;336:934–937.
- Hahn MA, Szabó PE, Pfeifer GP. 5- Hydroxymethylcytosine: A stable or transient DNA modification? Genomics. 2014;104:314–323.
- Wen L, Li X, Yan L, et al. Whole-genome analysis of 5-hydroxymethylcytosine and 5-methylcytosine at base resolution in the human brain. Genome Biol. 2014;15:R49.
- Lister R, Mukamel EA, Nery JR, et al. Global epigenomic reconfiguration during mammalian brain development. Science. 2013;341:1237905.
- Colquitt BM, Allen WE, Barnea G, et al. Alteration of genic 5-hydroxymethylcytosine patterning in olfactory neurons correlates with changes in gene expression and cell identity. Proc Natl Acad Sci U S A. 2013;110:14682–14687.
- Szulwach KE, Li X, Li Y, et al. 5-hmC-mediated epigenetic dynamics during postnatal neurodevelopment and aging. Nat Neurosci. 2011;14:1607–1616.
- Hahn MA, Qiu R, Wu X, et al. Dynamics of 5-hydroxymethylcytosine and chromatin marks in mammalian neurogenesis. Cell Rep. 2013;3:291–300.
- Chouliaras L, van den Hove DLA, Kenis G, et al. Age-related increase in levels of 5-hydroxymethylcytosine in mouse hippocampus is prevented by caloric restriction. Curr Alzheimer Res. 2012;9:536–544.
- Song C-X, Szulwach KE, Fu Y, et al. Selective chemical labeling reveals the genome-wide distribution of 5-hydroxymethylcytosine. Nat Biotechnol. 2011;29:68–72.
- Gross JA, Pacis A, Chen GG, et al. Characterizing 5-hydroxymethylcytosine in human prefrontal cortex at single base resolution. BMC Genomics. 2015;16:672.
- Yao B, Lin L, Street RC, et al. Genome-wide alteration of 5-hydroxymethylcytosine in a mouse model of fragile X-associated tremor/ataxia syndrome. Hum Mol Genet. 2014;23:1095–1107.
- Bernstein AI, Lin Y, Street RC, et al. 5-Hydroxymethylation-associated epigenetic modifiers of Alzheimer’s disease modulate Tau-induced neurotoxicity. Hum Mol Genet. 2016;25:2437–2450.
- Zhao J, Zhu Y, Yang J, et al. A genome-wide profiling of brain DNA hydroxymethylation in Alzheimer’s disease. Alzheimers Dement. 2017;13:674–688.
- Godderis L, Schouteden C, Tabish A, et al. Global methylation and hydroxymethylation in DNA from blood and saliva in healthy volunteers. Biomed Res Int. 2015;2015:845041.
- Kochmanski J, Marchlewicz EH, Cavalcante RG, et al. Age-related epigenome-wide DNA methylation and hydroxymethylation in longitudinal mouse blood. Epigenetics. 2018;13:779–792.
- Truong TP, Sakata-Yanagimoto M, Yamada M, et al. Age-dependent decrease of DNA hydroxymethylation in human T cells. J Clin Exp Hematop. 2015;55:1–6.
- Xiong J, Jiang H-P, Peng C-Y, et al. DNA hydroxymethylation age of human blood determined by capillary hydrophilic-interaction liquid chromatography/mass spectrometry. Clin Epigenetics. 2015;7.
- O’Flaherty E, Kaye J. TOX defines a conserved subfamily of HMG-box proteins. BMC Genomics. 2003;4:13.
- Seo H, Chen J, González-Avalos E, et al. TOX and TOX2 transcription factors cooperate with NR4A transcription factors to impose CD8T cell exhaustion. Proc Natl Acad Sci U S A. 2019;116:12410–12415.
- Almeida A, Zhu XX, Vogt N, et al. GAC1, a new member of the leucine-rich repeat superfamily on chromosome band 1q32.1, is amplified and overexpressed in malignant gliomas. Oncogene. 1998;16:2997–3002.
- Park Y, Kim W, Lee J-M, et al. Cytoplasmic DRAK1 overexpressed in head and neck cancers inhibits TGF-β1 tumor suppressor activity by binding to Smad3 to interrupt its complex formation with Smad4. Oncogene. 2015;34:5037–5045.
- Cheng Y, Li Z, Manupipatpong S, et al. 5- Hydroxymethylcytosine alterations in the human postmortem brains of autism spectrum disorder. Hum Mol Genet. 2018;27:2955–2964.
- Kim H, Jin P. Aging-related epigenetic dynamics in cerebellum [unpublished manuscript].
- Johnson ND, Wiener HW, Smith AK, et al. Non-linear patterns in age-related DNA methylation may reflect CD4+ T cell differentiation. Epigenetics. 2017;12:492–503.
- Ali O, Cerjak D, Kent JW, et al. An epigenetic map of age-associated autosomal loci in northern European families at high risk for the metabolic syndrome. Clin Epigenetics. 2015;7:12.
- Peters MJ, Joehanes R, Pilling LC, et al. The transcriptional landscape of age in human peripheral blood. Nat Commun. 2015;6:8570.
- Li H, Zheng T, Chen B, et al. Similar blood-borne DNA methylation alterations in cancer and inflammatory diseases determined by subpopulation shifts in peripheral leukocytes. Br J Cancer. 2014;111:525–531.
- Tu W, Rao S. Mechanisms underlying T cell immunosenescence: aging and cytomegalovirus infection. Front Microbiol. 2016;7:2111.
- Geiger H, de Haan G, Carolina Florian M. The ageing haematopoietic stem cell compartment. Nat Rev Immunol. 2013;13:376–389.
- Gong T, Szustakowski JD. DeconRNASeq: a statistical framework for deconvolution of heterogeneous tissue samples based on mRNA-Seq data. Bioinformatics. 2013;29:1083–1085.
- Mellén M, Ayata P, Dewell S, et al. MeCP2 binds to 5hmC enriched within active genes and accessible chromatin in the nervous system. Cell. 2012;151:1417–1430.
- Shu X-S, Geng H, Li L, et al. The epigenetic modifier PRDM5 functions as a tumor suppressor through modulating WNT/β-catenin signaling and is frequently silenced in multiple tumors. PLoS One. 2011;6:e27346.
- Illingworth RS, Bird AP. CpG islands - ‘A rough guide’. FEBS Lett. 2009;583:1713–1720.
- Jones PA. Functions of DNA methylation: islands, start sites, gene bodies and beyond. Nat Rev Genet. 2012;13:484–492.
- Johnson ND, Conneely KN. The role of DNA methylation and hydroxymethylation in immunosenescence. Ageing Res Rev. 2019;51:11–23.
- Jin S-G, Kadam S, Pfeifer GP. Examination of the specificity of DNA methylation profiling techniques towards 5-methylcytosine and 5-hydroxymethylcytosine. Nucleic Acids Res. 2010;38:e125.
- Zhubi A, Chen Y, Dong E, et al. Increased binding of MeCP2 to the GAD1 and RELN promoters may be mediated by an enrichment of 5-hmC in autism spectrum disorder (ASD) cerebellum. Transl Psychiatry. 2014;4:e349.
- Kennedy EM, Goehring GN, Nichols MH, et al. An integrated -omics analysis of the epigenetic landscape of gene expression in human blood cells. BMC Genomics. 2018;19:476.
- Challen GA, Sun D, Jeong M, et al. Dnmt3a is essential for hematopoietic stem cell differentiation. Nat Genet. 2011;44:23–31.
- Ko M, Huang Y, Jankowska AM, et al. Impaired hydroxylation of 5-methylcytosine in myeloid cancers with mutant TET2. Nature. 2010;468:839–843.
- Moran-Crusio K, Reavie L, Shih A, et al. Tet2 loss leads to increased hematopoietic stem cell self-renewal and myeloid transformation. Cancer Cell. 2011;20:11–24.
- Hearps AC, Martin GE, Angelovich TA, et al. Aging is associated with chronic innate immune activation and dysregulation of monocyte phenotype and function. Aging Cell. 2012;11:867–875.
- Jakubzick CV, Randolph GJ, Henson PM. Monocyte differentiation and antigen-presenting functions. Nat Rev Immunol. 2017;17:349–362.
- Lord JM, Butcher S, Killampali V, et al. Neutrophil ageing and immunesenescence. Mech Ageing Dev. 2001;122:1521–1535.
- Zhang S-G, Song Y-X, Shu X-M, et al. A simple method for removing low-density granulocytes to purify T lymphocytes from peripheral blood mononuclear cells. J Zhejiang Univ Sci B. 2017;18:605–614.
- Huber VC, Lynch JM, Bucher DJ, et al. Fc receptor-mediated phagocytosis makes a significant contribution to clearance of influenza virus infections. J Immunol. 2001;166:7381–7388.
- Weisbart RH, Kacena A, Schuh A, et al. GM-CSF induces human neutrophil IgA-mediated phagocytosis by an IgA Fc receptor activation mechanism. Nature. 1988;332:647–648.
- Langmead B, Salzberg SL. Fast gapped-read alignment with Bowtie 2. Nat Methods. 2012;9:357–359.
- Li H, Handsaker B, Wysoker A, et al. The sequence alignment/map format and SAMtools. Bioinformatics. 2009;25:2078–2079.
- Morgan M, Pages H, Obenchain V, et al. Rsamtools: binary alignment (BAM), FASTA, variant call (BCF), and tabix file import; 2018. doi:10.18129/B9.bioc.Rsamtools
- Lawrence M, Huber W, Pagès H, et al. Software for computing and annotating genomic ranges. PLoS Comput Biol. 2013;9:e1003118.
- Roadmap Epigenomics Consortium. Integrative analysis of 111 reference human epigenomes. Nature. 2015;518:317–330.
- Ernst J, Kellis M. ChromHMM: automating chromatin- state discovery and characterization. Nat Methods. 2012;9:215–216.
- Fishilevich S, Nudel R, Rappaport N, et al. GeneHancer: genome-wide integration of enhancers and target genes in geneCards. Database. 2017;2017.
- Dobin A, Davis CA, Schlesinger F, et al. STAR: ultrafast universal RNA-seq aligner. Bioinformatics. 2013;29:15–21.
- Love MI, Huber W, Anders S. Moderated estimation of fold change and dispersion for RNA-seq data with DESeq2. Genome Biol. 2014;15:550.
- Dabney A, Storey JD, Warnes G. R. qvalue: Q-value estimation for false discovery rate control. R Package Version. 2010;1.
- Monaco G, Lee B, Xu W, et al. RNA-seq signatures normalized by mRNA abundance allow absolute deconvolution of human immune cell types. Cell Rep. 2019;26:1627–1640.e7.
- Falcon S, Gentleman R. Using GOstats to test gene lists for GO term association. Bioinformatics. 2007;23:257–258.