
ABSTRACT
Studies have linked maternal pre-pregnancy obesity and hyperglycaemia with metabolic and neurodevelopmental complications in childhood. DNA methylation (DNAm) might enable foetal adaptations to environmental adversities through important gene loci. NEGR1 is involved in both energy balance and behaviour regulation. The aim of this study was to investigate associations between placental DNAm at the NEGR1 gene locus and childhood anthropometric and neurodevelopmental profiles in preschoolers. We analysed 276 mother-child dyads from Gen3G, a prospective birth cohort from Sherbrooke. At 3yo (40.4 ± 3.0 months), we measured body mass index (BMI) and the mothers reported on offspring neurobehavior using the Strengths and Difficulties Questionnaire (SDQ). We quantified DNAm levels at 30 CpGs at the NEGR1 locus using the MethylationEPIC Array in placental biopsies. DNAm at four CpGs located before NEGR1 second exon predicted child’s BMI z-score (cg26153364: β=−0.16 ± 0.04; p=0.008, cg23166710: β=0.14 ± 0.08; p=0.03) and SDQ total score (cg04932878: β=0.22 ± 1.0; p= 3.0x10⁻⁴, cg16525738: β=−0.14 ± 0.18; p=0.01, cg23166710: β=−0.13 ± 0.36; p= 0.04), explaining 4.2% (p=0.003) and 7.3% (p= 1.3 x 10⁻⁴) of BMI-z and SDQ variances. cg23166710 was associated with both childhood phenotypes and correlated with NEGR1 placental expression (r=−0.22, p=0.04), suggesting its possible functional role. Together, maternal metabolic characteristics during pregnancy with NEGR1 DNAm levels explained 7.4% (p=4.2 x 10⁻⁴) of BMI-z and 14.2% (p=2.8 x 10⁻⁷) of SDQ variance at 3yo. This longitudinal study suggests that placental NEGR1 DNAm is associated with adiposity and neurodevelopment in preschool children and highlights its potential role in their comorbidity.
Introduction
In 2014, the WHO estimated that 41 million children under 5 years of age were overweight or obese. These children are at higher risk of developing musculoskeletal problems, asthma, hypertension, dyslipidemia, and type 2 diabetes (T2D) [Citation1,Citation2]. Over the past decade, stronger evidence has supported the existence of associations between childhood obesity and neurodevelopmental problems, such as internalizing (emotional) and externalizing (behavioural) problems, attention deficit and hyperactivity disorder (ADHD), developmental delay, and autism spectrum disorder (ASD) [Citation1,Citation3,Citation4]. Moreover, energy balance is at least partly controlled by the central nervous system (CNS) and is dysregulated in obesity [Citation5]. Consistent with this, a large number of genes associated with obesity have also been implicated in the development and functioning of the CNS, suggesting that both obesity and neurodevelopmental problems might share common etiologic and genetic origins [Citation6,Citation7].
The placenta is a foetal organ specific to pregnancy, which aims to protect the foetus from stresses, but also to provide the nutrients it needs to grow and to eliminate the metabolic wastes. Therefore, the placenta is central to foetal growth, which predicts both metabolic and mental health later in life [Citation8–Citation10]. Epigenetic has been suggested as a biological mechanism that may contribute to this association [Citation11–Citation14], which supports the investigation of DNA methylation (DNAm) profile in relationship to neurodevelopment and overgrowth in childhood. DNAm is a dynamic process that is transmissible, reversible, and sensitive to environmental exposures especially during in-utero development and in early life [Citation15]. In fact, placental epigenetic changes are suspected of playing a role in the metabolic adaptations needed to protect the foetus, resulting in foetal epigenetic programming. Also, maternal health during pregnancy had been shown to influence offspring DNAm levels. For example, studies conducted by our group showed that gestational diabetes mellitus (GDM) affected both placental and cord blood DNAm in various genes implicated in metabolic diseases [Citation11,Citation13], while one of these studies also identified genes associated with psychological disorders [Citation11]. Others have also reported interesting links between maternal obesity and global placental DNAm levels [Citation12].
Although the literature suggests a link between early DNAm changes and the risk for obesity or neurodevelopmental impairments, to our knowledge, no prior study investigated DNAm as a plausible biological mechanism explaining the association between childhood obesity and neurodevelopment. In this study, we intended to explore the role of DNAm in both obesity and neurodevelopment using a candidate-gene approach focusing on the gene Neuronal Growth Regulator 1 (NEGR1). NEGR1 encodes a cell adhesion molecule member of the IgLON subgroup from the immunoglobulin superfamily [Citation16] and is critical for normal CNS development [Citation16]. Indeed, NEGR1 expression increases in the brain during postnatal development and it is thought to regulate axonal growth and connectivity, as well as synapses number [Citation17–Citation19]. Studies from animal models and in humans also suggest a role for NEGR1 in the regulation of energy balance in both hypothalamic and adipose tissues, possibly through an influence on eating behaviours [Citation20–Citation22]. Moreover, genome-wide association studies (GWAS) have highlighted associations between NEGR1 polymorphisms and overweight and obesity in both children and adults [Citation6,Citation23,Citation24]. NEGR1 genetic variants and expression profiles have also been associated with neuropsychiatric conditions such as depression, ASD, and schizophrenia, as well as intelligence, psychological traits like interoceptive awareness (the perception of sensations from inside the body), and white matter integrity [Citation18,Citation25–Citation29]. Therefore, NEGR1 is believed to influence the neurodevelopment, as well as eating behaviour and/or growth, potentially resulting in higher BMI-z in childhood. This is supported by abundant literature reporting that genes associated with obesity (including NEGR1) are likely to have a role in the neuronal and synaptic processes as well as brain development [Citation6,Citation24]. Epigenetic profile at the NEGR1 gene locus has not been studied so far. Based on this, we considered NEGR1 as a strong candidate gene for exploring associations between childhood obesity and neurodevelopment.
The aim of this study was to assess the association between placental DNAm at NEGR1 locus and childhood obesity and neurodevelopmental problems using a longitudinal cohort study design that followed mothers-offspring dyads from the first trimester of pregnancy to 3 years of age. Secondary objectives were to assess the potential role of maternal factors in these associations and to investigate the impact of NEGR1 DNAm on gene expression.
Results
Maternal and child characteristics
presents the analytical plan applied in this study. The characteristics of mother and child dyads (n = 276) are shown in . Briefly, at first visit (V1), mothers were on average 28.5 (range 19–47) years of age and their mean body mass index (BMI) was slightly overweight (25.5 ± 5.7 kg/m2). Children had a mean body mass index z-score (BMI-z) of 0.52 ± 0.97 at 3 years of age. Mean Strengths and Difficulties Questionnaire (SDQ) total score (8.46 ± 4.78) was within the normal range (<14), which is expected among general population cohorts. Among the SDQ subscales, conduct problems were the most common, with 123 (44.7%) children classified in the ‘borderline/abnormal’ range. shows the proportion of borderline/abnormal children in each SDQ subscales. BMI-z at 3 years of age was not correlated with SDQ total score (rs = 0.01 p = 0.89).
Table 1. Maternal and childhood characteristics from the first trimester of pregnancy to preschool age.
Table 2. Child classification between SDQ categories (n = 275).
Figure 1. The first and main objective of this study was to assess the association between placental NEGR1 DNAm and anthropometric and neurodevelopmental profiles in preschool-aged children from the Gen3G longitudinal cohort. Our second objective was to identify maternal factors during pregnancy that could be important in predisposing children to conditions such as obesity and/or neurodevelopmental disorders. Our third objective was to assess the association between DNAm levels and NEGR1 mRNA levels to assess the functional impact of our identified CpGs.
Placental DNAm at NEGR1 locus and child outcomes
We first assessed associations between placental DNAm and BMI-z or SDQ total score using stepwise linear regression models (). DNAm levels of all 30 CpGs at NEGR1 locus were included in the regression models with only the CpGs associated with the outcomes being retained in the models. We found two CpGs independently associated with BMI-z (cg23166710, β = 0.14 ± 0.08, p = 0.03; cg26153364, β = −0.16 ± 0.04, p = 0.008) (,)), which accounted for 4.2% (p = 0.003) of BMI-z variance at 3 years of age. These remained statistically significant after adjustment for cellular heterogeneity and gestational age at birth. We also identified three CpG sites that were independently associated with SDQ total score (cg04932878, β = 0.22 ± 1.0, p = 1.3 x 10⁻⁴; cg16525738, β = −0.14 ± 0.18, p = 0.01; cg23166710, β = −0.13 ± 0.36, p = 0.04). Collectively, they explained 7.3% (p = 1.3 x 10⁻⁴) of SDQ total score variance (,,). These associations remained statistically significant after adjustment for cellular heterogeneity, gestational age at birth, child age at the follow-up, and child sex.
Table 3. Stepwise linear regression models between DNAm at NEGR1 gene locus and childhood developmental outcomes.
Figure 2. Association between placental DNAm levels at NEGR1 gene locus and BMI z-score at 3 years of age (a) positive association between DNAm levels at cg23166710 and BMI-z (b) negative association between DNAm levels at cg26153364 and BMI-z.
Figure 3. Association between placental DNAm levels at NEGR1 gene locus and SDQ total score at 3 years of age (a) positive association between DNAm levels at cg04932878 and SDQ total score (b) negative association between DNAm levels at cg16525738 and SDQ total score (c) negative association between DNAm levels at cg23166710 and SDQ total score.
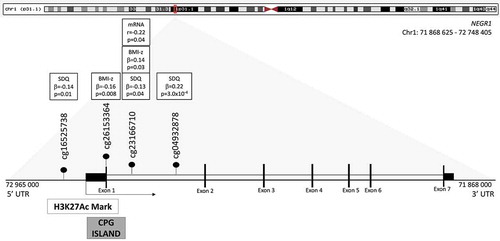
presents the NEGR1 gene locus with all CpGs associated with childhood phenotypes. As cg23166710 was associated with both BMI-z and SDQ total score, we investigated this CpG site further. Interestingly, Encyclopaedia of DNA Elements (ENCODE) data showed that this CpG is located in a regulatory region (and potentially functional region), more specifically downstream (+23 pb) of a DNase A hypersensitivity region and within two possible transcription factor binding sites (TFBS), MAFF and MAFK.
Figure 4. NEGR1 gene locus. We found two CpGs at NEGR1 gene locus where placental DNAm levels were associated with childhood BMI-z. Three CpGs were associated with SDQ total score at 3 years of age. One of the CpG, cgg23166710, was associated with both BMI-z and SDQ total score, but also with NEGR1 mRNA levels, which suggests its functional role. All CpGs were located in the promoter region or in the first intron, in close vicinity to a region susceptible to be important in gene expression regulation as suggested by the H3K27Ac Mark and the CpG Island.
NEGR1 gene expression
To further explore potential functional effects of the identified CpG sites, placental NEGR1 mRNA levels were quantified in a subset (n = 92) of the available placenta samples. Interestingly, only the correlation with cg23166710 was statistically significant (r = −0.22, p = 0.04). In this subset of children, we tested associations between mRNA levels and childhood BMI-z and SDQ at 3 years of age, but we did not find a significant correlation between these variables.
Maternal metabolic factors and child outcomes
Next, we assessed associations between maternal metabolic factors (related to adiposity or glycaemic regulation) in pregnancy and child outcomes of interest (BMI-z and SDQ total score) to identify maternal factors susceptible to have an influence on child health, possibly through DNAm modifications. We used multivariate linear regressions to test associations between each of the selected maternal metabolic factors (i.e. age, BMI at 1st trimester, glucose concentration 2 h post-oral glucose tolerance test (OGTT), and gestational weight gain V3-V1 (GWG)) and BMI-z or SDQ total score at age 3 (). Maternal BMI at 1st trimester was associated with child BMI-z (β = 0.15 ± 0.01, p = 0.01), and this remained significant when adjusted for gestational age at birth. On the other hand, maternal age (β = −0.14 ± 0.07, p = 0.02), BMI at 1st trimester (β = 0.12 ± 0.05, p = 0.05) and glucose levels 2 h post-OGTT (β = 0.21 ± 0.19, p = 4.6 x 10⁻⁴) were all associated with SDQ total score, again still significant after adjustments for gestational age at birth, child sex and age at 3-year follow-up.
Table 4. Multivariate linear regression between maternal factors and child outcomes.
Maternal metabolic factors, placental DNAm at NEGR1 locus and child outcomes
Maternal factors previously identified for their association with child outcomes were then included in multivariate regression models with DNAm to investigate their respective contributions to child BMI-z and SDQ total score using a linear regression model. Both cg23166710 (β = 0.12 ± 0.08, p = 0.04) and cg26153364 (β = −0.16 ± 0.04, p = 0.009) predicted BMI-z along with maternal BMI at 1st trimester (β = 0.15 ± 0.01, p = 0.01). These remained significant after including adjustments for child gestational age at birth (β = −0.11 ± 0.06, p = 0.07) in the model, which also contributed to explaining BMI-z variability (R2 = 0.074, p = 4.2 x 10⁻⁴) ().
Table 5. Stepwise linear regression models between DNAm at NEGR1 gene locus, childhood developmental outcomes and maternal factors.
The same approach was used to identify predictors of SDQ total score. All CpGs remained significantly associated with SDQ total score (cg04932878, β = 0.20 ± 0.97, p = 0.001; cg16525738, β = −0.14 ± 0.17, p = 0.01; cg23166710, β = −0.12 ± 0.35, p = 0.04), along with maternal age (β = −0.13 ± 0.06, p = 0.02), BMI at 1st trimester (β = −0.11 ± 0.05, p = 0.06) and glucose levels 2 h post-OGTT (β = 0.20 ± 0.19, p = 4.9 x 10⁻⁴). Together, maternal factors and DNAm explained 14.2% of SDQ total score variance (p = 2.8 x 10⁻⁷) and these associations remained significant after adjustments for child gestational age at birth, sex and age at the follow-up (). Hence, placental DNAm and maternal metabolic factors during pregnancy were independently associated with BMI-z and SDQ total score at preschool age. Finally, using multivariate linear regression models, we investigated associations between each maternal factor and placental DNAm levels at the 4 CpGs identified (i.e.: cg04932878, cg16525738, cg23166710, cg26153364); however, none of these associations were statistically significant.
Discussion
According to the Developmental Origin of Health and Disease (DOHaD) hypothesis, early life is a crucial period of human development where the risk for chronic diseases such as obesity or neuropsychiatric disorders can be programmed. In the current study, both maternal metabolic factors and placental DNAm at NEGR1 were found to be predictive of the anthropometric and neurodevelopmental profiles at 3 years of age.
One specific CpG site (cg23166710) located within NEGR1 first intron was associated with BMI-z, SDQ total score, as well as placental NEGR1 mRNA levels. Increased DNAm at this locus actually correlated with lower NEGR1 gene expression in placenta, suggesting that NEGR1 epigenetic alterations are likely functional. We hypothesize that methylation at cg23166710 may also have a functional role in other foetal tissues. As the NEGR1 gene’s DNAm profile had never been studied, we relied on previous genetic and functional studies to interpret our results. In fact, previous studies in animal models showed that a decrease of NEGR1 gene expression in the hypothalamus was associated with weight gain, possibly through an increase in food intake [Citation20], a finding that has also been supported by studies in human adipose tissue and post-mortem hypothalamus [Citation21,Citation22]. Moreover, NEGR1 downregulation in mice brains was reported to alter the cortical organization and caused an ASD-associated phenotype, emotional problems or hyperactivity [Citation18,Citation30,Citation31]. This suggests that this gene’s role might extend to more than energy balance and that it might as well have an influence on neurobehavior. However, the results of these animal studies are discordant with our findings with DNAm at cg3166710, where higher placental DNAm was associated with lower SDQ total score (i.e., less neurobehavioral difficulties). Still, the biological role of NEGR1 remains poorly understood and to our knowledge, no prior study has examined NEGR1 DNAm profile, nor its role in the placenta, which could partly explain the discrepancy with previous work.
The young age of the children in our sample might also have affected our results since preschool children have a relatively poor concept of their body sizes/shape, and so peer influences and judgement of them may have a relatively little emotional or behavioural impact [Citation32,Citation33]. This fact could be responsible for partly protecting preschool children from reduced self-esteem and increased behavioural difficulties observed in older overweight and obese youth during childhood and adolescence [Citation34–Citation36]. Supporting this, we failed to find the expected correlation between BMI-z and neurodevelopmental difficulties as measured by the SDQ in the Gen3G cohort at preschool age. In fact, previous studies reporting on associations between BMI and neurobehavioral problems have mainly focused on prepubertal children [Citation34–Citation36]. Although a few did include preschool children (3–5 years old), the associations observed in these studies were small and often sex-dependent [Citation37,Citation38].
We also report an association between maternal metabolic status during pregnancy and child’s anthropometry and neurodevelopment at 3 years of age. Maternal BMI at 1st trimester was associated with both BMI-z at 3 years of age and SDQ total score, while maternal hyperglycaemia was associated with SDQ total score. In previous studies, foetal exposure to hyperglycaemia has been linked to neuropsychiatric morbidities such as ADHD and ASD [Citation39–Citation41]. Our results suggest that maternal hyperglycaemia might not only predict ADHD and ASD, but also more common ‘milder’ emotional and behavioural problems as well. Foetal exposure to maternal metabolic stresses such as obesity and maternal hyperglycaemia may affect both fat accretion and neurodevelopment during childhood; therefore, the identification of the molecular mechanisms underlying these associations is an emerging health priority. DNAm modifications in offspring could be triggered by maternal conditions during pregnancy causing an adverse foetal environment. For example, our group recently showed that maternal hyperglycaemia during pregnancy is associated with placental DNAm levels in genes related to adiposity and/or inflammation including PRDM16, BMP7, PPARGC1, PDE4B, TNFRSF1B, and LDLR [Citation13,Citation42]. However, no evidence of associations between maternal conditions and placental DNAm profile at NEGR1 locus were observed in the current study. Nevertheless, we found that maternal metabolic factors were associated with child SDQ total score and BMI-z still suggesting potential prenatal programming: yet, if DNAm is involved in the mechanisms linking maternal metabolic profile during pregnancy and child neurodevelopment or anthropometry, we should investigate CpG sites in other epigenomic regions.
DNAm levels at the cg23166710 probe locus were the most interesting of the NEGR1 gene locus as they predicted both BMI-z and SDQ total score at 3 years old as well as being associated with NEGR1 mRNA levels. The genomic annotation around these CpG sites shows two TFBS for MAFF and MAFK, which are also in close vicinity to a region of hypersensitivity to DNase I (open chromatin actively transcribed). These small transcription factors are produced in response to cellular stress and depending on their dimerization partners, can either activate or repress transcriptional activity [Citation43]. Interestingly, small MAF proteins have been associated with growth retardation and neuronal degeneration, and MAFK is expressed in neurons during their development, contributing to their growth [Citation43,Citation44]. Altogether, our work highlights the potential regulatory role of this CpG site (cg23166710) on NEGR1 transcriptional activity, which might have implications for child neurodevelopment and growth.
Strengths and limitations
The longitudinal prospective follow-up of the mother-child dyads from the first trimester of pregnancy to 3 years postpartum is a strength of the current study, as was access to a large number of placental biopsies. We applied a candidate-gene approach to consider factors of child development from the beginning of pregnancy to 3 years of age. However, this study has limitations. First, in this representative cohort, we do not have clinically diagnosed medical condition, but only the SDQ score. This may have interfered with our ability to detect associations between adiposity and neurodevelopment. Still, the SDQ is a brief, validated measure of child emotional and behavioural problems widely used in other cohorts. While a more in-depth method of assessment might have been ideal, there are few, if any methods capable of detecting clinically significant psychopathology at 3 years of age. Moreover, a larger sample size would have allowed to stratify our analyses by sex to assess for differences in childhood anthropometry and neurodevelopment between boys and girls, as epigenetic mechanisms are known to be important in the sex differentiation of the human brain, and placental adaptations to an adverse environment are thought to be sexually dimorphic [Citation45,Citation46]. Finally, the Gen3G cohort is mainly composed of white Canadian families; hence, our results may not be generalizable to other populations.
Conclusion
In this study, we identified placental DNAm epivariants at the NEGR1 gene locus that are associated with developmental markers in childhood, particularly with anthropometric profile and neurodevelopment assessed at 3 years of age. Greater DNAm at cg23166710 located in the first intro of NEGR1 was associated with a higher BMI-z at 3 years old and, with fewer potential neurodevelopmental difficulties on a validated measure of emotional and behavioural functioning. Furthermore, higher DNAm at cg23166710 was associated with transcriptional repression, supporting a regulatory role in NEGR1 gene expression. Maternal metabolic health during pregnancy was also found to be independently associated with child development, although we did not identify the molecular mechanisms behind these associations in the current study. Overall, our results and those of existing studies emphasize the importance of further studies aimed at understanding the role of NEGR1 in obesity and neurodevelopment, and how this evolves over time. Further work is needed to establish the molecular links between these conditions, as these would represent a major step towards better health interventions and promotion for mothers and their offspring.
Participants and methods
Gen3G: study population
Study participants were recruited from the Genetics of Glucose regulation in Gestation and Growth (Gen3G) cohort, prospective pregnancy, and birth cohort based in the Eastern Townships area (Québec, Canada). Details of the cohort have been detailed elsewhere [Citation47]. Healthy women were followed from the first trimester of pregnancy (n = 1034) until delivery (n = 862). They were enrolled by their physician between January 2010 and June 2013 if they received prenatal care at the Centre Hospitalier Universitaire de Sherbrooke (CHUS) or in an affiliated health centre and planned delivery at the CHUS. Women were eligible for this study if they were older than 18 years, had a singleton pregnancy and did not have pre-gestational diabetes. For the current study, mother and child pairs (n = 276) were selected if they had maternal glycaemia and BMI measures during pregnancy, placental biopsies with DNAm data, and were followed up when children were 3 years old with complete SDQ data (Supplementary Figure 1). Exclusionary criteria included severe pregnancy or birth complications such as pre-eclampsia, insulin-treated gestational diabetes, or congenital malformation(s). Our subsample of Gen3G offspring was overall very similar and representative of the whole cohort. Written informed consent was provided by study participants prior to enrolment in accordance with the Declaration of Helsinki. All study protocols were approved by the institutional review board from the CHUS.
Follow-up during pregnancy
Data and biological samples were collected at the first and second trimesters (V1 and V2, respectively) of pregnancy, as well as at delivery. Medical history and anthropometric data were collected at pregnancy visit (V1 and V2) and extracted from hospital records at delivery. Core maternal metabolic markers taken during pregnancy were BMI at 1st trimester of pregnancy, glucose levels 2 h post-OGTT, and GWG. Maternal BMI at 1st trimester was computed in kilograms per square metre (kg/m2) at the clinical visit. All women performed a 75g OGTT between 24 and 30 gestational weeks, according to the Canadian Diabetes Association (CDA) recommendations at that time [Citation48]. GWG was calculated using weight before delivery (V3 – extracted from medical records) and weight at 1st trimester of pregnancy (V3-V1). Child birth weight was collected from medical records and a z-score was calculated on WHO’s reference (WHO Anthro software, version 3.2.2, January 2011).
Childhood follow-up
A total of 695 mother and child pairs were eligible for the follow-up when children were 3 years old. Families were all contacted by research staff, and a total of 448 (64.5%) mother and child pairs consented to the 3-year postpartum visit, where anthropometric measures (e.g., weight, height) and medical history were recorded (Supplementary Figure 1). More precisely, weight was assessed with a numeric balance while height was measured with a calibrated stadiometer. Both measures were taken barefoot. Child BMI-z was calculated using the WHO’s reference (WHO Anthro software). Neurodevelopment was assessed using the Strength and Difficulties Questionnaire (SDQ), which was completed by mothers. Four participants had missing values for the anthropometric measurements. Children with a BMI-z (n = 1) and SDQ total score (n = 1) outside of the third interquartile range (>3IQR) were excluded from the analyses, as they were clear outliers and we could not confirm that they were real values. The SDQ is a brief emotional and behavioural screening questionnaire that assesses neurodevelopmental-related difficulties in childhood. It is validated for children between 2 and 17 years old in many languages, including French, is brief, reliable, and is commonly used in research given its prediction of clinically significant psychopathology [Citation49–Citation51]. The SDQ version developed for preschool children from 2 to 4 years old was used. Its 25 questions assess difficulties in 5 different developmental areas: emotion, conduct, inattention/hyperactivity, peer relationship difficulties and pro-social skills. The SDQ total score is comprised of the sum of the scores on the first four subscales and ranges from 0 to 40, with a score of 40 representing more difficulties. Children were classified as being ‘normal’, ‘borderline’ or ‘abnormal’ using the SDQ’s validated cut points (available at www.sdqinfo.com). In school-aged children, studies demonstrated a strong correlation between SDQ subgroup and clinical diagnoses of neuropsychiatric conditions [Citation52,Citation53].
Placental DNA and RNA extraction
Within minutes after delivery (all <30 min), a 1 cm3 placental sample was collected by well-trained research staff following a highly standardized procedure [Citation47]. The biopsies were taken from the foetal side of the placenta, approximately 5 cm from the umbilical cord insertion. Samples were kept in RNA Later (Qiagen) at −80°C as recommended by the manufacturer’s protocol. The AllPrep DNA/RNA/ProteinMini Kit (Qiagen) was used to extract DNA and RNA from placental samples. Double strands DNA concentrations were assessed using Quant-iT™ PicoGreen™ dsDNA Assay Kit (Qiagen). RNA integrity number (RIN) was assessed with Agilent 2100 Bioanalyser RNA Nano Chips (Agilent Technologies) to determine RNA quality. Samples selected for RNA analysis had a mean RIN of 8.3 ± 0.9.
DNA methylation quantification at NEGR1 gene locus
The MethylationEPIC BeadChip (Illumina) was used to quantify placental pangenomic DNAm from bisulphite converted DNA (EpiTect Bisulphite Kit, Qiagen). This beadchip covers more than 850,000 single CpG on 99% of all genes indexed in RefSeq. Briefly, in order to minimize technical bias, samples were randomly ascertained in different plates and chips. DNAm results were normalized, adjusted for probes-type bias and for sample plates. DNAm was measured for 479 samples; however, after rigorous quality control and removal of the 10 duplicates, 448 samples remained available for analysis. During the probes QC procedures, a total of 19,536 probes were excluded because they were located on sex chromosomes and 126,369 probes did not pass individual site quality control for one of the following reasons: nonsignificant detection for 5% or more of the samples (p > 0.05), non-CpG probes, SNP-associated probes with a minor allele frequency ≥5% or potential cross-hybridization probes previously identified [Citation54]. Principal component analysis (PCA) was computed using ReFACTor to correct for cell-type heterogeneity [Citation55]. The M-values (logit transformed β-values) were used in the further analysis as they better fulfil regression modelling assumptions, but all effects reported in this paper were shown with the β-values to help interpretation, as they range from 0 to 1 to approximate DNAm proportion from 0% to 100% [Citation56]. As this study is based on a candidate-gene approach, we used the Illumina MethylationEPIC manifest (downloaded at https://support.illumina.com/array/array_kits/infinium-methylationepic-beadchip-kit/downloads.html) to identify CpG in the vicinity and within the NEGR1 gene locus. A total of 46 CpG sites were identified; yet, only kept the CpG sites with mean DNAm levels between 5% and 95% were selected as they are more likely to have interindividual functional variability. Hence, 30 CpGs, located in chr1:72,087,712–72,964,136 (GRCh37 – hg19 Genome Assembly), were included in our analysis. DNAm outliers were evaluated based on interquartile ranges (>3IQR).
DNAm data were extracted from analyzes performed by our group in the context of a previous study [Citation13]. We applied the exact same normalization (including correction for cellular heterogeneity) and quality-control (QC) procedures as in [Citation13]. We also applied principal component analysis (PCA) to control for cellular heterogeneity, which is a clear advantage of using array data compared to targeted analysis strategies such as pyrosequencing.
Placental NEGR1 mRNA levels
Placental NEGR1 mRNA levels were quantified by quantitative real-time PCR (qRT-PCR) (7500 Real-Time PCR system; Thermo Fisher Scientific) from a subset of 97 randomly selected biopsies with DNAm data and SDQt. Total RNA was converted in complementary DNA (cDNA) using the High Capacity cDNA RT kit (Applied Biosystems). For the real-time PCR, each sample was run in duplicate with the Taqman® Fast Universal PCR Master Mix (Applied Biosystems). Primers and Taqman probes were obtained from Applied Biosystems (NEGR1: Hs02387573_m1). The well-documented stable reference gene for placental expression experiment, the Tyrosine 3-Monooxygenase/Tryptophan 5-Monooxygenase Activation Protein, Zeta (YWHAZ: Hs01122445_g1) was amplified in parallel for each sample [Citation57]. The mRNA ratios of YWHAZ/NEGR1 were used for the analysis according to the manufacturer’s recommendations. Three samples were removed from the analysis as their signal was undetectable and two samples with >3IQR were removed.
Statistical analyses
First, Spearman correlations were used to assess the link between SDQ total score and BMI-z at 3 years old, as they were the main outcomes in this study. Next, stepwise linear regression models including all 30 CpG sites were used to evaluate if placental DNAm levels (m-values) at NEGR1 gene locus predicted children’s SDQ total score or BMI-z. Both stepwise models were set at an entry of p = 0.10 and exit of p = 0.15. For SDQ total score, statistical analyses were adjusted for gestational age at birth, child age at follow-up and offspring sex. Only gestational age at birth was included in the statistical models testing associations with BMI-z, as z-score already takes into account child sex and age at the follow-up. The potential influence of cell-type heterogeneity was adjusted using the first five principal components obtained with ReFACTor as in a recent paper from our group [Citation13]. Associations between child BMI-z or SDQ and maternal smoking during pregnancy were not significant; therefore, it was not included as a cofounding variable in the models.
Then, we assessed the association between NEGR1 placental DNAm and gene expression using Spearman correlations. The association between NEGR1 gene expression and child outcomes (i.e., BMI-z and SDQ total score) was also tested, using linear regressions.
Next, multivariate linear regressions were used to assess the association between maternal characteristics and child outcomes. Again, analyses for SDQ total score were adjusted for gestational age at birth, child age at follow-up and offspring sex, while those for BMI-z were adjusted only for gestational age at birth. Then, maternal metabolic factors identified to be associated with BMI-z (i.e., maternal BMI at 1st trimester) and SDQ total score (i.e., maternal age, maternal BMI at 1st trimester, glucose concentration 2 h post-OGTT, GWG) were combined to DNAm levels at the CpGs associated with child outcomes (BMI-z, cg23166710 and cg26153364; SDQ total score, cg04932878, cg16525738, and cg23166710) in two multivariate linear regression models to assess their independent contribution to preschool children’s phenotypes. Subsequently, two other linear regression models were used to adjust the previous ones for gestational age at birth (BMI-z) or gestational age at birth, child sex, and age at a follow-up (SDQ total score). Finally, multivariate regression models were used to verify if maternal health (i.e., maternal age, maternal BMI at 1st trimester, glucose concentration 2 h post-OGTT, GWG) could influence placental DNAm levels at the identified CpG sites. Statistical significance was set at p ≤ 0.05. Analyses were realized using SPSS Statistics software 25.0 (IBM Corp, USA).
Authors’ contributions
EB wrote the manuscript, carried out the data analysis/interpretation under the supervision of LB. LB, MFH, and PP conceived the original study design. RVL proposed the use of the SDQ Questionnaire and supported SDQ-related data analysis and interpretation. VGO participated in the gene expression analyses and the data analyses. All authors revised the manuscript and approved its final version.
Supplemental Material
Download MS Power Point (40.8 KB)Acknowledgments
The authors acknowledge all the participants from Gen3G and the staff of the Centre de recherche du Centre Hospitalier Universitaire de Sherbrooke (CRCHUS) who participated in the follow-up and data collection.
Disclosure statement
No potential conflict of interest was reported by the authors.
Supplementary material
Supplemental data for this article can be accessed here.
Additional information
Funding
Related Research Data
References
- Halfon N, Larson K, Slusser W. Associations between obesity and comorbid mental health, developmental, and physical health conditions in a nationally representative sample of US children aged 10 to 17. Acad Pediatr. 2013 Feb;13(1):6–13.
- Koyuncuoğlu Güngör N. Overweight and obesity in children and adolescents. J Clin Res Pediatr Endocrinol. 2014 Sep;6(3):129–143.
- Cortese S, Moreira-Maia CR, St Fleur D, et al. Association between ADHD and obesity: a systematic review and meta-analysis. Am J Psychiatry. 2016 Jan;173(1):34–43.
- Zheng Z, Zhang L, Li S, et al. Association among obesity, overweight and autism spectrum disorder: a systematic review and meta-analysis. Sci Rep. 2017 Sep 15;7(1):11697.
- Roh E, Kim M-S. Brain regulation of energy metabolism. Endocrinol Metab. 2016 Dec;31(4):519–524.
- Locke AE, Kahali B, Berndt SI, et al. Genetic studies of body mass index yield new insights for obesity biology. Nature. 2015 Feb 12;518(7538):197–206.
- Samaan Z, Anand SS, Anand S, et al. The protective effect of the obesity-associated rs9939609 A variant in fat mass- and obesity-associated gene on depression. Mol Psychiatry. 2013 Dec;18(12):1281–1286.
- Reilly JJ, Armstrong J, Dorosty AR, et al. Early life risk factors for obesity in childhood: cohort study. BMJ. 2005 Jun 11;330(7504):1357.
- Sucksdorff M, Lehtonen L, Chudal R, et al. Preterm birth and poor fetal growth as risk factors of attention-deficit/hyperactivity disorder. Pediatrics. 2015 Sep;136(3):e599–608.
- Miller SL, Huppi PS, Mallard C. The consequences of fetal growth restriction on brain structure and neurodevelopmental outcome. J Physiol. 2017;594(4):807–823.
- Ruchat S-M, Houde -A-A, Voisin G, et al. Gestational diabetes mellitus epigenetically affects genes predominantly involved in metabolic diseases. Epigenetics. 2013 Sep;8(9):935–943.
- Mitsuya K, Parker AN, Liu L, et al. Alterations in the placental methylome with maternal obesity and evidence for metabolic regulation. PLoS ONE. [Internet]. 2017 Oct 18 [cited 2019 Apr 29];12(10):e0186115. Available from: https://www.ncbi.nlm.nih.gov/pmc/articles/PMC5646778/
- Cardenas A, Gagné-Ouellet V, Allard C, et al. Placental DNA methylation adaptation to maternal glycemic response in pregnancy. Diabetes. 2018 Aug;67(8):1673–1683.
- Altmäe S, Segura MT, Esteban FJ, et al. Maternal pre-pregnancy obesity is associated with altered placental transcriptome. PLoS ONE [Internet]. 2017 Jan 26 [cited 2019 Feb 13];12(1):e0169223. Available from: https://www.ncbi.nlm.nih.gov/pmc/articles/PMC5268451/
- Moore LD, Le T, Fan G. DNA methylation and its basic function. Neuropsychopharmacology. 2013 Jan;38(1):23–38.
- Sanz R, Ferraro GB, Fournier AE. IgLON cell adhesion molecules are shed from the cell surface of cortical neurons to promote neuronal growth. J Biol Chem. 2015 Feb 13;290(7):4330–4342.
- Schäfer M, Bräuer AU, Savaskan NE, et al. Neurotractin/kilon promotes neurite outgrowth and is expressed on reactive astrocytes after entorhinal cortex lesion. Mol Cell Neurosci. 2005 Aug;29(4):580–590.
- Szczurkowska J, Pischedda F, Pinto B, et al. NEGR1 and FGFR2 cooperatively regulate cortical development and core behaviours related to autism disorders in mice. Brain J Neurol. 2018 Sep 1;141(9):2772–2794.
- Pischedda F, Szczurkowska J, Cirnaru MD, et al. A cell surface biotinylation assay to reveal membrane-associated neuronal cues: negr1 regulates dendritic arborization. Mol Cell Proteomics MCP. 2014 Mar;13(3):733–748.
- Boender AJ, van Gestel MA, Garner KM, et al. The obesity‐associated gene Negr1 regulates aspects of energy balance in rat hypothalamic areas. Physiol Rep. [Internet]. 2014 Jul 22 [cited 2019 Jan 22];2(7):e12083. Available from: https://www.ncbi.nlm.nih.gov/pmc/articles/PMC4187548/
- Bernhard F, Landgraf K, Klöting N, et al. Functional relevance of genes implicated by obesity genome-wide association study signals for human adipocyte biology. Diabetologia. 2013 Feb;56(2):311–322.
- Walley AJ, Jacobson P, Falchi M, et al. Differential coexpression analysis of obesity-associated networks in human subcutaneous adipose tissue. Int J Obes 2005. 2012 Jan;36(1):137–147.
- Wheeler E, Huang N, Bochukova E, et al. Genome-wide SNP and CNV analysis identifies common and low-frequency variants associated with severe early-onset obesity. Nat Genet. 2013 May;45(5):513–517.
- Willer CJ, Speliotes EK, Loos RJF, et al. Six new loci associated with body mass index highlight a neuronal influence on body weight regulation. Nat Genet. 2009 Jan;41(1):25–34.
- Gamero-Villarroel C, González LM, Gordillo I, et al. Impact of NEGR1 genetic variability on psychological traits of patients with eating disorders. Pharmacogenomics J. 2015 Jun;15(3):278–283.
- Sniekers S, Stringer S, Watanabe K, et al. Genome-wide association meta-analysis of 78,308 individuals identifies new loci and genes influencing human intelligence. Nat Genet. 2017 Jul;49(7):1107–1112.
- Hyde CL, Nagle MW, Tian C, et al. Identification of 15 genetic loci associated with risk of major depression in individuals of European descent. Nat Genet. 2016;48(9):1031–1036.
- Karis K, Eskla K-L, Kaare M, et al. Altered expression profile of IgLON family of neural cell adhesion molecules in the dorsolateral prefrontal cortex of schizophrenic patients. Front Mol Neurosci. 2018;11:8.
- Dennis EL, Jahanshad N, Braskie MN, et al. Obesity gene NEGR1 associated with white matter integrity in healthy young adults. NeuroImage. 2014 Nov 15;102(02):548–557.
- Noh K, Lee H, Choi T-Y, et al. Negr1 controls adult hippocampal neurogenesis and affective behaviors. Mol Psychiatry. 2019 Aug 16;24(8):1189–1205.
- Singh K, Jayaram M, Kaare M, et al. Neural cell adhesion molecule Negr1 deficiency in mouse results in structural brain endophenotypes and behavioral deviations related to psychiatric disorders. Sci Rep [Internet]. 2019 Apr 1 [cited 2019 Apr 17];9. Available from: https://www.ncbi.nlm.nih.gov/pmc/articles/PMC6443666/
- Boyer CE, Carlson AG, Pasnak R. Object and size awareness in preschool-age children. Percept Mot Skills. 2012 Feb;114(1):29–42.
- Tatangelo G, McCabe M, Mellor D, et al. A systematic review of body dissatisfaction and sociocultural messages related to the body among preschool children. Body Image. 2016 Sep;1(18):86–95.
- Reinblatt SP, Leoutsakos J-MS, Mahone EM, et al. Association between binge eating and attention-deficit/hyperactivity disorder in two pediatric community mental health clinics. Int J Eat Disord. 2015 Jul;48(5):505–511.
- Hestetun I, Svendsen MV, Oellingrath IM. Associations between overweight, peer problems, and mental health in 12–13-year-old Norwegian children. Eur Child Adolesc Psychiatry. 2015 Mar;24(3):319–326.
- Tiffin PA, Arnott B, Moore HJ, et al. Modelling the relationship between obesity and mental health in children and adolescents: findings from the health survey for England 2007. Child Adolesc Psychiatry Ment Health. 2011 Oct 7;5:31.
- Griffiths LJ, Dezateux C, Hill A. Is obesity associated with emotional and behavioural problems in children? Findings from the Millennium Cohort Study. Int J Pediatr Obes. 2011 Jun;6(2Part2):e423–32.
- Sawyer MG, Miller-Lewis L, Guy S, et al. Is there a relationship between overweight and obesity and mental health problems in 4- to 5-year-old Australian children? Ambul Pediatr Off J Ambul Pediatr Assoc. 2006 Dec;6(6):306–311.
- Nahum Sacks K, Friger M, Shoham-Vardi I, et al. Prenatal exposure to gestational diabetes mellitus as an independent risk factor for long-term neuropsychiatric morbidity of the offspring. Am J Obstet Gynecol. 2016;215(3):380.e1–7.
- Xiang AH, Wang X, Martinez MP, et al. Association of maternal diabetes with autism in offspring. JAMA. 2015 Apr 14;313(14):1425–1434.
- Xiang AH, Wang X, Martinez MP, et al. Maternal gestational diabetes mellitus, type 1 diabetes, and type 2 diabetes during pregnancy and risk of ADHD in offspring. Diabetes Care. 2018;41(12):2502–2508.
- Côté S, Gagné-Ouellet V, Guay S-P, et al. PPARGC1α gene DNA methylation variations in human placenta mediate the link between maternal hyperglycemia and leptin levels in newborns. Clin Epigenetics. 2016;8:72.
- Katsuoka F, Yamamoto M. Small Maf proteins (MafF, MafG, MafK): history, structure and function. Gene. 2016 Jul 25;586(2):197–205.
- Töröcsik B, Angelastro JM, Greene LA. The basic region and leucine zipper transcription factor MafK is a new nerve growth factor-responsive immediate early gene that regulates neurite outgrowth. J Neurosci. 2002 Oct 15;22(20):8971–8980.
- Gabory A, Roseboom TJ, Moore T, et al. Placental contribution to the origins of sexual dimorphism in health and diseases: sex chromosomes and epigenetics. Biol Sex Differ. 2013 Mar 21;4(1):5.
- Matsuda KI, Mori H, Kawata M. Epigenetic mechanisms are involved in sexual differentiation of the brain. Rev Endocr Metab Disord. 2012 Sep;13(3):163–171.
- Guillemette L, Allard C, Lacroix M, et al. Genetics of glucose regulation in gestation and growth (Gen3G): a prospective prebirth cohort of mother–child pairs in Sherbrooke, Canada. BMJ Open [Internet]. 2016 Feb 3 [cited 2018 Dec 13];6(2):e010031. Available from: https://www.ncbi.nlm.nih.gov/pmc/articles/PMC4746442/
- Canadian Diabetes Association. Canadian diabetes association 2008 clinical practice guidelines for the prevention and management of diabetes in Canada. 2008;32(Supp 1)
- Ezpeleta L, Granero R, la Osa N, et al. Psychometric properties of the strengths and difficulties questionnaire3–4 in 3-year-old preschoolers. Compr Psychiatry. 2013 Apr;54(3):282–291.
- Goodman R. Psychometric properties of the strengths and difficulties questionnaire. J Am Acad Child Adolesc Psychiatry. 2001 Nov;40(11):1337–1345.
- Goodman A, Goodman R. Strengths and difficulties questionnaire as a dimensional measure of child mental health. J Am Acad Child Adolesc Psychiatry. 2009 Apr;48(4):400–403.
- Goodman A, Goodman R. Population mean scores predict child mental disorder rates: validating SDQ prevalence estimators in Britain. J Child Psychol Psychiatry. 2011;52(1):100–108.
- Goodman R, Renfrew D, Ka A, et al. Predicting type of psychiatric disorder from strengths and Difficulties questionnaire (SDQ) scores in child mental health clinics in London and Dhaka. Eur Child Adolesc Psychiatry. 2000;9(2):129-134.
- Pidsley R, Zotenko E, Peters TJ, et al. Critical evaluation of the illumina methylationEPIC BeadChip microarray for whole-genome DNA methylation profiling. Genome Biol. 2016 07;17(1):208.
- Rahmani E, Zaitlen N, Baran Y, et al. Sparse PCA corrects for cell-type heterogeneity in epigenome-wide association studies. Nat Methods. 2016 May;13(5):443–445.
- Du P, Zhang X, Huang -C-C, et al. Comparison of Beta-value and M-value methods for quantifying methylation levels by microarray analysis. BMC Bioinformatics. 2010;11(1):587.
- Sousa ARS, de Staff AC, Johnsen GM, et al. Evaluation of four commonly used normalizer genes for the study of decidual gene expression. Placenta. 2016 Jul;43:9–12.