
ABSTRACT
Epigenetic modifications, including DNA methylation and histone modifications, are reprogrammed considerably following fertilization during mammalian early embryonic development. Incomplete epigenetic reprogramming is a major factor leading to poor developmental outcome in embryos generated by assisted reproductive technologies, such as somatic cell nuclear transfer. However, the role of histone modifications in preimplantation development is poorly understood. Here, we show that co-knockdown (cKD) of Hdac1 and 2 (but not individually) resulted in developmental failure during the morula to blastocyst transition. This outcome was also confirmed with the use of small-molecule HDAC1/2-specific inhibitor FK228. We observed reduced cell proliferation and increased incidence of apoptosis in cKD embryos, which were likely caused by increased acetylation of TRP53. Importantly, both RNA-seq and immunostaining analysis revealed a failure of lineage specification to generate trophectoderm and pluripotent cells. Among many gene expression changes, a substantial decrease of Cdx2 may be partly accounted for by the aberrant Hippo pathway occurring in cKD embryos. In addition, we observed an increase in global DNA methylation, consistent with increased DNA methyltransferases and UHRF1. Interestingly, deficiency of RBBP4 and 7 (both are core components of several HDAC1/2-containing epigenetic complexes) results in similar phenotypes as those of cKD embryos. Overall, HDAC1 and 2 play redundant functions required for lineage specification, cell viability and accurate global DNA methylation, each contributing to critical developmental programmes safeguarding a successful preimplantation development.
Introduction
A distinguishing feature of preimplantation development is a remarkable reprogramming of the epigenome, including DNA modifications and post-translational histone modifications [Citation1,Citation2]. Aberrant epigenetic reprogramming has been associated with defects in various biological processes, including DNA replication and embryonic genome activation (EGA), which eventually leads to early embryonic death [Citation3]. Moreover, incomplete epigenetic reprogramming is a major contributing factor to the poor developmental outcome associated with the use of assisted reproductive technologies, including in vitro embryo production (IVP) [Citation4] and somatic cell nuclear transfer (SCNT) [Citation5–Citation10]. Indeed, modulation of certain epigenetic modifications has been proved a viable tool to enhance SCNT rate and obtain live cloned monkeys [Citation11]. However, little is known about the epigenetic regulation of critical developmental events (e.g., lineage development) and interactions between epigenetic modifications in preimplantation embryos.
Histone deacetylase (HDAC) 1 and 2 are highly homologous enzymes present together in multiprotein complexes, the most extensively characterized being NuRD [Citation12], SIN3 [Citation13], and CoREST [Citation14], which are conserved ranging from yeast to human [Citation15,Citation16]. Histone acetylation is well known for its role in transcriptional activation through opening of chromatin and nucleosome compaction [Citation17]. Accordingly, HDAC1/2-containing complexes are traditionally thought to act as transcriptional corepressors of target genes. However, HDAC1/2-containing complexes have also been shown to be tethered to actively transcribed genes, suggesting a critical role in transcriptional activation in certain situations [Citation15,Citation16,Citation18,Citation19].
Because of high homology and physical colocalization in large multiprotein complexes, it is reasonable that HDAC1 and HDAC2 are functionally redundant in multiple biological systems [Citation20–Citation23]. However, specific roles of HDAC1 and 2 have also been documented. For instances, Hdac2 is specifically involved in the regulation of memory formation and synaptic plasticity [Citation24]. In contrast, knockout of Hdac1 results in early lethality at peri-implantation stage [Citation25]. Furthermore, knockdown of both maternal and zygotic Hdac1 or Hdac2 by siRNA injection in preimplantation embryos results in no difference on blastocyst formation [Citation26]. These relatively mild phenotypes in preimplantation embryos may be caused by the functional redundancy of Hdac1 and 2. Therefore, the precise role of HDAC1 and 2 and the underlying molecular mechanisms during preimplantation embryogenesis remain unresolved.
In this study, we show that double knockdown of Hdac1 and 2, but not individually, resulted in lethality during the morula to blastocyst transition. The developmental failure is accompanied by a substantial perturbation of the transcriptomes and lineage development in conjunction with increased incidence of apoptosis, enhanced histone acetylation and genome-wide DNA methylation. We propose that Hdac1 and 2 play compensatory and essential roles during preimplantation development, at least partly through modulation of lineage specification, apoptosis and global DNA methylation.
Materials and methods
Ethics statement
All experiments involving lab animals were conducted according to the guidelines for the care and use of lab animals and approved by Zhejiang University.
Mouse embryo culture
Superovulation in B6D2F1 (C57BL/6 × DBA2, Charles River) female mice (8–10 weeks old) was performed by injecting 10 IU PMSG (San-Sheng pharmaceutical Co. Ltd., Ningbo, China) followed by 10 IU hCG (San-Sheng pharmaceutical Co. Ltd., Ningbo, China) 46–48 h later. At 20–22 h post-hCG treatment, zygotes were collected from B6D2 F1 female mice mated to B6D2 F1 males. Hyaluronidase (Sigma, St Louis, MO, USA) was used to remove cumulus cells. Zygotes were cultured in KSOM at 37°C/5% CO2. For FK228 treatment experiment, mouse morula were treated with Romidepsin (FK228, Depsipeptide, Selleck, 50 nM) for 12 h. For embryo transfer experiment, 2-cell stage control or cKD embryos were transferred into the oviduct of pseudo-pregnant female mice (ICR).
Outgrowth
For outgrowth formation experiment, individual blastocyst was collected on D4, removed of zona pellucida or kept intact, and incubated in DMEM (Gibco) containing 10% FBS (Gibco) on 48-well plates coated with 0.1% Gelatin (Gibco).
Microinjection
siRNAs and mRNAs were microinjected into the cytoplasm of zygote using a Piezo-drill (Eppendorf, Germany) and Eppendorf transferman micromanipulators. siRNA (20 µM; GenePharma, Shanghai) and/or synthetic mRNA (500 ng/µl) were loaded into microinjection pipette and constant flow was adjusted to allow successful microinjection. Approximately 10 pl of siRNA and/or mRNA was delivered into the cytoplasm of zygotes or 2 cell blastomere by microinjection. Sense and antisense sequences of siRNAs used in the present study were listed in Table S3.
In vitro RNA synthesis
Wildtype cDNA for Hdac1, Hdac2 and H2B-RFP were cloned into T7-driven vectors. Hdac1 mutants (H141A) were constructed as described previously [Citation27]. All sequences were confirmed by Sanger sequencing prior to use. To prepare mRNAs for microinjection, expression vectors were linearized and then were in vitro transcribed, capped and poly(A) tailed using T7 mMESSAGE mMACHINE Ultra Kit (Life Technologies, Grand Island, NY, USA) based on the manual. mRNA was recovered and purified by MEGAclear Kit (Life Technologies, Grand Island, NY, USA) and the integrity validated by electrophoresis.
Tunel
The embryos were washed in 0.1% PVP/PBS, fixed in 4% PFA for 10 min and permeabilized in PBS containing 0.5% Triton X-100 and 0.1% sodium citrate for 30 min. Then, the samples were incubated in a buffer solution of TDT 10X, CoCl2, 2 mM dATP, 0.5 units/μl terminal deoxynucleotidyl transferase enzyme and 0.5 mM FITC-dUTP for 1 h at 37°C in humidity. DNA was stained with DAPI. Samples were mounted onto slides and imaged with confocal microscope system (Zeiss LSM780).
Immunofluorescence
Preimplantation embryos were fixed with 4% paraformaldehyde in PBS for 10 min at room temperature, permeabilized with 0.5% Triton X-100 for 30 min, then blocked in 10% FBS/0.1% Triton X-100/PBS for 1 h after 3 times washing in 0.1% Triton X-100 PBS, and incubated with antibodies (Table S3) 1 h at room temperature or overnight at 4°C followed by incubation with Alexa Flour secondary antibodies 488, 595 (Invitrogen) at 37°C for 1 h. DNA was stained with DAPI and samples were mounted and observed with a Zeiss LSM780 confocal microscope (Zeiss).
Reverse transcription and real-time PCR
Total RNA from embryos was extracted using the Arcturus Picopure RNA isolation kit (Life Technologies, Grand Island, NY, USA). cDNA synthesis was performed using a reverse transcription system (Invitrogen). To quantify gene expression differences between KD and control groups, real-time PCR was performed on a StepOneTM system using FastStart Universal SYBR Green Master (Roche). H2a was used as an endogenous control.
Western blotting
Embryos were lysed on ice in RIPA lysis buffer (Beyotime) supplemented with 1 mM phenylmethylsulfonyl fluoride (Beyotime). Equal numbers of embryos were used in each group. Protein were separated by 8% SDS-PAGE and transferred to a polyvinylidene fluoride membrane (Millipore). Then, membrane was blocked with 5% non-fat milk and incubated with primary antibodies overnight at 4°C and secondary antibodies for 1.5 h at room temperature. Signals were detected with WESTAR NOVA 2.0 (Cyanagen).
RNA-seq and bioinformatic analysis
At E2.75, embryos were collected from NC and cKD groups (60 embryos per sample, n = 3). Total RNA was isolated from embryos using Picopure RNA isolation kit (Life Technologies, Grand Island, NY, USA) according to the manufacturer’s instruction. Before RNA extraction, 2 × 10⁶ copies of RFP and GFP mRNA was added. mRNAs were separated with oligo(dT)25 beads, and was used to prepare sequencing libraries with NEB Next Ultra RNA Library Prep Kit for Illumina (New England Biolabs). Briefly, mRNA was fragmented and reverse transcribed. The cDNA library was subject to end repair, poly(A)-tailing, adaptor ligation, and PCR amplification of 12–15 cycles for sequencing library construction. The library was sequenced by Illumina Hiseq X Ten and RNA-seq reads were assigned directly to transcripts and counted with Salmon (https://combine-lab.github.io/salmon/) [Citation28,Citation29]. Differential expression analysis was performed by DESeq2 package with P adjusted <0.05 and fold change >2 or <0.5. GO and KEGG analysis for enrichment of differentially expressed genes was determined using the Database for Annotation, Visualization and Integrated Discovery (DAVID).
Statistical analysis
Differences between two groups were determined by two-tailed unpaired Student’s t-tests. All experiments were repeated at least three times unless otherwise stated. For quantification of IF results, nuclear areas were outlined based on DAPI signal and mean intensity measured using NIH ImageJ. Signal intensities were normalized to control embryos. A value of P < 0.05 was considered to be statistically significant. RNA-seq results were analysed with R (http://www.rproject.org). Results are stated as mean ± S.E.M.
Results
Double knockdown of Hdac1 and 2 results in developmental arrest during morula to blastocyst transition
Previous RNA-seq (GSE44183, Fig. S1A) and quantitative PCR analysis revealed extensive expression of Hdac1 and 2 through preimplantation development [Citation33,Citation34]. As anticipated, we confirmed Hdac1 and 2 concentrated and co-localized in nucleoplasm of blastomeres from 2-cell to blastocyst stage (Fig. S1B). Moreover, both proteins appear evenly distributed in trophectoderm cells (TE) and inner cell mass (ICM) in the mouse blastocyst (Fig. S1B). Overall, these results imply Hdac1 and 2 may play an overlapping role during preimplantation development.
Both Hdac1 and 2 are maternally derived prior to the occurrence of the major wave of EGA at 2-cell in mice [Citation22,Citation34]. Conditional double knockout of Hdac1 and 2 in oocytes results in oogenesis failure [Citation22], prohibiting us from establishing knockout models of both maternal and zygotic Hdac1 and 2. We therefore decided to employ two complementary approaches to investigate the in vivo roles for Hdac1 and 2 in preimplantation development: RNAi and Hdac1/2-specific small-molecule inhibitor, FK228 [Citation35] ()).
Figure 1. Double knockdown of Hdac1 and 2 results in embryonic lethality during the morula to blastocyst transition. (a) Schematic overview of two approaches (I: RNAi; II: small-molecule inhibitor, FK228) used to investigate in vivo roles of Hdac1 and 2 during preimplantation development. (b) qPCR analysis of knockdown efficiency of siRNA cocktails targeting Hdac1 and 2 from 8-cell to blastocyst stage. Mouse zygotes derived in vivo were microinjected with Hdac1/2 siRNA cocktails (20 µM, 10 pl, cKD) or negative control siRNAs (NC). Embryos were collected at 8-cell (8c), morula (M), and blastocyst (Bl) stage (n = 3 pools of 5–10 embryos each per treatment). Data were stated as mean ± SEM normalized to endogenous control (H2afz; *P < 0.05). (c) Immunoblot analysis of Hdac1 and 2 in NC and cKD morulae (30 embryos per group, 2 replicates were performed with similar results). β-actin (Actb) was used as a loading control. (d) Immunocytochemical detection of dramatic reduction of Hdac1 and 2 protein in cKD blastocysts. Three replicates were conducted and at least 10 embryos analysed in each group (Scale bar: 25 µm). (e) Representative photos of NC, Hdac1 KD, Hdac2 KD, and cKD embryos from Day 3 after mating (D3) to D5. Arrow head: ICM outgrowth; Arrow: trophoblast giant cell. Asterisk: Degenerated embryos. (f) Blastocyst rate in NC and cKD groups at D4 (n = 5; 16–33 embryos per group per replicate). Data are shown as mean ± SEM (*P < 0.05). (g) Cell counting analysis of NC and cKD embryos from D2.5 to D4 (n = 3). (H) Per cent live offspring out of embryos transferred (n = 3; 15–20 embryos were transferred per group). (i and j) Rescue of cKD embryos by microinjection of exogenous Hdac1 and/or Hdac2 mRNA (n = 3; 15–20 embryos per group; *P < 0.05). (k) Blastocyst rate and total cell number per embryo in embryos treated with Hdac1/2-specific inhibitor, FK228 (n = 3; 15–20 embryos per group). Data are expressed as mean ± SEM. Different superscripts indicate significant differences (P < 0.05).
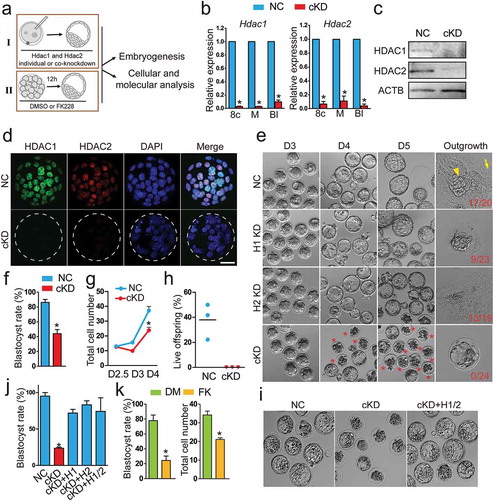
The effectiveness of the siRNAs and the inhibitor was verified. Analysis of qPCR revealed Hdac1 mRNA level was depleted by approximately 90% from 8-cell to blastocyst stage (n = 3, P < 0.05) after microinjection of Hdac1 siRNA cocktail (H1 KD) relative to control embryos injected with non-specific siRNA (NC, Fig. S2A; microinjection was performed at zygote stage). In accordance, Hdac1 protein abundance was also depleted (n = 3, Fig. S2B). Hdac2 protein abundance was not affected by H1 KD, suggesting a robust specificity of the siRNA (Fig. S2B). Similarly, the Hdac2 siRNA cocktail (H2 KD) produced a 90% knockdown at the mRNA level (n = 3, P < 0.05; Fig. S2A and 2B). Co-microinjection of siRNAs targeting Hdac1 and 2 (cKD) resulted in dramatic decreases in both endogenous Hdac1 (above 90% reduction) and Hdac2 (above 89% reduction) between the 8-cell to blastocyst stage (n = 3, P < 0.05; )). Immunoblotting (n = 2) and IF (n = 3) analysis confirmed a successful reduction of the amount of Hdac1 and 2 protein in morula and blastocysts (). Because of Hdac1 and 2’s critical roles in histone de-acetylation, IF was performed to determine if histone acetylation was affected. The amount of histone H3 lysine 14 acetylation (H3K14ac) and H4K5ac was increased by 72.9% and 64.4%, respectively, in cKD embryos relative to controls (n = 3, P < 0.05; Fig. S3A and 3B). Similarly, treatment of mouse morula with FK228 increased both H3K14ac (by 116%) and H4K5ac (by 67.0%) relative to the vehicle control (DMSO; n = 3, P < 0.05; Fig. S3D and 3E). Taken together, these results suggest the siRNAs and inhibitor are highly effective in the context of preimplantation development.
We next monitored the developmental potential of embryos of NC, H1 KD, H2 KD, and cKD. No morphological difference was observed in H1 KD and H2 KD groups compared with NC throughout preimplantation development ()), consistent with a previous study [Citation26]. Both the blastocyst rate (above 80%, Fig. S4A) and total cell number per embryo (Fig. S4B) were normal in the H1 KD and H2 KD groups. By contrast, the cKD embryos appeared normal up to the morula stage ()) but more than half of cKD embryos fail to develop into blastocysts (n = 5, P < 0.05; )). Cell counting analysis revealed that total cell number per embryo declined from D3 (D3: 15.6 ± 1.1 vs 9.9 ± 0.9; D4: 37.2 ± 2.8 vs 23.8 ± 2.1; P < 0.05; )). To evaluate if the development of cKD embryos was delayed, the embryos were continually cultured in vitro until D5. At D5, the majority of cKD embryos collapsed whereas NC blastocysts completed hatching, ruling out the possibility of developmental delay ()). To test the developmental competency of the blastocysts that do develop in cKD groups, blastocysts were cultured individually to examine if outgrowths could be formed. Consistent with our previous report [Citation36], the potential to form embryo outgrowth is compromised in H1 KD group, but not H2 KD group () and S4C). In contrast, none of cKD blastocysts are capable to form outgrowths (0/24 vs 17/20, n = 3), even after zona pellucida removal ()). To test if the in vivo environment could alleviate the phenotype, 2-cell embryos of NC and cKD groups were transferred into surrogates. Embryo transfer analysis revealed that cKD embryos failed to generate live offspring whereas 22–50% embryos transferred in NC group developed to term (n = 3, )). In sum, these results suggest Hdac1 and 2 play a compensatory role in supporting preimplantation development.
Three experiments were performed to verify the initial siRNA findings. First, an alternative cocktail of siRNAs targeting 5’ and 3’ untranslated regions (5’ and 3’ UTR) of Hdac1 and 2 was used. Developmental arrest during morula to blastocyst transition was also observed with reduced blastocyst rate (23.6% vs 95.0% in NC; n = 3, P < 0.05; ). Second, the development of cKD embryos could be rescued (blastocyst rate>70%) by co-injection of exogenous Hdac1 and/or Hdac2 mRNA transcribed in vitro that were not targeted by the siRNAs (n = 3, P < 0.05; , S4D, and S4E). Last, treatment of mouse morula with FK228 also resulted in reduced blastocyst rate (24.3% vs 77.9% in control group, n = 3, P < 0.05) and total cell number per embryo (34 vs 21, n = 3; )). Overall, a combination of loss of function approaches (RNAi plus small-molecule inhibitor) and rescue experiments confirm the specificity of our approach and the essential role of Hdac1 and 2 in preimplantation development.
Effect of cKD on transcriptomic profile of preimplantation embryo
To delineate the molecular basis of the developmental arrest of cKD embryos, we carried out RNA-seq in NC and cKD morulae, obtained prior to the emergence of morphological phenotypes (to avoid bias, )). Hierarchical clustering revealed a separation between NC and cKD morulae (n = 3; Fig. S5A). We found that 991 genes were differentially expressed (Fold changes (FC) >2 or <0.5, P adjusted<0.05; Table S1), 72% of which were upregulated, consistent with the notable role of Hdac1/2 as transcriptional repressors. Expression of select genes (Down: Myc, Dab2, Amot, Fgfr2, and Otx2; Up: Arid3a and Sfmbt2; No change: Tet1 and Ctnnb1) was confirmed by qPCR analysis ()).
Figure 2. RNA-seq analysis of embryos deficient of Hdac1 and 2. (a) Schematic overview of the samples collected for RNA-seq analysis (n = 3; 60 embryos/group/replicate). (b) Validation of RNA-seq results on expression levels of selected genes (Downregulated:Myc, Dab2, Amot, Cdh1, Fgfr2, Otx2; Upregulated: Arid3a, Sfmbt2; No change: Tet1, Ctnnb1). Three biological replicates were performed with 5–10 morula collected for each group (*P < 0.05). (c) GO analysis of downregulated genes in cKD morulae. The data indicate enriched GO terms related to epigenetic regulation, cell proliferation, and apoptosis. (d) KEGG analysis of differentially expressed genes (DEGs) between NC and cKD morulae. The data indicate cKD leads to abnormal signalling pathway of pluripotency network, P53 and Hippo. (e) Overrepresentation of genes related to lineage specification, cell cycle, and epigenetic regulation among DEGs.
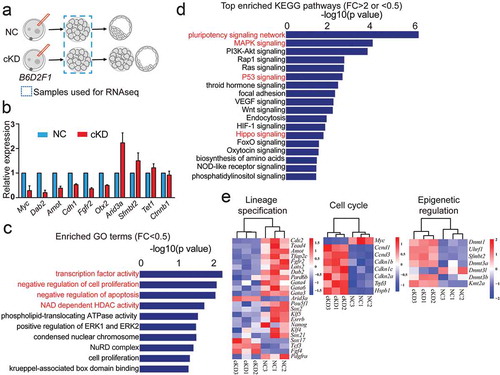
Gene ontology (GO) analysis revealed that the top GO terms (biological processes) enriched in differentially expressed genes (DEGs; FC>2 or <0.5) include processes involved in DNA transcription, cell differentiation, cell proliferation and apoptosis (Fig. S5B). Specifically, GO analysis of downregulated genes (FC<0.5) showed that enriched GO terms include transcription factor activity, cell proliferation, apoptosis, NAD-dependent HDAC acitivity and NuRD complex ()). Moreover, KEGG analyses revealed top hits in signalling pathways regulating pluripotency, MAPK, P53 and Hippo signalling ()).
Among the downregulated genes, we observed an over-representation of TE-specific genes (Cdx2, Dab2, Fgfr2), genes associated with Hippo signalling (Tead4, Amot, Lats2) and genes related with pluripotency networks (Nanog, Klf5, Sox2, Pou5f1, Myc) ()). Among the upregulated genes, we observed an enrichment of genes related to cell cycle progression and apoptosis (Trp53, Ccnd1, Ccnd3, Cdkn1b, Cdkn1c, Cdkn2a) and genes related to chromatin modification, including Dnmt1 and Uhrf1 ()). Taken together, the transcriptome profiling implies that embryos lacking Hdac1 and 2 do not properly initiate early lineage differentiation, cell proliferation, and genome-wide methylation in preimplantation embryos.
Hdac1 and 2 reduction leads to increased apoptosis, increased TRP53 acetylation and defective proliferation in preimplantation embryos
Because total cell number per embryo was drastically reduced in cKD ()) and RNA-seq analysis in cKD embryos identified genes related with apoptosis among the DEGs ()), we performed assays to test if apoptosis was abnormal in cKD embryos. The incidence of apoptosis was markedly increased in cKD blastocysts (90%, n = 10) relative to controls (10%, n = 10) ()).
Figure 3. Hdac1 and 2 deficiency leads to increased incidence of apoptosis, increased TRP53 acetylation, and cell proliferation arrest. (a) TUNEL analysis of NC (n = 10) and cKD blastocysts (n = 10). The data revealed a dramatic increase of incidence of apoptosis in cKD blastocysts. Three biological replicates were conducted. (b) Immunocytochemical analysis of TRP53 acetylated on K379 (P53ac) in blastocysts. The intensity of P53ac was improved significantly (n = 3; 5–10 embryos per group per replicate, Scale bar: 25 μm). Nuclear was counterstained with DAPI. (c) Hdac1 was mutated at the deacetylase site and mRNA was in vitro produced. Wildtype Hdac1 (H1 WT) and mutant Hdac1 (H1 MT) was introduced into wild-type zygotes and 2-cell embryos were collected for immunocytochemical analysis (n = 3; 5–10 embryos per group per replicate, Scale bar: 25 μm). (d) The intensity of P53ac was not changed in H1 WT embryos but increased in H1 MT embryos (*P < 0.05). (e) Immunocytochemical examination of histone H3 serine 10 phosphorylation (pH3S10), a marker for late G2 and mitosis, in blastocysts (n = 3; 5–10 embryos per group per replicate; Asterisk: pH3S10 positive blastomere; Scale bar: 25 μm).
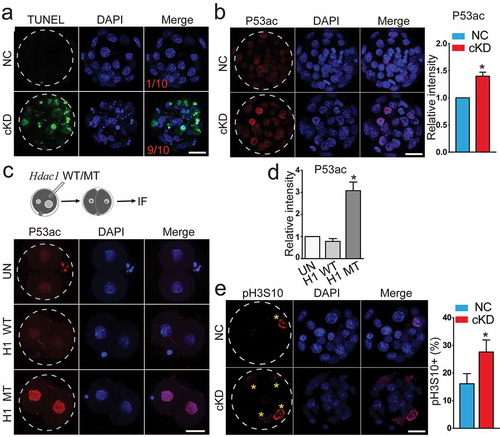
TRP53 is a critical molecule regulating apoptosis and was also upregulated in cKD morulae as determined by RNA-seq. In addition, TRP53 activity has been shown to be repressed in a Hdac1-dependent manner through de-acetylation [Citation27]. Our results showed that the amount of TRP53 acetylation at lysine 379 (p53ac) was greater in cKD ()) or FK228-treated embryos relative to controls (Fig. S6A). To ascertain if Hdac1’s deacetylase activity is directly responsible for TRP53 acetylation in the context of preimplantation development, we performed mutagenesis at the deacetylase site of Hdac1 and injected wild-type Hdac1 (H1 WT) and mutant Hdac1 (H1 MUT) mRNA into normal zygotes ()). No difference was observed in H1 WT-injected embryos relative to uninjected controls (UN; ). In contrast, there is a dramatic increase of p53ac in H1 MUT-injected embryos ()). Overall, these results indicate Hdac1’s enzymatic activity is directly responsible for deacetylation of the non-histone protein, TRP53, during preimplantation stages.
To ascertain if cell proliferation was affected by cKD, we performed IF against histone H3 serine 10 phosphorylation (pH3S10), a marker for late G2/M phase. Only 16.2% of blastomeres in control morulae were subject to mitosis whereas the incidence of pH3S10 positive blastomeres was increased significantly in cKD embryos (27.7%; )), suggesting a cell cycle block at G2/M phase.
Interphase bridges have recently been identified as a critical subcellular structure for mouse preimplantation embryos [Citation37]. As anticipated, interphase bridges were detected at cell-cell junctions in control embryos (Fig. S6B arrows). Number of interphase bridges in H1 KD or H2 KD embryos is comparable or increased relative to controls but was reduced in cKD embryos (Fig. S6B), suggesting an aberrant cellular communication in the absence of Hdac1/2.
Double knockdown of Hdac1 and 2 results in failed lineage specification of trophectoderm and inner cell mass
Transcriptome profiling revealed substantial enrichment of TE-specific and pluripotency network genes among DEGs ()). The earliest lineage specification takes place during the morula to blastocyst transition and generates TE (precursors of the majority of placental cells) and ICM (precursors of the embryo proper), we thus decided to examine the cell differentiation programme in cKD embryos. We quantified the expression of CDX2, a critical molecular marker of TE. Abundance of Cdx2 mRNA was unchanged through blastocyst stage in H2 KD embryos and downregulated slightly in H1 KD morulae and blastocysts (Fig. S7A). IF results displayed a normal distribution of CDX2 signal in both H1 and H2 KD embryos (Fig. S7B). In contrast, Cdx2 mRNA and protein were diminished in cKD embryos during the morula to blastocyst transition (), which was confirmed in FK228-treated embryos (). The expression of Cdx2 in cKD embryos could be successfully rescued by injection of either Hdac1 or 2 mRNA (). To further determine if reduced expression of CDX2 was cell-autonomous, we injected siRNAs into one of two blastomeres at 2-cell stage and H2B-RFP was used as a lineage-tracing marker ()). Surprisingly, we found CDX2 disappeared not only in blastomeres derived from siRNA-injected but un-injected cells, suggesting Hdac1/2 is involved in regulation of signalling molecules upstream of Cdx2 expression ()).
Figure 4. CDX2 was inactivated in embryos deficient of Hdac1 and 2. (a) qPCR analysis of Cdx2 in 8-cell embryos, morula and blastocysts (n = 3 pools of 5–10 embryos each per group). (b–e) Immunocytochemical analysis of CDX2 in morula and blastocysts after RNAi (b and c) or FK228 treatment (d and e). Three biological replicates with 5–10 embryos analysed per group each time. The intensity of CDX2 was diminished in cKD and FK228 treated, but not H1 or H2 KD embryos (c and e). E-Cad: E-Cadherin; DM: DMSO; FK: FK228. (f and g) Rescue of CDX2 in cKD embryos after injection of exogenous Hdac1 or 2. The experiment was conducted three times and 5–10 embryos analysed per group per time. Yellow dashed oval: inner cell mass. (h) Non-specific siRNAs or siRNAs cocktail targeting Hdac1 and 2 were microinjected into one blastomere at 2-cell stage. H2B-RFP mRNA was co-injected as a tracking marker. Blastocysts were collected for immunocytochemical analysis (n = 3; 5–10 embryos per group per replicate). The intensity of CDX2 was diminished not only in cells derived from the siRNA-injected blastomere but those from noninjected blastomere in cKD groups. For panels B, F, and H, single confocal sections are shown for individual staining figures and maximum projections are shown for merge figures.
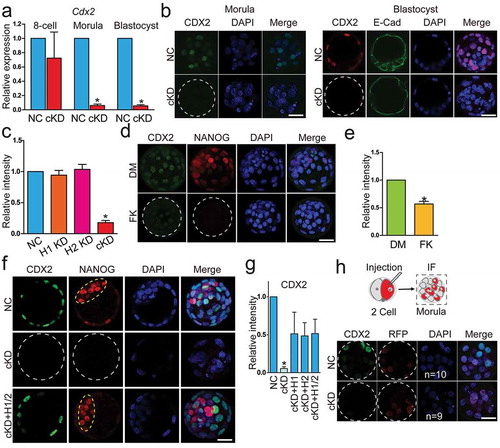
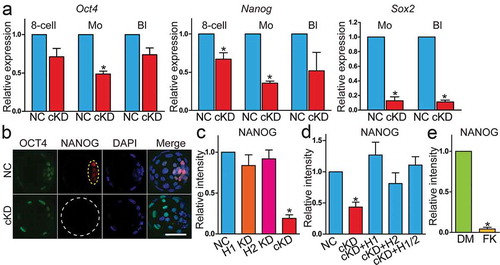
We next examined if the molecular signature of ICM was disrupted in embryos lacking Hdac1 and 2. Expression of OCT4, NANOG and Sox2 at both mRNA and protein level was unchanged in H1 or H2 KD embryos (Fig. S8A and 8B). However, mRNA level of Oct4, Nanog and Sox2 was reduced in cKD groups during the morula to blastocyst transition ()). Similarly, FK228 treatment led to a decrease in mRNA abundance of Oct4 and Nanog (Fig. S8C). IF results indicated no significant change of OCT4 signal; however, NANOG and Sox2 levels were dramatically decreased in cKD blastocysts ( and Fig. S8E), which was also confirmed using FK228 (Fig. S8D). Collectively, these data demonstrate a failure of the first cell fate decision that normally gives rise to TE and ICM cells.
Figure 5. Key pluripotency genes OCT4, NANOG,and Sox2 were downregulated in embryos deficient of Hdac1 and 2. (a) qPCR analysis of Oct4, Nanog, and Sox2 in NC and cKD embryos (n = 3 pools of 5–10 embryos each per group). (b and c) Immunocytochemical analysis of OCT4 and NANOG in blastocysts after RNAi. The intensity of NANOG, but not OCT4, was diminished in cKD embryos (panel C; n = 3; 5–10 embryos were analysed per group each time, *P < 0.05). Yellow dashed oval: inner cell mass. (d) Rescue of NANOG in cKD embryos after injection of exogenous Hdac1 and/or 2. The experiment was conducted three times and 5–10 embryos analysed per group per time. (e) Analysis of the intensity of NANOG in embryos treated with either DMSO (DM, vehicle control) or FK228 (FK).
The second lineage specification occurs in the late blastocysts when the ICM differentiates into epiblast (Epi) and primitive endoderm (PrE). We examined GATA6, a marker of PrE, and NANOG, a marker of Epi, to determine if the second lineage specification failed as well. Results showed GATA6 and NANOG are mutually exclusively distributed in ICM in control blastocysts; however, no GATA6 and NANOG positive cells were visible in cKD embryos (Fig. S8F), confirming a failure of the earliest two lineage specification programmes in mouse preimplantation embryos.
Abnormal hippo pathway in embryos deficient of both Hdac1 and 2
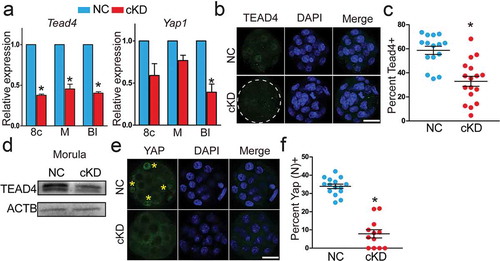
Hippo pathway components were enriched in GO analysis of DEGs between cKD and control morulae ()). Hippo pathway plays a critical role in defining TE specification programme during mouse preimplantation development [Citation38]. Starting from the morula stage, Tead4 and Yap1 act as upstream regulators of CDX2 and localize in the nucleus of TE cells [Citation38]. IF results showed that no visible difference was detected in Tead4 and Yap1 in H1 or H2 KD embryos (Fig S9A-C). However, Tead4 mRNA was reduced in cKD from 8-cell to blastocyst stage while Yap1 mRNA was slightly reduced ()). IF analysis revealed that the number of Tead4 positive blastomeres was reduced by 50% in cKD group (). Immunoblotting analysis further confirmed that the protein abundance of Tead4 was diminished in cKD morulae ()). Additionally, the per cent Yap positive cells declined by 75% in cKD groups relative to controls (). Lats1 and Lats2 are upstream molecules that modulate the activity of Yap [Citation39]. Our qPCR results documented that mRNA of both genes was reduced significantly in cKD morulae (Fig S9A), suggesting their abnormal expression could account for defective Hippo signalling that we observed in the absence of Hdac1/2 activity.
Figure 6. Hda1 and 2 co-knockdown results in aberrant Hippo signalling pathway. (a) qPCR analysis of Tead4 and Yap1 in 8-cell embryos (8c), morula (M), and blastocysts (Bl) (n = 3 pools of 5–10 embryos each per group). (b–d) Immunocytochemical (n = 3; 6–10 embryos were analysed per group each time, *P < 0.05) and immunoblot analysis (n = 2 pools of 30 embryos each per group, similar effects were obtained) of Tead4 in morula after RNAi. Both per cent Tead4 positive cells (panel C) and the intensity of Tead4 (panel D) were reduced in cKD. (e and f) Immunocytochemical analysis of Yap in morula (n = 3; 5–10 embryos were analysed per group each time). Asterisk: nuclear Yap.
Genome-wide DNA methylation was enhanced in blastocysts deficient of both Hdac1 and 2
A wave of genome-wide DNA demethylation occurs after fertilization through preimplantation development, the molecular mechanism of which remains unclear [Citation1]. Changes in the expression of Dnmt1 and Uhrf1 were notable in our RNA-seq analysis given their central role in DNA methylation ()). Thus, we sought to determine the global DNA methylation by examining 5-cytosine methylation (5mc) and 5-cytosine hydroxymethylation (5hmc), a newly defined DNA modification. Amounts of both DNA modifications are increased in cKD, but not in individual KD groups at blastocyst stage (n = 3, P < 0.05; )), which was also seen in FK228-treated embryos (n = 3, Fig S10C). However, little effect was observed on histone H3 lysine 4 trimethylation (H3K4me3), a marker for transcriptional activation, and histone H3 lysine 9 dimethylation (H3K9me2), a marker for transcriptional repression (Fig S10A and S10B).
Figure 7. Increased global DNA methylation with upregulated DNA methyltransferases in embryos deficient of Hdac1 and 2. (a) Immunocytochemical analysis of 5’ methylcytosine (5mc) and 5 hydroxmethylcytosine (5hmc) in blastocysts. The intensity of 5mc and 5hmc was increased in cKD embryos (C and E) (n = 3; 5–10 embryos were analysed per group each time, *P < 0.05). (b–c) Hdac1 and 2 deficiency results in increased intensity of Uhrf1, Dnmt3a, and Dnmt3b. The experiment was conducted three times and 8–10 embryos analysed per group (*P < 0.05; Scale bar: 25 µm).
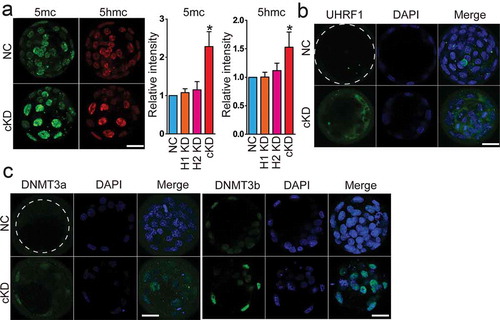
Previous studies report Hdac1 physically interacts with DNA methyltransferases (Dnmts) and regulates the stability of Dnmt1 [Citation40–Citation43]. There are three Dnmts present in preimplantation embryos: Dnmt1, 3a and 3b. Uhrf1 is a Dnmt1-interacting protein involved in the recruitment of Dnmt1 to maintain DNA methylation [Citation44]. The amount of Uhrf1 was increased not only in the nuclear but also in the cytoplasm in cKD blastocysts relative to control (n = 3; )). We have not found Dnmt1 antibody available for IF. However, immunoblotting analysis revealed an increase in Dnmt1 abundance when Hdac1/2 were inhibited (Fig S10E). In addition, Dnmt3a and 3b were barely detected in control mouse blastocysts whereas their signal intensity was significantly improved in cKD or FK228-treated embryos ( and S10D). In summary, we conclude Hdac1 and 2 are critical for maintaining global DNA methylation properly through modulating the amount of Dnmts in preimplantation embryos.
Double knockdown of Rbbp4 and 7 results in similar phenotypes as Hdac1/2 cKD embryos
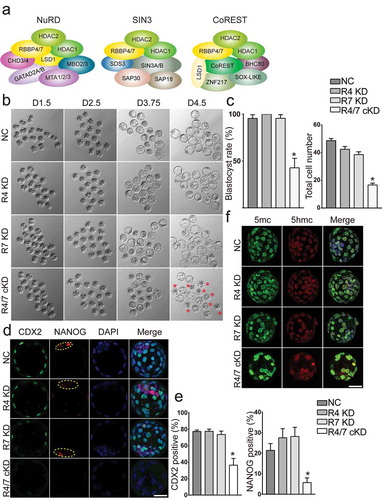
Rbbp4 and 7 (also known as RbAp48 and 46) are two homologous chromatin-binding proteins that interact with Hdac1/2 to form the core components of multiple transcriptional corepressors, including Sin3a, NuRD, and CoREST [Citation15] ()). Both proteins have direct interactions with histone tails and are potentially responsible for recruitment of Hdac1/2-containing complexes to target sites. We next performed RNAi experiment to examine the functional consequences after knocking down Rbbp4 and 7. Effectiveness of siRNAs targeting Rbbp4 and 7 was verified by IF analysis (Fig S11A and B). Analysis of embryogenesis in vitro showed that individual knockdown of Rbbp4 or 7 has no effect on preimplantation development; however, co-knockdown of Rbbp4 and 7 results in poor blastocyst rate and reduced total cell number per embryo at D4 (). The phenotype similarity between Rbbp4/7 cKD and Hdac1/2 cKD embryos prompted us to determine if defects in lineage specification and genome-wide methylation were also found. Both CDX2 and NANOG were diminished in Rbbp4/7 cKD embryos (). An increase in global 5mc but not 5hmc was found in Rbbp4/7 cKD groups relative to controls ()).
Figure 8. Rbbp4 and 7 deficiency leads to similar phenotypes as in Hdac1/2 cKD embryos. (a) Hdac1, Hdac2, Rbbp4, and Rbbp7 are core components in several epigenetic complexes: NuRD, Sin3, and CoREST. (b) Developmental potential of embryos lacking Rbbp4 and/or Rbbp7. Three replicates were conducted with 15–20 embryos analysed per group per replicate. (c) Blastocyst rate and cell counting analysis of the experiment in panel B. (d) Both CDX2 and NANOG were diminished in Rbbp4 and 7 cKD embryos. (e) CDX2 or NANOG positive blastomeres were reduced in Rbbp4 and 7 cKD embryos. (f) Immunostaining analysis of 5mc and 5hmc.
Discussion
This report demonstrates that there is a functional redundancy for Hdac1 and Hdac2 in supporting preimplantation development. Depletion of both Hdac1 and 2 results in embryonic arrest during the morula to blastocyst transition with greatly disrupted transcriptome-wide expression profiles. Importantly, we document defects in three critical molecular events. First, TRP53 acetylation was induced and may contribute to increased apoptosis and cell cycle arrest. Second, lineage specification that generates TE and ICM was dramatically perturbed with defects including suppressed Cdx2 expression and aberrant Hippo pathway. And third, a global increase of DNA methylation. Taken together, the combination of these effects contributes to the developmental failure of cKD embryos.
Double knockdown of Hdac1 and 2 in mouse preimplantation embryos results in developmental failure to pass blastocyst stage ()). Previous studies and our present results indicate that independent knockdown of Hdac1 or Hdac2 does not affect blastocyst formation, suggesting a dispensable role during preimplantation development [Citation22,Citation36]. However, the developmental failure of cKD embryos suggests the viability of Hdac1 or Hdac2-depleted embryos is due to functional redundancy of these closely related genes. In particular, we found compensatory roles of Hdac1 and Hdac2 in regulation of lineage specification, genome-wide methylation, and expression of critical genes, such as CDX2 and NANOG. Overall, these two enzymes function redundantly during preimplantation development.
Transcriptome profiles were disturbed in embryos deficient of Hdac1 and 2. Hdac1/2 cannot bind to DNA directly. However, they can be tethered to DNA by many distinct transcription factors including YY1 [Citation45], p130 [Citation46], and TRP53 [Citation47]. Moreover, Hdac1/2 are recruited to DNA as components of multiprotein complexes, including Sin3a, NuRD, and the CoREST, which are well known for their transcriptional repressor activity. These facts could be the reason that the majority of DEGs are upregulated genes after double knockdown of Hdac1 and 2. One possible explanation is that improved histone acetylation after Hdac1/2 cKD (e.g., H3K27ac) could mediate the upregulated gene expression since histone acetylation (in particular H3K27ac) is associated with gene activation. By comparing with H3K27ac ChIPseq data (GSE72784), we found 9% (66 out of 711 genes) and 54% (382/711) up-regulated genes have detected H3K27ac peaks within 10kb and 100kb of the genes, respectively (data not shown), suggesting that upregulated gene expression is directly associated with H3K27ac.
Lysine acetylation occurs not only to histones but various non-histone proteins, such as mitochondrial and cytosolic proteins [Citation48]. Hdac1/2 could also act as an ‘eraser’ of these non-histone acetylation events [Citation48]. TRP53 is one of these non-histone proteins that is subject to acetylation. TRP53 plays a central role in a variety of biological processes including cell cycle arrest, DNA damage repair, apoptosis and metabolic changes [Citation49]. Our results clearly revealed the direct role of Hdac1 in acetylation of TRP53. Recently, Ma et al. also demonstrated that double knockout of Hdac1 and 2 leads to increased TRP53 acetylation. Overall, these results suggest it is a conserved mechanism on the direct regulation of Hdac1 and 2 on TRP53 acetylation [Citation27].
Total cell counting and IF analysis suggest a cell cycle arrest in G2/M phase in cKD embryos. Previous studies demonstrated Hdac1 and 2 are associated with cell cycle progression across different cell types or tissues [Citation20,Citation25,Citation50,Citation51]. For instance, loss of Hdac1 and 2 in dividing cells results in a cell cycle block at G1 phase, which is partly attributed to the rise of the CDK-inhibitors, including p21 and p57 [Citation21]. However, we found no difference in p21 and p57 expression in cKD embryos, suggesting a different cell cycle block mechanism.
During the morula to blastocyst transition, the first lineage specification occurs with the regulation of contractility and critical signalling pathways, including Hippo and Notch [Citation38]. Core lineage-specific transcription factors, including Cdx2 (TE-specific), and Oct4 and Nanog (ICM-specific), are initially stochastically expressed and are gradually confined to specific lineages. However, it remains poorly understood how the expression of these factors themselves is controlled. Deficiency of Hdac1 and 2 results in failure of both the TE and ICM differentiation programme. A dramatic reduction in blastocyst rate was observed and those cKD blastocysts that do form fail to outgrow, suggesting a lacking of functional ICM and TE. At a molecular level, expression of key marker genes, Cdx2, Nanog and Oct4 were suppressed. In particular, NANOG and CDX2 signal was barely seen in cKD embryos. Although the intensity of OCT4 was normal, its localization was not restricted to a subset of cells. Interestingly, the CDX2 in the uninjected blastomere of 2-cell was also affected, which may be due to the reason that the siRNA injected into one blastomere entered the uninjected blastomere via the cytoplasmic bridge that is retained for some time following cleavage to the 2-cell stage. These results collectively suggest Hdac1 and 2 are master regulators of the first lineage specification. Both RNA-seq and qPCR results suggest Hdac1 and 2 are involved in the transcription of these key lineage-specific genes () and ). Indeed, ChIP-seq analysis shows that Hdac1 is enriched in active genes in ES and TS cells, such as TE-specific genes Cdx2, Elf5 and Eomes and pluripotency network genes Oct4, Nanog and Sox2 [Citation18]. These results may warrant further investigation through low input Chip-seq to determine if Hdac1 and Hdac2 colocalize at these critical genes during preimplantation stages [Citation52].
The Hippo signalling pathway plays a crucial role in the first lineage specification, in particular for TE-specific programme [Citation38]. Loss of Tead4 leads to lethality with a failure to generate functional TE and triggers downregulation of CDX2 [Citation53]. As a central component of Hippo pathway, Yap could switch between nucleus and cytoplasm, which is phosphorylation-dependent. Yap acts as a transcriptional activator of Tead4 to induce TE-specific genes [Citation39]. Both Tead4 and Yap are disrupted in cKD embryos. Lats1 and Lats2 are both upstream regulators of Yap1 [Citation39]. Their expression was also reduced in cKD embryos. Interestingly, RNA-seq results also displayed dysregulation of genes in the Hippo pathway ()). Thus, the downregulation of CDX2 in cKD embryos may be partly due to aberrant Tead4 and Yap1 expression.
Our results suggest Hdac1 and 2 are critical for maintaining correct DNA methylation pattern during preimplantation development. Genome-wide removal of DNA methylation (5mc) occurs during preimplantation development, contrasting with stable DNA methylation pattern in somatic cells. There are two types of DNA demethylation: passive DNA demethylation that is DNA-replication-dependent and active demethylation that is achieved by enzymatically driven reactions. Our results show that Hdac1 and 2 affect the global active demethylation through regulating Dnmts and Uhrf1, a critical protein for recruiting Dnmt1 to specific DNA sequences. Increased Dnmt3a, 3b, and Uhrf1 protein abundance could be explained by increased transcripts in cKD embryos. However, we cannot rule out the possibility that loss of Hdac1 and 2 may affect the stability of Dnmts in preimplantation embryos. In contrast, Ma et al. found conditional knockout of Hdac1 and 2 in mouse oocytes resulted in a global decrease in DNA methylation and particularly reduced nuclear associated Dnmt3a [Citation43]. The discrepancy suggests a developmental context-dependent role of Hdac1/2 in regulation of Dnmts.
Functional analysis of Rbbp4 and 7 suggest these two proteins are critical components for ensuring functionality of Hdac1/2-containing chromatin complexes. Hdac1/2 and Rbbp4/7 are shared among several critical transcriptional corepressor, including Sin3a, NuRD and CoREST [Citation15]. Rbbp4/7 interacts directly with histone tails (H3 and H4) and are promising candidates for recruiting these epigenetic complexes. Interestingly, our results indicate Rbbp4 and 7 play a redundant function essential for preimplantation development, similar with Hdac1/2 cKD. We propose that Hdac1/2-Rbbp4/7-containing complexes are critically required for preimplantation development. Indeed, our previous studies documented an essential role of Suds3, a component of Sin3a complex, during preimplantation development with critical functions in lineage specification [Citation36].
In summary, we documented a compensatory role of Hdac1 and 2 during preimplantation development. Hdac1 and 2 are essential for the regulation of cell cycle progression and apoptosis, which is probably mediated through acetylation of TRP53. Additionally, Hdac1 and 2 are required for the first cell differentiation programme with a critical role in controlling expression of key TE and pluripotency-specific genes. In the context of chromatin regulation, Hdac1/2 are involved in maintaining proper genome-wide DNA methylation with dramatic effects on the protein abundance of Dnmts. Last but not least, deletion of Rbbp4 and 7, both structural partners of Hdac1/2 in several epigenetic complexes, results in similar phenotypes as Hdac1/2 cKD. Further understanding of the mechanisms of epigenetic control during these early key molecular events will help the development of tools to reduce early embryonic lethality and improve the success of reproductive cloning in mammals.
Supplemental Material
Download Zip (27.5 MB)Acknowledgments
We thank all members of the K. Zhang laboratories for their helpful discussions; S. Hong (Lab Animal Core Facility, Zhejiang University) for help in embryo transfer; Alan D. Ealy (Virginia Tech, Blacksburg, Virginia, USA) for critically reading the manuscript. This work was supported by National Natural Science Foundation of China (No. 31672416 and No. 31872348 to K. Zhang), the Zhejiang Provincial Natural Science Foundation of China (LY19C180002 to H. Wang) and the Foundation of Key Laboratory of Veterinary Biotechnology (No. klab201708 to K. Zhang), Shanghai, China.
Disclosure statement
No potential conflict of interest was reported by the authors.
Supplementary material
Supplementary data for this article can be accessed here.
Additional information
Funding
Related Research Data
References
- Eckersley-Maslin MA, Alda-Catalinas C, Reik W. Dynamics of the epigenetic landscape during the maternal-to-zygotic transition. Nat Rev Mol Cell Biol. 2018;19(7):436–450.
- Schultz RM, Stein P, Svoboda P. The oocyte-to-embryo transition in mouse: past, present, and future. Biol Reprod. 2018;99(1):160–174.
- Matoba S, Zhang Y. Somatic cell nuclear transfer reprogramming: mechanisms and applications. Cell Stem Cell. 2018;23(4):471–485.
- Chen Z, Hagen DE, Elsik CG, et al. Characterization of global loss of imprinting in fetal overgrowth syndrome induced by assisted reproduction. Proc Natl Acad Sci U S A. 2015;112(15):4618–4623.
- Liu W, Liu X, Wang C, et al. Identification of key factors conquering developmental arrest of somatic cell cloned embryos by combining embryo biopsy and single-cell sequencing. Cell Discov. 2016;2:16010.
- Matoba S, Liu Y, Lu F, et al. Embryonic development following somatic cell nuclear transfer impeded by persisting histone methylation. Cell. 2014;159(4):884–895.
- Gao R, Wang C, Gao Y, et al. Inhibition of aberrant DNA Re-methylation improves post-implantation development of somatic cell nuclear transfer embryos. Cell Stem Cell. 2018;23(3):426–435 e425.
- Chung YG, Matoba S, Liu Y, et al. Histone demethylase expression enhances human somatic cell nuclear transfer efficiency and promotes derivation of pluripotent stem cells. Cell Stem Cell. 2015;17(6):758–766.
- Zhou C, Wang Y, Zhang J, et al. H3K27me3 is an epigenetic barrier while KDM6A overexpression improves nuclear reprogramming efficiency. Faseb J. 2019;33(3):4638–4652.
- Liu X, Wang Y, Gao Y, et al. H3K9 demethylase KDM4E is an epigenetic regulator for bovine embryonic development and a defective factor for nuclear reprogramming. Development. 2018;145(4):dev155317.
- Liu Z, Cai Y, Wang Y, et al. Cloning of macaque monkeys by somatic cell nuclear transfer. Cell. 2018;174(1):245.
- Xue Y, Wong J, Moreno GT, et al. NURD, a novel complex with both ATP-dependent chromatin-remodeling and histone deacetylase activities. Mol Cell. 1998;2(6):851–861.
- Hassig CA, Fleischer TC, Billin AN, et al. Histone deacetylase activity is required for full transcriptional repression by mSin3A. Cell. 1997;89(3):341–347.
- You A, Tong JK, Grozinger CM, et al. CoREST is an integral component of the CoREST-human histone deacetylase complex. Proc Natl Acad Sci U S A. 2001;98(4):1454–1458.
- Ma P, Schultz RM. HDAC1 and HDAC2 in mouse oocytes and preimplantation embryos: specificity versus compensation. Cell Death Differ. 2016;23(7):1119–1127.
- Sheikh BN, Akhtar A. The many lives of KATs – detectors, integrators and modulators of the cellular environment. Nat Rev Genet. 2019;20(1):7–23.
- Robinson PJ, An W, Routh A, et al. 30 nm chromatin fibre decompaction requires both H4-K16 acetylation and linker histone eviction. J Mol Biol. 2008;381(4):816–825.
- Kidder BL, Palmer S. HDAC1 regulates pluripotency and lineage specific transcriptional networks in embryonic and trophoblast stem cells. Nucleic Acids Res. 2012;40(7):2925–2939.
- Wang Z, Zang C, Cui K, et al. Genome-wide mapping of HATs and HDACs reveals distinct functions in active and inactive genes. Cell. 2009;138(5):1019–1031.
- Yamaguchi T, Cubizolles F, Zhang Y, et al. Histone deacetylases 1 and 2 act in concert to promote the G1-to-S progression. Gene Dev. 2010;24(5):455–469.
- LeBoeuf M, Terrell A, Trivedi S, et al. Hdac1 and Hdac2 Act redundantly to control p63 and p53 functions in epidermal progenitor cells. Dev Cell. 2010;19(6):807–818.
- Ma PP, Pan H, Montgomery RL, et al. Compensatory functions of histone deacetylase 1 (HDAC1) and HDAC2 regulate transcription and apoptosis during mouse oocyte development. Proc Natl Acad Sci U S A. 2012;109(8):E481–E489.
- Montgomery RL, Davis CA, Potthoff MJ, et al. Histone deacetylases 1 and 2 redundantly regulate cardiac morphogenesis, growth, and contractility. Gene Dev. 2007;21(14):1790–1802.
- Guan JS, Haggarty SJ, Giacometti E, et al. HDAC2 negatively regulates memory formation and synaptic plasticity. Nature. 2009;459(7243):55–U58.
- Lagger G, O’Carroll D, Rembold M, et al. Essential function of histone deacetylase 1 in proliferation control and CDK inhibitor repression. Embo J. 2002;21(11):2672–2681.
- Ma PP, Schultz RM. Histone deacetylase 1 (HDAC1) regulates histone acetylation, development, and gene expression in preimplantation mouse embryos. Dev Biol. 2008;319(1):110–120.
- Ito A, Kawaguchi Y, Lai C-H, et al. MDM2-HDAC1-mediated deacetylation of p53 is required for its degradation. Embo J. 2002;21(22):6236–6245.
- Cao ZB, Carey TS, Ganguly A, et al. Transcription factor AP-2 gamma induces early Cdx2 expression and represses HIPPO signaling to specify the trophectoderm lineage. Development. 2015;142(9):1606–1615.
- Tatsuta T, Mukaisho K-I, Sugihara H, et al. Expression of Cdx2 in early GRCL of Barrett’s esophagus induced in rats by duodenal reflux. Digest Dis Sci. 2005;50(3):425–431.
- Suzuki S, Nozawa Y, Tsukamoto S, et al. CHD1 acts via the Hmgpi pathway to regulate mouse early embryogenesis. Development. 2015;142(13):2375–2384.
- Zhao J, Ohsumi TK, Kung JT, et al. Genome-wide identification of polycomb-associated RNAs by RIP-seq. Mol Cell. 2010;40(6):939–953.
- Wang JL, Rao S, Chu J, et al. A protein interaction network for pluripotency of embryonic stem cells. Nature. 2006;444(7117):364–368.
- Pengpeng MA, Schultz RM. Histone deacetylase 1 (HDAC1) regulates histone acetylation, development, and gene expression in preimplantation mouse embryos. Dev Biol. 2008;319(2):485–486.
- Xue ZG, Huang K, Cai C, et al. Genetic programs in human and mouse early embryos revealed by single-cell RNA sequencing. Nature. 2013;500(7464):593.
- Furumai R, Matsuyama A, Kobashi N, et al. FK228 (depsipeptide) as a natural prodrug that inhibits class I histone deacetylases. Cancer Res. 2002;62(17):4916–4921.
- Zhang K, Dai XP, Wallingford MC, et al. Depletion of Suds3 reveals an essential role in early lineage specification. Dev Biol. 2013;373(2):359–372.
- Zenker J, White MD, Templin RM, et al. A microtubule-organizing center directing intracellular transport in the early mouse embryo. Science. 2017;357(6354):925.
- Rossant J. Genetic control of early cell lineages in the mammalian embryo. Annu Rev Genet. 2018;52:185–201.
- Nishioka N, Inoue K-I, Adachi K, et al. The hippo signaling pathway components lats and yap pattern Tead4 activity to distinguish mouse trophectoderm from inner cell mass. Dev Cell. 2009;16(3):398–410.
- Robertson KD, Ait-Si-Ali S, Yokochi T, et al. DNMT1 forms a complex with Rb, E2F1 and HDAC1 and represses transcription from E2F-responsive promoters. Nat Genet. 2000;25(3):338–342.
- Rountree MR, Bachman KE, Baylin SB. DNMT1 binds HDAC2 and a new co-repressor, DMAP1, to form a complex at replication foci. Nat Genet. 2000;25(3):269–277.
- Fuks F, Burgers WA, Godin N, et al. Dnmt3a binds deacetylases and is recruited by a sequence-specific repressor to silence transcription. Embo J. 2001;20(10):2536–2544.
- Ma P, de Waal E, Weaver JR, et al. A DNMT3A2-HDAC2 complex is essential for genomic imprinting and genome integrity in mouse oocytes. Cell Rep. 2015;13(8):1552–1560.
- Bostick M, Kim JK, Estève P-O, et al. UHRF1 plays a role in maintaining DNA methylation in mammalian cells. Science. 2007;317(5845):1760–1764.
- Yang WM, Inouye C, Zeng YY, et al. Transcriptional repression by YY1 is mediated by interaction with a mammalian homolog of the yeast global regulator RPD3. Proc Natl Acad Sci U S A. 1996;93(23):12845–12850.
- Magnaghi-Jaulin L, Groisman R, Naguibneva I, et al. Retinoblastoma protein represses transcription by recruiting a histone deacetylase. Nature. 1998;391(6667):601–605.
- Juan LJ, Shia WJ, Chen MH, et al. Histone deacetylases specifically down-regulate p53-dependent gene activation. J Biol Chem. 2000;275(27):20436–20443.
- Narita T, Weinert BT, Choudhary C. Functions and mechanisms of non-histone protein acetylation. Nat Rev Mol Cell Bio. 2019;20(3):156–174.
- Kruiswijk F, Labuschagne CF, Vousden KH. p53 in survival, death and metabolic health: a lifeguard with a licence to kill. Nat Rev Mol Cell Bio. 2015;16(7):393–405.
- Jamaladdin S, Kelly RDW, O’Regan L, et al. Histone deacetylase (HDAC) 1 and 2 are essential for accurate cell division and the pluripotency of embryonic stem cells. Proc Natl Acad Sci U S A. 2014;111(27):9840–9845.
- Wilting RH, Yanover E, Heideman MR, et al. Overlapping functions of Hdac1 and Hdac2 in cell cycle regulation and haematopoiesis. Embo J. 2010;29(15):2586–2597.
- Hainer SJ, Boskovic A, McCannell KN, et al. Profiling of pluripotency factors in single cells and early embryos. Cell. 2019;177(5):1319-1329.
- Yagi R, Kohn MJ, Karavanova I, et al. Transcription factor TEAD4 specifies the trophectoderm lineage at the beginning of mammalian development. Development. 2007;134(21):3827–3836.