
ABSTRACT
In early embryos, DNA methylation is remodelled to initiate the developmental program but for mostly unknown reasons, methylation marks are acquired unequally between embryonic and placental cells. To better understand this, we generated high-resolution DNA methylation maps of mouse mid-gestation (E10.5) embryo and placenta. We uncovered specific subtypes of differentially methylated regions (DMRs) that contribute directly to the developmental asymmetry existing between mid-gestation embryonic and placental DNA methylation patterns. We show that the asymmetry occurs rapidly during the acquisition of marks in the post-implanted conceptus (E3.5-E6.5), and that these patterns are long-lasting across subtypes of DMRs throughout prenatal development and in somatic tissues. We reveal that at the peri–implantation stages, the de novo methyltransferase activity of DNMT3B is the main driver of methylation marks on asymmetric DMRs, and that DNMT3B can largely compensate for lack of DNMT3A in the epiblast and extraembryonic ectoderm, whereas DNMT3A can only partially compensate in the absence of DNMT3B. However, as development progresses and as DNMT3A becomes the principal de novo methyltransferase, the compensatory DNA methylation mechanism of DNMT3B on DMRs becomes less effective.
Introduction
Throughout the eutherian mammalian gestation, the placenta plays an essential role in mediating maternal–embryonic exchanges of gas, nutrients and waste, and also provides the developing embryo with a protective layer against adverse environmental exposures and the maternal immune system [Citation1]. These unique placental functions are orchestrated by several distinct trophoblast cell subtypes organized in separate layers [Citation2]. The initial steps of lineage specialization of both placental and embryonic cells occur promptly following fertilization during the first few embryonic cleavages as DNA methylation marks are being reprogrammed [Citation3].
DNA methylation is an epigenetic mechanism that is critical in the determination of lineage-specific differentiation and development, and is mainly recognized for its involvement in processes such as transcriptional repression, genomic imprinting and X–inactivation [Citation4]. DNA methylation marks are mediated by the action of DNA methyltransferases (DNMTs). Establishment of new or de novo DNA methylation patterns required for cell lineage determination during development is mediated by DNMT3A and DNMT3B, with cofactor DNMT3L [Citation5,Citation6], whereas DNMT1 maintains heritable DNA methylation patterns during cellular divisions [Citation7,Citation8]. These enzymes are critical, as deletion of Dnmt3b or Dnmt1 is embryonic lethal, while Dnmt3a-deficient offspring die shortly after birth [Citation6,Citation9]. During gametogenesis, the acquisition of genome-wide and allele-specific methylation patterns (i.e. genomic imprinting) in both oocytes and sperm is essentially due to the activity of DNMT3A [Citation10,Citation11]. Following fertilization, a reprogramming wave removes most methylation signatures across the genome, except for imprinted regions, some types of repeat sequences, as well as imprinted-like sequences, to trigger the developmental program [Citation12–Citation14]. Then, during the peri–implantation process, DNA methylation profiles are re-acquired in a sex-, cell- and tissue-specific manner across most parts of the genome by the combined action of DNMT3A and DNMT3B. In the early stages of the de novo methylation wave (E4.5-E7.5), the expression of Dnmt3b is more robust than Dnmt3a in the epiblast and embryonic-derived cells [Citation15–Citation17], with the relative expression of Dnmt3b and Dnmt3a being considerably reduced in the extraembryonic ectoderm (ExE) and trophoblast lineages [Citation16,Citation18]. This discrepancy in Dnmt3a and Dnmt3b expression levels coincides with the initiation of divergent DNA methylation acquisition between the trophoblast and the inner cell mass of the blastocyst [Citation19–Citation25], a difference that becomes extremely apparent by E6.5, as the epiblast has acquired most of its global DNA methylation compared to the lower-methylation state of the ExE [Citation15,Citation16,Citation26]. This divergence is a common feature across the mammalian placenta, as a heterogeneous and lower-methylation state compared to somatic tissues and other cell types are constantly observed [Citation16,Citation27–Citation30].
Although the functional role of reduced methylation levels observed across the placental genome is still not fully understood, studies suggest that it may activate transposable elements that are typically silenced in other tissues [Citation31]. DNA methylation plays an important role in suppressing retrotransposons in mammalian cells, for which the activity has been associated with genomic instability and disease development [Citation32,Citation33]. Following the de novo methylation wave, in embryonic-derived cells from the inner cell mass, transposable elements acquire higher levels of DNA methylation causing transcriptional silencing, whereas in the trophectoderm-derived cells that will form the placenta, these transposable elements are maintained in a relaxed methylation state and preferentially expressed [Citation34–Citation36]. The low-methylation levels on these elements contributed to the evolution and diversification of the placenta function through the regulation of gene expression by providing placenta-specific enhancers, cryptic promoters, and other cis-regulatory elements [Citation37–Citation42].
Despite the evident distinction between embryonic and placental DNA methylation levels, it remains unclear how, when and where methylation levels are acquired unequally across these genomes. To better understand the developmental dynamics of epigenetic asymmetry that exists between embryo and placenta, we first generated high-resolution maps of DNA methylation marks using Reduced Representation Bisulfite Sequencing (RRBS) at mid-gestation, when the mouse placenta is first considered mature (E10.5), to identify embryo-placenta differentially methylated regions (DMRs). Then, using publicly available DNA methylation data sets and computational analyses, we defined how various categories of DMRs are established in the early stages and maintained throughout development. In addition, we outlined the contribution of Dnmt3a and Dnmt3b in the acquisition and maintenance of embryonic and extraembryonic-specific DMR patterns.
Methods
Animals and sample collection
Female C57BL/6N (8–10 week-old) were purchased from Harlan Sprague-Dawley Laboratories (Indianapolis, IN) and were mated with male C57BL/6N (4 months of age). Following natural mating, embryos and placental tissues were collected at E10.5 (presence of vaginal plug at E0.5). Maternal decidua was removed from placentas. Samples were frozen immediately in liquid nitrogen and stored at −80°C until analysed.
DNA methylation analyses
RRBS libraries were generated as published protocols [Citation43,Citation44] with our specifications [Citation14,Citation45,Citation46]. Five hundred ng of extracted DNA (Qiagen) from the placenta (male n = 2, female n = 2) and embryo (male n = 2, female n = 2) samples were MspI digested, adaptor ligated and PCR amplified (multiplex). Multiplexed samples were pooled and 100 bp paired-end sequenced (HiSeq-2000, Illumina). The data analyses were done according to the pipeline established at the McGill Epigenomics Mapping and Data Coordinating Centres [Citation14,Citation46] that include BSMAP and methylKit. Specific parameters were chosen including 100 bp step-wise tiling windows, containing a minimum of 2 CpGs per tile and a minimum 15× CpG coverage of each tile per sample. The methylation level of a 100 bp tile was the result of all CpG C/T read counts within the tile after coverage normalization between samples, and the methylation level reported for a sample on autosomal chromosomes was the average methylation level across all individual replicates. Significant DNA methylation changes were designated as ±≥20% average differences between groups of replicates and a q-value <0.01 using the logistic regression function of methylKit [Citation47]. Direct comparisons between DNA methylation averages were done using Wilcoxon-Mann-Whitney test in R. Gene ontology (GO) terms and pathway analyses for RefSeqs associated to promoter-TSS were conducted using Metascape gene annotation and analysis resource [Citation48].
Sequencing data
Publicly available DNA methylation datasets [Citation15,Citation16,Citation25,Citation28,Citation49,Citation50] (see Table S5 for description) were analysed using a custom script to intersect single CpG site methylation calls from these datasets within defined 100 bp tiles associated to the embryo-placenta DMR categories and calculated resulting DNA methylation average per tile.
Results
Increased fluctuation in genome-wide DNA methylation levels in placental cells
To identify the overall epigenetic asymmetry that exists between placental and embryonic genomes during mouse in utero development, we first established genome-wide DNA methylation profiles using RRBS [Citation14,Citation45,Citation46] of embryos and their corresponding placentas at mid-gestation (E10.5), the developmental stage at which the mouse placenta is considered mature [Citation51]. Using this approach, we quantified the DNA methylation profiles of ~1.8 million CpG sites in each sample (embryo n = 4, placenta n = 4). We found that the accumulation of CpG methylation was very distinct between the placenta and the embryo. In the placenta, we detected a greater proportion of CpGs in the 0–50% methylation range and a lower proportion of CpGs in the 80–100% methylation range ()). Although we observed that a large proportion of CpGs within the examined regions had no methylation marks in both the embryo and the placenta, interestingly, most CpGs with partial methylation (20–50%) in placenta showed high methylation levels (>80%) in embryos ()). The divergence in global DNA methylation profiles conferred a high degree of clustering between both tissue types (Figure S1). These results are consistent with previous studies indicating lower levels of overall DNA methylation in extraembryonic tissues [Citation16,Citation29,Citation35], reviewed in [Citation52].
Figure 1. Distinctive patterns of genome-wide DNA methylation accumulation between E10.5 embryo and placenta. Analyses of genome-wide DNA methylation sequencing results for the embryo (n = 4) and placenta (n = 4). (a) Density histograms showing the distribution of CpG methylation levels for embryo (purple) and placenta (green). (b) Pairwise comparison of CpG methylation between embryo and placenta. Density increases from blue to red. (c) CpG fraction of 100 bp tiles within 0–20%, 20–40%, 40–60%, 60–80% and 80–100% ranges in embryo and placenta. Shown above bars, is the average CpG methylation for each unique tile represented in graph. (d) DNA methylation means surrounding the transcription start site (TSS) for All-tiles in each experimental group. (e) Circle plot showing methylation average of embryo (purple) and placenta (green) across a portion of chromosome 7.
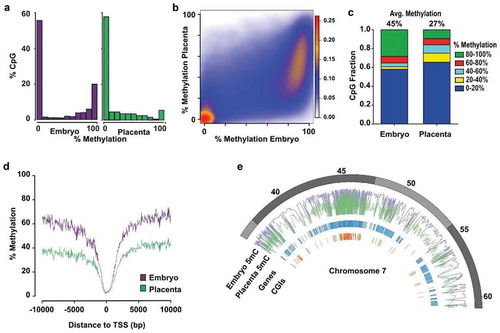
To further investigate the dynamics of DNA methylation between placental and embryonic genomes and enable direct comparison of precise regions, we segmented the genome of autosomal chromosomes into 100 bp non-overlapping genomic windows (tiles; see methods section). After removal of sex chromosomes, we identified 245 048 unique sequenced tiles (referred to as All-tiles) containing 896 820 common CpGs between all placenta and embryo samples and with a minimum of 15x sequencing depth. We observed a strong reduction in the fraction of highly methylated tiles (80–100%) in the placenta compared to the embryo ()), which correlated with a sharp increase in the number of placenta tiles in the 0–20%, 20–40% and 40–60% methylation range. Globally, we found that the average DNA methylation level across all placental tiles was significantly lower compared to all embryo tiles (27% vs 45%, p < 0.0001) ()). This overall epigenetic disparity in embryo and placenta DNA methylation levels was especially noticeable when we mapped the methylation mean of All-tiles with respect to regions surrounding the transcription start sites (TSS) ()). When we focused on a specific chromosome section (e.g. Chr 7, 35Mb) ()), we observed that genomic segments with high DNA methylation levels in embryos had predominantly lower levels in placenta. We also observed that gene or CpG island (CGI) poor regions had consistently high methylation levels in embryos and lower methylation levels in the placenta. Together, these results indicate that the mid-gestation placenta has very distinctive global DNA methylation levels compared to the embryo, and that this lower level of global DNA methylation across the placental genome is due to a significant lower number of highly methylated (≥80%) genomic regions. We can also conclude that despite the cellular heterogeneity in E10.5 placental and embryonic tissues, the vast majority of the conceptus possesses specific genomic regions with either low (0–20%) or high (80–100%) levels of methylation. However, the placenta genome presents an increased number of regions having a broader distribution of DNA methylation (20–80%), revealing a greater diversity in methylation levels across placental cell types compared to embryonic cell types.
Embryonic and placental DNA methylation divergences across genomic features
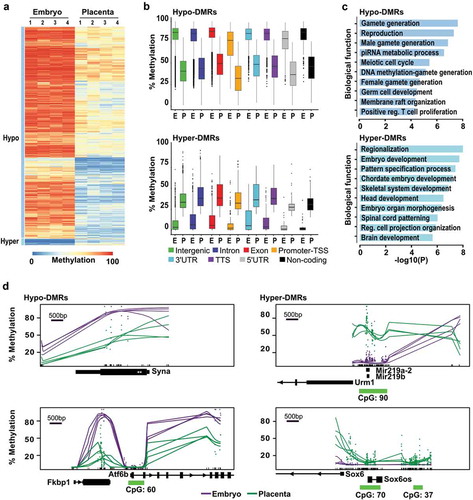
To explain the developmentally divergent methylated states between the mouse embryo and the placenta, we next sought to precisely determine the genomic features revealing DNA methylation differences. We defined differentially methylated regions (DMRs) as 100 bp genomic segments showing a significant difference of methylation levels between embryonic and placental samples with an absolute mean methylation difference of 20% or higher [Citation14,Citation53,Citation54]. Using these conditions, we screened the 245 048 unique tiles common between all samples and identified 110 240 DMRs (~45% of All-tiles; Supplementary Table 1) with tissue- and/or developmental-specific DNA methylation variations between the embryo and the placenta (; random subset of 20 000 DMRs shown). Consistent with our findings (), the majority (96.8%; n = 106 712) of DMRs had lower DNA methylation in the placenta (referred to as Hypo-DMRs) and only a small proportion (3.2%; n = 3 528) showed increased methylation levels (referred to as Hyper-DMRs) compared to the embryo (Figure S2). For Hypo-DMRs, tiles mainly overlapped (96%; n = 102 982) with intergenic, intron, exon, and promoter-TSS regions (Figure S2). For each of the genomic feature categories of Hypo-DMRs, the average DNA methylation levels in the placenta were essentially half of those present in the embryo ()). As for DMRs with higher methylation levels in the placenta (Hyper-DMRs), we noticed that the vast majority of these tiles (83%; n = 2 929) had low methylation levels in the embryo (<20%) (,). Most of Hyper-DMRs overlapped intergenic, intron, exon, and promoter-TSS regions (93%; n = 3 272, Figure S2). Illustrative examples of DNA methylation differences between the placenta and embryo are shown in ). Syna (Syncytin A), implicated in the formation of a syncytium during placenta morphogenesis [Citation41], showed overall lower methylation levels in the placenta when compared to the embryo (), smoothed representation [Citation55]). Similar observations were made in the gene body of Atf6b (Activating Transcription Factor 6 Beta), a gene implicated in the transcriptional downregulation of Pgf (Placental Growth Factor) in response to endoplasmic reticulum stress in pathological placentas [Citation56]. As for Mir219a-2 and Mir219b, brain-specific non-coding microRNAs, they showed higher methylation in the placenta ()). Another example of placenta Hyper-DMRs is Sox6 (SRY-Box 6), which is implicated in the terminal differentiation of muscle ()) [Citation57]. Gene ontology enrichment analyses showed that promoter-associated Hypo-DMRs (n = 1 152 unique promoters) were strongly associated to germline functions and reproduction (e.g. male and female gamete generation, reproduction, piRNA metabolic process, meiotic cell cycle, germ cell development) ()). As for promoter-associated Hyper-DMRs (n = 182 unique promoters), top biological processes were mostly associated with developmental and differentiation processes (e.g. regionalization, embryo development, pattern specification process, skeletal system, head development) ()). Fittingly, the biological functions were completely divergent between Hypo- and Hyper-DMRs. Altogether, these results denote that Hypo- and Hyper-DMRs are present across genomic features between mid-gestation embryo and placenta, and that these DNA methylation divergences are implicated in promoting/repressing specific processes during embryonic and placental development.
Figure 2. Genome-wide methylation asymmetry across genomic features between E10.5 embryo and placenta. Analyses of genome-wide DNA methylation sequencing results for the embryo (n = 4) and placenta (n = 4) samples. (a) Heatmap representation of DNA methylation levels for the 20 000 tiles with the most variable levels between embryo and placenta (DNA methylation variance >20% and p <0.05). (b) Box-plots representing DNA methylation distribution in embryo and placenta for the different genomic annotation regions (intergenic, intron, exon, promoter-TSS, 3'UTR, TTS, 5'UTR, and non-coding). (c) Summary of biological functions associated with promoter regions in Hypo- and Hyper-DMRs (n = 1 152 and n = 182 unique promoters, respectively). (d) Examples of smoothed methylation profiles (BSmooth tool) in regions with lower methylation profiles (Syna and Atf6b) or higher methylation profiles (Mir219a-2/Mir219b, and Sox6) in the placenta. Green dashes represent the position of CpG islands.
Presence of distinctive DMR categories between mid-gestation embryo and placenta
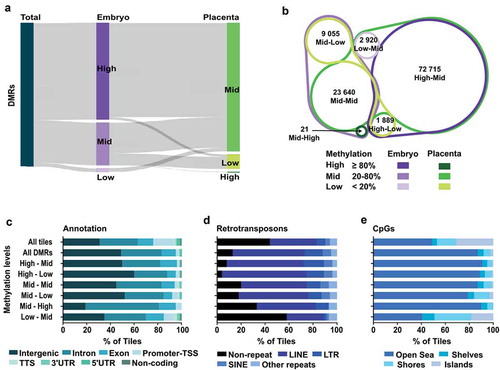
Amongst DMRs, our analyses also suggest the presence of particular DMR categories based on their level of DNA methylation in the embryo and placenta ()). By defining subsets of DMRs and establishing their dynamic properties between tissues, we might better understand the genome-wide asymmetry in DNA methylation levels observed between the embryo and the placenta. To do so, we first clustered DMR-associated tiles in 6 different categories based on their range of low, mid and high methylation level (Low; <20%, Mid; ≥20 to <80%, High; ≥80%) in the embryo and the placenta, and followed the DMR category transitions between both tissues. We observed that DMRs with High-levels of methylation in the embryo overlapped with a large proportion of DMRs that showed Mid-levels of methylation in the placenta (); High-Mid n = 72 715), whereas only a fraction corresponded to DMRs with Low-levels of methylation in the placenta (); High-Low n = 1 889). As for DMRs with Mid-levels of methylation in embryo, the largest part remained in that same Mid-levels category in the placenta (); Mid-Mid n = 23 640). Nonetheless, a portion of these embryonic Mid-levels DMRs were directed to DMRs with either Low- (); Mid-Low n = 9 055) or High- (); Mid-High n = 21) levels of methylation in the placenta. Finally, DMRs with Low-levels of methylation in the embryo all showed Mid-levels of methylation in the placenta (); Low-Mid n = 2 920). Thus, when we subdivide our DMRs into distinctive categories, we uncover that embryonic cells possess a large proportion of DMRs of High-level (≥80%) of DNA methylation, which remains potentially static in embryonic tissues, whereas the vast majority of these DMRs have lower and wide-range DNA methylation levels within placental tissue.
Figure 3. Distinct genomic features in DMRs based on their methylation status in E10.5 embryo and placenta. DMR analysis by methylation levels in embryo and placenta. (a) Sankey diagram dividing DMRs by methylation levels in embryo (purple) and placenta (green) for the associated tiles. High: ≥80% methylation, Mid (intermediate): ≥20% – <80% methylation, Low: <20% methylation. (b) Venn diagram showing the proportion of tiles in the different DMR categories based on DNA methylation levels between embryo and placenta. (c–e) Analysis of All-tiles, all the DMRs, as well as the six different DMR categories based on levels of DNA methylation in embryo and placenta for: (c) Genomic annotations, (d) Main retrotransposons and (e) Proximity of CpG rich regions. Neighbouring CpG dense regions were defined as shore; up to 2kb away from CGIs, shelf; 2–4kb away from CGIs, and open sea; >4kb away from CGIs.
Specific genomic features associated with DMR categories
We next aimed to determine if the genomic distribution of embryo-placenta DMR categories was associated with distinct genomic features. First, by classifying by genomic annotations, we observed that DMRs with reduced methylation levels in the placenta (High-Mid, High-Low, Mid-Low) were prevailingly found in intergenic regions (>50% of tiles) ()), whereas DMR categories with equivalent (Mid-Mid) or greater methylation level (Mid-High, Low-Mid) in the placenta were more frequent in genic associated regions (>50% of tiles). However, the divergence between DMR categories was observed when we performed ontology analyses on promoter regions (Figure S3), as each DMR subtype clearly showed distinct biological functions. Since we know that in placenta, activation of retrotransposon-derived genes is interrelated with low DNA methylation levels [Citation37,Citation40,Citation58], we next assessed how DMR categories overlapped with major types of retrotransposons (LINE; long interspersed nuclear elements, SINE; short interspersed nuclear element, and LTR; long terminal repeats). Out of the DMR categories, those with High-levels of methylation in the embryo and either Mid- or Low-levels in the placenta (High-Mid and High-Low) showed the most enriched overlap with retrotransposons, with 92% and 96%, respectively ()). DMR categories associated with a higher level of methylation in the placenta (Mid-High and Low-Mid) showed the least overlap with retrotransposons, especially the Low-Mid subtype. This highlights that during the de novo acquisition of DNA methylation patterns, DMRs with High-levels of methylation in the embryo and lower levels in the placenta are almost exclusively within retrotransposons-associated sequences, whereas DMRs with Low-levels of methylation in the embryo and higher DNA methylation in the placenta are preferentially outside retrotransposons-associated sequences. Finally, we investigated the proximity of the DMR categories in regards to CpG rich (CpG islands; CGI), neighbouring (shore; <2kb away from CGIs, shelf; 2–4kb away from CGIs) and distant (open sea; >4kb away from CGIs) regions ()). We observed that most DMR categories are depleted from CGIs and are mostly found in open sea regions. In contrast, ~60% of tiles in Low-Mid DMRs overlapped with CGI, shores and shelves, revealing that the acquisition of de novo methylation for these genomic fragments in the extraembryonic lineage preferentially targets sequences inside or surrounding CGIs.
Altogether, these results indicate that the asymmetry within DMR categories, based on their methylation levels in the embryo and the placenta, can be associated to specific biological functions and genomic-derived features (e.g. CpG, retrotransposon contents). This is particularly apparent for DMRs with High-levels in the embryo (High-Mid, High-Low) and those with higher methylation levels in the placenta (Low-Mid).
DMR categories are established during the de novo methylation wave and maintained throughout development
To gain insights into the kinetics of lineage-specific DMR establishment between mid-gestation embryo and placenta, as well as their status during development, we assessed the levels of methylation associated with tiles for each DMR category as a function of their developmental stage. Publicly available sequencing data [Citation25,Citation50] were analysed using our custom script to generate 100bp tiles, and the DNA methylation levels for each tile were calculated. In E3.5 blastocysts, when the mouse genome is mostly depleted from DNA methylation marks, we observed low global DNA methylation levels (average <20%) for all DMR subtypes, with similar median levels between the committed cells of the inner cell mass (ICM) and trophectoderm lineages (). DNA methylation levels tended to be higher in the trophectoderm for regions falling in the Mid-High DMRs, although measurements are based on very few DMRs for this specific category (n = 21, ), Mid-High). Since global DNA methylation is re-acquired in the next few subsequent developmental stages, we then asked whether the contrast in DNA methylation levels associated with the various DMR categories at mid-gestation would already be present between E6.5 epiblast and extraembryonic ectoderm (ExE) cell lineages, layers that are mostly composed of homogeneous and undifferentiated cell populations. For all DMR categories, DNA methylation levels in the E6.5 epiblast and ExE already showed similar pattern trends to those observed in the E10.5 embryo and placenta (, Table S2). Interestingly, for all DMR categories, we observed higher DNA methylation levels in E6.5 ExE compared to E10.5 placenta (, Table S2; Mid-High DMRs: p = 0.0021, other DMRs: p < 0.0001). Although we observe a ~ 10% higher DNA methylation mean difference for all common tiles between E6.5 ExE and E10.5 Placenta (35.66% vs 25.79%, p < 0.0001; n = 188 098) (Fig S5A), there is less than 1% difference in DNA methylation levels between all common tiles (n = 200 581) from the E6.5 Epi and E10.5 embryo (43.2% vs 43.65%; p < 0.0001). Furthermore, ~24% of tiles have ≥20% methylation in the E6.5 ExE vs the E10.5 Placenta (70.22% vs 37.49%; p < 0.0001; n = 45 967), whereas ~5.5% of tiles have ≥20% methylation in the E6.5 epiblast vs the E10.5 embryo (77.80% vs 43.87%; p < 0.0001; n = 11 183) (Fig S5B). In the subsequent developmental stages (E10.5, E11.5, E15, and E18) DNA methylation profiles associated with each DMR category stabilized and persisted in the placental cells. For categories of DMRs, their individual profiles in the E6.5 epiblast closely matched those observed in the E10.5 embryo and persisted across time points (E6.5, E10.5, E11.5). Although no public DNA methylation data were available for whole embryos at later stages, when we overlapped tiles associated with E10.5 DMR categories with data from differentiated tissues of adult mice, the global DNA methylation profiles closely matched those for the majority of DMR categories (High-Mid, High-Low, Mid-Mid and Mid-Low) (, Figure S4). We conclude that the various DMR categories observed at E10.5 are established during the embryonic and extraembryonic lineage-specification processes occurring during the peri–implantation wave of de novo methylation, and that these DNA methylation landscapes are widely retained throughout embryo and placenta development. Furthermore, for most DMR categories, the DNA methylation levels observed in developing embryos are long-lasting and conserved throughout somatic cell differentiation.
Figure 4. Dynamics of DNA methylation profiles associated with DMR categories and their evolution across embryo and placenta development. Box plots representing the DNA methylation distribution and median values for each DMR category in various developmental stages. Tiles associated with DMR categories at E10.5 were overlapped with previously published and publicly available data, and methylation levels were determined at each developmental stage [Citation25,Citation28,Citation50] or in adult somatic tissues [Citation49]. ICM: inner cell mass, TE: trophectoderm, Epi: epiblast, ExE: extraembryonic ectoderm, E: Embryo, Pla: placenta. See Table S2 for median and mean methylation values, and Table S4 for a number of overlapping tiles analysed.
![Figure 4. Dynamics of DNA methylation profiles associated with DMR categories and their evolution across embryo and placenta development. Box plots representing the DNA methylation distribution and median values for each DMR category in various developmental stages. Tiles associated with DMR categories at E10.5 were overlapped with previously published and publicly available data, and methylation levels were determined at each developmental stage [Citation25,Citation28,Citation50] or in adult somatic tissues [Citation49]. ICM: inner cell mass, TE: trophectoderm, Epi: epiblast, ExE: extraembryonic ectoderm, E: Embryo, Pla: placenta. See Table S2 for median and mean methylation values, and Table S4 for a number of overlapping tiles analysed.](/cms/asset/be8cb266-59cc-4f6e-bf25-4b3fb4362ba6/kepi_a_1722922_f0004_oc.jpg)
Dnmt3a- or dnmt3b-deficiency alters proper establishment of dmr-associated patterns
Since the combined activity of DNMT3A and DNMT3B is essential for the proper establishment of DNA methylation profiles and normal development, we next sought to define the contribution of each enzyme in the de novo establishment of DNA methylation in subtypes of DMRs in embryonic and extraembryonic cell lineages. To do so, we used DNA methylation data from publicly available datasets (whole-genome bisulfite sequencing and RRBS) at E6.5 (epiblast and ExE) [Citation16] and E8.5 (embryo) [Citation15] with inactive forms of Dnmt3a and Dnmt3b. First, when we overlapped our All-tiles subset, we observed a substantial reduction p < 0.0001 in average DNA methylation in absence of DNMT3A (37.81%) or DNMT3B (31.48%) in the E6.5 epiblast compared to wild-type (44.81%), whereas in the E6.5 ExE such a comparable loss was only associated with a Dnmt3b-deficiency (wt: 34.38% vs Dnmt3b-/-: 19.33%, p < 0.0001) (Figure S6). Similarly, in the E8.5 embryo, a significant reduction in average DNA methylation level was measured with lack of Dnmt3a or Dnmt3b expression compared to wild-type (wt: 47.5%; Dnmt3a-/-: 43.6%; Dnmt3b-/-: 34%, p < 0.0001) (Figure S6). For most DMR subtypes, absence of DNMT3A caused modest, although significant (p < 0.0001), or no reduction on overall DNA methylation levels in E6.5 epiblast and ExE (), Table S3). In comparison, Dnmt3b-depletion led to a substantial and significant loss of average methylation levels in all DMR categories in the E6.5 epiblast and ExE (Mid-High DMRs: p < 0.05, other DMRs: p < 0.0001) (), Table S3). In most DMR categories (High-Mid, Mid-Mid, Mid-Low, Low-Mid), the loss of Dnmt3b yielded a larger DNA methylation mean difference in the ExE compared to the epiblast at E6.5 (Table S3). For example, in the epiblast High-Mid DMRs, a compensatory mechanism provided high levels of methylation (wt: 84.13% vs Dnmt3b-/-: 71.6%; p < 0.0001), whereas this compensatory mechanism was ineffective in the E6.5 ExE (wt: 60.7% vs Dnmt3b-/-: 36.28%; p < 0.0001). When we focused on promoter-TSS for each DMR categories, we observed again that loss of methylation for these regulatory regions was principally associated with Dnmt3b-deficiency ()). The promoter-TSS regions associated with High-Mid DMRs retained relatively high methylation levels for either Dnmt3a-/- or Dnmt3b-/- epiblast samples, demonstrating a robust and compensatory de novo methylation mechanism. To further underline the impact of DNMT3A or DNMT3B on the de novo methylation of DMRs, we measured methylation levels for DMRs selected from our gene enrichment analyses (Fgb, P2rx7, Pcyt2, Etnppl, Ralgds, Lrp5) and other genomic segments covered by multiple tiles (Cxxc1, Fcgrt, Lamp5, Mbd1, Lphn1, Pick1, Irf1) (Figure S7 & S8) in Dnmt3a- or Dnmt3b-deficient epiblast and ExE. In line with our global observations, for most DMR-associated tiles, a Dnmt3b-deficiency in E6.5 epiblast or ExE caused a more severe loss of methylation compared to lack of Dnmt3a. However, for some regions in the E6.5 epiblast (e.g. Pick1, Irf1), Dnmt3a-/- methylation levels were lower to those of Dnmt3b-/-. Overall, we show that of DNMT3A and DNMT3B participate in the establishment of the asymmetric methylation patterns associated with the various DMR categories in both embryonic and extraembryonic cells, with DNMT3B being the principal contributor in both cell lineages during the de novo reprogramming wave as it can compensate almost entirely for the absence of DNMT3A.
Figure 5. Dnmt3a- or Dnmt3b-deficiency alters proper establishment of DMR-associated patterns. (a) Violin plots representing DNA methylation distribution and median values of tiles associated with the different DMR categories at E10.5, and their methylation levels in overlapping tiles of different tissues and genotypes at E6.5 [Citation16] and E8.5 [Citation15]. (b) Density plots describing the mean methylation profiles of promoter-TSS associated tiles in each DMR category for E10.5 embryo and E6.5 epiblast (wt, Dnmt3a-/- and Dnmt3b-/-) (left panel) and for E10.5 placenta and E6.5 extraembryonic ectoderm (wt, Dnmt3a-/- and Dnmt3b-/-) (right panel). E: embryo, Epi: epiblast, ExE: extraembryonic ectoderm. See Table S3 for median and mean methylation values, and Table S4 for a number of overlapping tiles analysed.
![Figure 5. Dnmt3a- or Dnmt3b-deficiency alters proper establishment of DMR-associated patterns. (a) Violin plots representing DNA methylation distribution and median values of tiles associated with the different DMR categories at E10.5, and their methylation levels in overlapping tiles of different tissues and genotypes at E6.5 [Citation16] and E8.5 [Citation15]. (b) Density plots describing the mean methylation profiles of promoter-TSS associated tiles in each DMR category for E10.5 embryo and E6.5 epiblast (wt, Dnmt3a-/- and Dnmt3b-/-) (left panel) and for E10.5 placenta and E6.5 extraembryonic ectoderm (wt, Dnmt3a-/- and Dnmt3b-/-) (right panel). E: embryo, Epi: epiblast, ExE: extraembryonic ectoderm. See Table S3 for median and mean methylation values, and Table S4 for a number of overlapping tiles analysed.](/cms/asset/7124ac00-c13a-4fbb-b948-c97d9e696973/kepi_a_1722922_f0005_oc.jpg)
Decline in compensatory DNA methylation mechanisms in response to dnmt3a- or dnmt3b-deficiency
As embryonic development progresses from E6.5 to E8.5, our data suggest that lack of DNMT3A or DNMT3B further impedes the proper establishment and maintenance of DNA methylation levels of specific DMRs, evoking that absence of either enzymatic activity causes an additive and extended effect (,). To further define the robustness in compensatory mechanism between DNMT3A or DNMT3B in the establishment and maintenance of DNA methylation on DMRs categories, we focused on High-Mid promoter-TSS- associated DMRs as they have the highest DNA methylation levels and require the most de novo methyltransferase activity. Methylation differences of ≥20% between wild-type and Dnmt3a- or Dnmt3b-deficient samples were considered as regions showing a substantial lack of compensation. In agreement with our results (,), we observed that at E6.5, DNMT3B can compensate almost entirely for DNMT3A loss by maintaining methylation levels on most promoters-TSS associated tiles in the epiblast (410/437 = 93.8%) and ExE (558/602 = 92.7%), whereas DNMT3A can only partially alleviate the lack of DNMT3B in the epiblast (315/410 = 78.6%) and ExE (244/524 = 46.6%) (,). As embryonic cell lineages development evolves between E6.5 and E8.5, global methylation levels increase on promoter-TSS of High-Mid DMRs. However, at E8.5, we detected a sharp decline in the number of promoter-TSS of High-Mid DMRs showing compensation (i.e. <20% difference) in Dnmt3a- (524/627 = 80.9%) and Dnmt3b- (256/622 = 41.2%) deficient embryos compared to wild-type ()). This is further highlighted when we focus on a subgroup of 314 promoter-TSS associated tiles overlapping all of 9 data sets ()), including gene promoters (e.g. Asz1, Catsper1, Ccdc42, Dmrtb1, Piwil2, Rpl10l, Sox30, Sycp1, Tnp1, Ttll1, Zfn42) related to our top-enriched biological functions (i.e. piRNA, gamete generation and germ cells, meiotic nuclear division). Although E8.5 Dnmt3a- or Dnmt3b-deficient ExE data was not available, our data suggest that greater compensation failure would also be observed in this tissue. Thus, specific High-Mid promoter-TSS- associated DMRs need the combined action of DNMT3A and DNMT3B to both establish and maintain proper asymmetric levels during early development as compensatory DNA methylation mechanisms fail to overcome a DNMT3A or DNMT3B shortage during the E6.5 to E8.5 transition.
Figure 6. Developmental decline in compensatory DNA methylation mechanism in response to Dnmt3a- or Dnmt3b-deficiency at promoter-TSS associated with High-Mid DMRs. (a) Heatmaps comparing the DNA methylation profiles of wt vs Dnmt3a-/- or wt vs Dnmt3b-/- for E6.5 epiblast, E6.5 extraembryonic ectoderm [Citation16] or E8.5 embryo [Citation15] in 100 bp tiles overlapping promoter-associated High-Mid DMRs that are highly methylated in the embryo (≥80%) and mildly methylated in the placenta (≥20 and <80%). Upper panel represents regions with a difference of methylation of at least 20% between wt and Dnmt3a-/- or wt and Dnmt3b-/-. Lower panel represents stable regions (lower than 20% difference in methylation). (b) Pie charts representing promoter-associated High-Mid DMR numbers for each comparison in A). (c) Heatmap of the methylation levels of tiles commonly represented in all 9 public data samples that overlap with promoters-associated High-Mid DMRs (n = 314 tiles) (left panel). Heatmap of the methylation level of genes associated with piRNA, gamete generation and germ cells or meiotic nuclear division that are covered in all nine public datasets (right panel).
![Figure 6. Developmental decline in compensatory DNA methylation mechanism in response to Dnmt3a- or Dnmt3b-deficiency at promoter-TSS associated with High-Mid DMRs. (a) Heatmaps comparing the DNA methylation profiles of wt vs Dnmt3a-/- or wt vs Dnmt3b-/- for E6.5 epiblast, E6.5 extraembryonic ectoderm [Citation16] or E8.5 embryo [Citation15] in 100 bp tiles overlapping promoter-associated High-Mid DMRs that are highly methylated in the embryo (≥80%) and mildly methylated in the placenta (≥20 and <80%). Upper panel represents regions with a difference of methylation of at least 20% between wt and Dnmt3a-/- or wt and Dnmt3b-/-. Lower panel represents stable regions (lower than 20% difference in methylation). (b) Pie charts representing promoter-associated High-Mid DMR numbers for each comparison in A). (c) Heatmap of the methylation levels of tiles commonly represented in all 9 public data samples that overlap with promoters-associated High-Mid DMRs (n = 314 tiles) (left panel). Heatmap of the methylation level of genes associated with piRNA, gamete generation and germ cells or meiotic nuclear division that are covered in all nine public datasets (right panel).](/cms/asset/fb2b110c-e6a2-47d9-ae26-18dfca23ba66/kepi_a_1722922_f0006_oc.jpg)
Discussion
With recent breakthroughs in high-throughput sequencing, we now have a better understanding of the dynamic of DNA methylation erasure occurring in early cleavage stage embryos following fertilization. However, the discrepancies in acquisition of genome-wide DNA methylation patterns in early post-implantation embryonic and extraembryonic cell lineages remain to be methodically delineated. To address this issue and further our understanding of the DNA methylation asymmetry that guides the developmental trajectory of embryonic and extraembryonic cell lineages, we established genome-wide DNA methylation profiles of the mouse embryo and placenta at mid-gestation, and analysed various publicly available developmental stage-specific embryo and placenta DNA methylation datasets. Using this strategy, we uncovered that 45% of the genomic regions analysed differ in DNA methylation status (≥20%) between mid-gestation embryo and placenta, and that these DMRs can be further divided into categories based on their levels of DNA methylation (Low; <20%, Mid; ≥20 to <80%, High; ≥80%) in the embryo and placenta. We show that the embryo and placenta acquire specific DMR categories during the early stage of the de novo DNA methylation wave, and that these DMRs persist throughout prenatal development, as well as into somatic adult tissues. Furthermore, we show that Dnmt3b primarily drives the divergence in DNA methylation levels associated with these specific DMRs and that de novo methyltransferase activity of Dnmt3b can almost entirely compensate for lack of Dnmt3a in the asymmetric establishment of embryonic and placental DMRs, but that Dnmt3a can only partially compensate the absence of Dnmt3b. However, with developmental progression, this compensatory DNA methylation mechanism becomes less effective.
Our results indicate that the kinetics of DNA methylation acquisition leading to specific embryo-placenta DMR categories are not a stepwise process occurring throughout cell fate decisions and patterning of embryonic and extraembryonic lineages, but a prompt progression in the early post-implanted conceptus. These results are in line with studies reflecting that the initiation of asymmetric DNA methylation levels begins within the trophoblast and the inner cell mass of the blastocyst [Citation24], and becomes highly evident by the time the epiblast acquires its initial global DNA methylation patterns at E6.5 during the de novo reprogramming wave [Citation15,Citation16]. Our results show that the acquisition period between E4.5 and E6.5 is particularly key to establishing asymmetric DNA methylation patterns associated with mid-gestation embryo-placenta DMR classes, and that these DMR associated-patterns are long-lasting across stages of prenatal development. Since we studied cell populations derived from embryonic and placental tissues, we cannot dismiss the prevalence of cell-to-cell heterogeneity in the acquisition kinetics of specific DMR patterns. Despite this concern, our results indicate that embryonic cells have a large body of DMRs with High-levels (≥80%) and Low-levels (<20%) of methylation that remain static across development, as well as in somatic cell types (High-Mid & High-Low DMRs), whereas compared to the embryo, the placental DMRs have overall lower methylation levels and are more broadly distributed amongst methylation levels, which has also been shown in other studies where genome-wide DNA methylation profiles of placental cells were compared to other tissues and specific cell types [Citation16,Citation27,Citation29]. Lower methylation levels in the placenta have been associated with reduced de novo methyltransferase activity in the ExE during the de novo reprogramming wave [Citation19,Citation24]. Nevertheless, we observe methylation level peaks for all DMR categories within the ExE at E6.5 before levels stabilize at E10.5. As of now, the implication of these methylation level peaks on future regulation mechanisms and methylation profiles is unknown. Moreover, it remains to be determined whether the global reduction in DNA methylation marks on DMRs between the E6.5 and E10.5 extraembryonic cell lineages is stochastic or targeted, and whether it occurs through passive or active mechanisms. In addition, since analyses combine datasets from divergent mouse strains, we cannot exclude that particular DNA methylation differences could be genetically driven.
We also observed an enrichment of retrotransposons (i.e. LINE, SINE, LTR) in DMRs especially in those with High-levels of methylation in the embryo and lower-levels in the placenta, whereas DMRs with Low-levels of methylation in the embryo and higher levels in the placenta are preferentially outside retrotransposons-associated sequences. Earlier findings of Chapman et al. [Citation59] revealed that repeat regions in the placenta appear to lack tight control of their methylation patterns, perhaps indicating that maintaining methylation, and therefore repression of these elements for genome stability and integrity, is not critical given the relatively short lifespan of this organ. However, we do observe Mid-range methylation levels (20–80%) in the placenta for a substantial portion of DMRs that are associated with retrotransposons, revealing that specific genomic regions associated with repetitive elements do need tight regulation in extraembryonic cell lineages for proper development. These results are in line with findings exposing that the deletion of genome-defence gene Tex19.1 leads to the de-repression of LINE1 and compromises placental development, suggesting that disparities between retrotransposon suppression and genome-defence mechanisms might contribute to placenta dysfunction and disease [Citation60].
DNMT3A and DNMT3B are required to establish proper methylation profiles on the embryonic genome during the de novo reprogramming wave, as both methyltransferase enzymes have redundant, but also specific functions. However, the activity of DNMT3B is the main contributor in the acquisition of profiles in epiblast cells, and especially commands methylation on CGIs associated with developmental genes [Citation15]. Auclair et al. highlighted that in the absence of DNMT3B, DNMT3A was not able to counterbalance, leading to the loss of promoter-CGI methylation and gain of expression of germline genes (e.g. Sycp1, Sycp2, Mael, Rpl10l, Dmrtb1) in somatic cells of the embryo. Here, we show that the promoter of these germline genes, associated with meiotic and piRNA processes as well as other genes with similar biological functions, are highly enriched in High-Mid DMRs. We also show that with the absence Dnmt3b, the methylation loss on most DMR categories is more pronounced in the E6.5 ExE than in the E6.5 Epi, revealing that the compensatory mechanism by DNMTA is less efficient in the ExE. Globally, we show that DNMT3B is much more potent at compensating than DNMT3A in both the epiblast and ExE for all DMR categories, indicating that DNMT3B is the main de novo enzyme driving asymmetric DNA methylation patterns between the embryo and placenta. Although compensatory mechanisms have been observed in Dnmt3a or Dnmt3b-depleted conceptuses, we still do not fully understand the process as Dnmt3a and Dnmt3b have cell lineage-specific expression during the peri–implantation developmental period. As development progresses, we observed that the compensation mechanism in Dnmt3a or Dnmt3b-deficient embryos remains apparent at E8.5 on most DMR categories, but is less effective as the methylation gaps increase compared to wild-type. This correlates with a developmental period where DNMT3A is now the main de novo methyltransferase enzyme in both the embryo and placenta [Citation6,Citation17], and with a compensatory activity of DNMT3A being less effective. This suggests that DNMT3B activity is critical to ensure proper establishment of DNA methylation asymmetry between the embryonic and extraembryonic cell lineages during the de novo reprogramming wave, but that DNMT3A is required during the developmental progression to safeguard methylation levels on DMR categories.
Conclusion
We demonstrate that asymmetry between embryo and placenta DNA methylation patterns occurs rapidly during de novo acquisition of methylation marks in the early post-implanted conceptus, and that these patterns are long-lasting across subtypes of DMRs. We also reveal that at the peri–implantation stages, de novo methyltransferase activity of DNMT3B is the main provider of asymmetric methylation marks on DMRs, and that it largely compensates the lack of DNMT3A in the epiblast and ExE. However, as development progresses, DNMT3A becomes the principal de novo methyltransferase by mid-gestation, and DNMT3B methyltransferase activity is less effective at promoting compensation. These results further underline why embryos developing without DNMT3B have severe DNA methylation defects and die at mid-gestation, whereas those without DNMT3A only die postnatally. Further investigation is required to determine the molecular mechanisms controlling the precise de novo acquisition of long-lasting methylation marks on specific DMR subtypes in the embryonic and extraembryonic cell lineages, and how errors in this process could lead to abnormal development and diseases.
Summary statement
The kinetics of asymmetric DNA methylation acquisition of embryo-placenta differentially methylated regions is not a stepwise process occurring in embryonic and extraembryonic lineages, but a prompt progression in the early post-implanted conceptus.
Supplemental Material
Download Zip (20.9 MB)Acknowledgments
We thank the McGraw lab for critical comments and suggestions, as well as Elizabeth Maurice-Elder for editing.
Disclosure statement
No potential conflict of interest was reported by the authors.
Data availability
The data from this study have been submitted to the Gene Expression Omnibus (#GSE95610). Reviewer link:
https://www.ncbi.nlm.nih.gov/geo/query/acc.cgi?token=ghsnmqoctlgjlcj&acc=GSE95610
Supplementary material
Supplemental data for this article can be accessed here.
Additional information
Funding
References
- Rossant J, Cross JC. Placental development: lessons from mouse mutants. Nat Rev Genet. 2001;2(7):538–548.
- Cross JC. Genetic insights into trophoblast differentiation and placental morphogenesis. Semin Cell Dev Biol. 2000;11(2):105–113.
- Morgan HD, Santos F, Green K, et al. Epigenetic reprogramming in mammals. Hum Mol Genet. 2005;14 Spec(1):R47–R58.
- Bestor TH. The DNA methyltransferases of mammals. Hum Mol Genet. 2000;9(16):2395–2402.
- Li E. Chromatin modification and epigenetic reprogramming in mammalian development. Nat Rev Genet. 2002;3(9):662–673.
- Okano M, Bell DW, Haber DA, et al. DNA methyltransferases Dnmt3a and Dnmt3b are essential for de novo methylation and mammalian development. Cell. 1999;99(3):247–257.
- Lei H, Oh SP, Okano M, et al. De novo DNA cytosine methyltransferase activities in mouse embryonic stem cells. Development. 1996;122(10):3195–3205.
- Leonhardt H, Page AW, Weier HU, et al. A targeting sequence directs DNA methyltransferase to sites of DNA replication in mammalian nuclei. Cell. 1992;71(5):865–873.
- Li E, Bestor TH, Jaenisch R. Targeted mutation of the DNA methyltransferase gene results in embryonic lethality. Cell. 1992;69(6):915–926.
- Kaneda M, Okano M, Hata K, et al. Essential role for de novo DNA methyltransferase Dnmt3a in paternal and maternal imprinting. Nature. 2004;429(6994):900–903.
- Kato Y, Kaneda M, Hata K, et al. Role of the Dnmt3 family in de novo methylation of imprinted and repetitive sequences during male germ cell development in the mouse. Hum Mol Genet. 2007;16(19):2272–2280.
- Hirasawa R, Chiba H, Kaneda M, et al. Maternal and zygotic Dnmt1 are necessary and sufficient for the maintenance of DNA methylation imprints during preimplantation development. Genes Dev. 2008;22(12):1607–1616.
- Howell CY, Bestor TH, Ding F, et al. Genomic imprinting disrupted by a maternal effect mutation in the Dnmt1 gene. Cell. 2001;104(6):829–838.
- McGraw S, Zhang JX, Farag M, et al. Transient DNMT1 suppression reveals hidden heritable marks in the genome. Nucleic Acids Res. 2015;43:1485–1497.
- Auclair G, Guibert S, Bender A, et al. Ontogeny of CpG island methylation and specificity of DNMT3 methyltransferases during embryonic development in the mouse. Genome Biol. 2014;15(12):545.
- Smith ZD, Shi J, Gu H, et al. Epigenetic restriction of extraembryonic lineages mirrors the somatic transition to cancer. Nature. 2017;549(7673):543–547.
- Watanabe D, Suetake I, Tada T, et al. Stage- and cell-specific expression of Dnmt3a and Dnmt3b during embryogenesis. Mech Dev. 2002;118(1–2):187–190.
- Senner CE, Krueger F, Oxley D, et al. DNA methylation profiles define stem cell identity and reveal a tight embryonic-extraembryonic lineage boundary. Stem Cells. 2012;30(12):2732–2745.
- Fulka H, Mrazek M, Tepla O, et al. DNA methylation pattern in human zygotes and developing embryos. Reproduction. 2004;128(6):703–708.
- Guo H, Zhu P, Yan L, et al. The DNA methylation landscape of human early embryos. Nature. 2014;511(7511):606–610.
- Monk M. Genomic imprinting. Memories of mother and father. Nature. 1987;328(6127):203–204.
- Nakanishi MO, Hayakawa K, Nakabayashi K, et al. Trophoblast-specific DNA methylation occurs after the segregation of the trophectoderm and inner cell mass in the mouse periimplantation embryo. Epigenetics. 2012;7(2):173–182.
- Oda M, Oxley D, Dean W, et al. Regulation of lineage specific DNA hypomethylation in mouse trophectoderm. PLoS One. 2013;8(6):e68846.
- Santos F, Hendrich B, Reik W, et al. Dynamic reprogramming of DNA methylation in the early mouse embryo. Dev Biol. 2002;241(1):172–182.
- Smith ZD, Chan MM, Humm KC, et al. DNA methylation dynamics of the human preimplantation embryo. Nature. 2014;511(7511):611–615.
- Zhang Y, Xiang Y, Yin Q, et al. Dynamic epigenomic landscapes during early lineage specification in mouse embryos. Nat Genet. 2018;50(1):96–105.
- Chatterjee A, Macaulay EC, Rodger EJ, et al. Placental hypomethylation is more pronounced in genomic loci devoid of retroelements. G3 (Bethesda). 2016;6(7):1911–1921.
- Decato BE, Lopez-Tello J, Sferruzzi-Perri AN, et al. DNA methylation divergence and tissue specialization in the developing mouse placenta. Mol Biol Evol. 2017;34(7):1702–1712.
- Schroeder DI, Blair JD, Lott P, et al. The human placenta methylome. Proc Natl Acad Sci U S A. 2013;110(15):6037–6042.
- Schroeder DI, Jayashankar K, Douglas KC, et al. Early developmental and evolutionary origins of gene body DNA methylation patterns in mammalian placentas. PLoS Genet. 2015;11(8):e1005442.
- Chuong EB. Retroviruses facilitate the rapid evolution of the mammalian placenta. Bioessays. 2013;35(10):853–861.
- Church DM, Goodstadt L, Hillier LW, et al., Mouse Genome Sequencing, C. Lineage-specific biology revealed by a finished genome assembly of the mouse. PLoS Biol. 2009;7(5):e1000112.
- Slotkin RK, Martienssen R. Transposable elements and the epigenetic regulation of the genome. Nat Rev Genet. 2007;8(4):272–285.
- Okahara G, Matsubara S, Oda T, et al. Expression analyses of human endogenous retroviruses (HERVs): tissue-specific and developmental stage-dependent expression of HERVs. Genomics. 2004;84(6):982–990.
- Price EM, Cotton AM, Penaherrera MS, et al. Different measures of “Genome-wide” DNA methylation exhibit unique properties in placental and somatic tissues. Epigenetics. 2012;7(6):652–663.
- Warren IA, Naville M, Chalopin D, et al. Evolutionary impact of transposable elements on genomic diversity and lineage-specific innovation in vertebrates. Chromosome Res. 2015;23(3):505–531.
- Cohen CJ, Rebollo R, Babovic S, et al. Placenta-specific expression of the interleukin-2 (IL-2) receptor beta subunit from an endogenous retroviral promoter. J Biol Chem. 2011;286(41):35543–35552.
- Emera D, Wagner GP. Transposable element recruitments in the mammalian placenta: impacts and mechanisms. Brief Funct Genomics. 2012;11(4):267–276.
- Haig D. Retroviruses and the placenta. Curr Biol. 2012;22(15):R609–R613.
- Macaulay EC, Weeks RJ, Andrews S, et al. Hypomethylation of functional retrotransposon-derived genes in the human placenta. Mamm Genome. 2011;22(11–12):722–735.
- Mi S, Lee X, Li X, et al. Syncytin is a captive retroviral envelope protein involved in human placental morphogenesis. Nature. 2000;403(6771):785–789.
- Xie M, Hong C, Zhang B, et al. DNA hypomethylation within specific transposable element families associates with tissue-specific enhancer landscape. Nat Genet. 2013;45(7):836–841.
- Boyle P, Clement K, Gu H, et al. Gel-free multiplexed reduced representation bisulfite sequencing for large-scale DNA methylation profiling. Genome Biol. 2012;13(10):R92.
- Gu H, Smith ZD, Bock C, et al. Preparation of reduced representation bisulfite sequencing libraries for genome-scale DNA methylation profiling. Nat Protoc. 2011;6(4):468–481.
- Legault L-M, Chan D, McGraw S. Rapid multiplexed Reduced Representation Bisulfite Sequencing Library Prep (rRRBS). Bio-Protocol. 2019;9:4.
- Magnus N, Garnier D, Meehan B, et al. Tissue factor expression provokes escape from tumor dormancy and leads to genomic alterations. Proc Natl Acad Sci U S A. 2014;111(9):3544–3549.
- Akalin A, Kormaksson M, Li S, et al. methylKit: a comprehensive R package for the analysis of genome-wide DNA methylation profiles. Genome Biol. 2012;13(10):R87.
- Zhou Y, Zhou B, Pache L, et al. Metascape provides a biologist-oriented resource for the analysis of systems-level datasets. Nat Commun. 2019;10(1):1523.
- Hon GC, Rajagopal N, Shen Y, et al. Epigenetic memory at embryonic enhancers identified in DNA methylation maps from adult mouse tissues. Nat Genet. 2013;45(10):1198–1206.
- Whidden L, Martel J, Rahimi S, et al. Compromised oocyte quality and assisted reproduction contribute to sex-specific effects on offspring outcomes and epigenetic patterning. Hum Mol Genet. 2016;25(21):4649–4660. DOI:10.1093/hmg/ddw293
- Cross JC, Werb Z, Fisher SJ. Implantation and the placenta: key pieces of the development puzzle. Science. 1994;266(5190):1508–1518.
- Robinson WP, Price EM. The human placental methylome. Cold Spring Harb Perspect Med. 2015;5(5):a023044.
- Piche J, Gosset N, Legault LM, et al. Molecular signature of CAID syndrome: noncanonical roles of SGO1 in regulation of TGF-beta signaling and epigenomics. Cell Mol Gastroenterol Hepatol. 2019;7(2):411–431.
- Shaffer B, McGraw S, Xiao SC, et al. The dnmt1 intrinsically disordered domain regulates genomic methylation during development. Genetics. 2015;199(2):533–541.
- Hansen KD, Langmead B, Irizarry RA. BSmooth: from whole genome bisulfite sequencing reads to differentially methylated regions. Genome Biol. 2012;13(10):R83.
- Mizuuchi M, Cindrova-Davies T, Olovsson M, et al. Placental endoplasmic reticulum stress negatively regulates transcription of placental growth factor via ATF4 and ATF6beta: implications for the pathophysiology of human pregnancy complications. J Pathol. 2016;238(4):550–561.
- Kamachi Y, Kondoh H. Sox proteins: regulators of cell fate specification and differentiation. Development. 2013;140(20):4129–4144.
- Reiss D, Zhang Y, Mager DL. Widely variable endogenous retroviral methylation levels in human placenta. Nucleic Acids Res. 2007;35(14):4743–4754.
- Chapman V, Forrester L, Sanford J, et al. Cell lineage-specific undermethylation of mouse repetitive DNA. Nature. 1984;307(5948):284–286.
- Reichmann J, Reddington JP, Best D, et al. The genome-defence gene Tex19.1 suppresses LINE-1 retrotransposons in the placenta and prevents intra-uterine growth retardation in mice. Hum Mol Genet. 2013;22(9):1791–1806.