
 ?Mathematical formulae have been encoded as MathML and are displayed in this HTML version using MathJax in order to improve their display. Uncheck the box to turn MathJax off. This feature requires Javascript. Click on a formula to zoom.
ABSTRACT
To translate circulating microRNAs (miRNAs) into the clinic, a deeper understanding of the factors affecting their expression is needed. In this study, we explored the features affecting the expression of miRNAs and their genetic regulation using the expression data of 103 miRNAs obtained by qPCR in the platelet-poor plasma of 104 subjects. The principal components (PCs) of the expression of the miRNAs were associated with technical and biological features (e.g., synthetic controls or sex) and with blood cell counts. Also, the associations with proximal genetics variants were analysed. We found that haemolysis marker (dCt hsa-miR-23a-3p-hsa-miR-451a) was correlated strongly (β = 0.84, p = 2.07x10⁻²⁹) with the second PC, which explained 10.1% of the overall variability. Thus, we identified haemolysis as a source of variability for miRNA expression even in mild hemolyzed samples (haemolysis marker dCt <5). In addition to hsa-miR-23a-3p and hsa-miR-451a, the miRNAs most stable and most susceptible to haemolysis were identified. Then, we discovered that the expression of miRNAs in platelet-poor plasma was not biased by any blood cell count, and thus, our results supported their role as biomarkers of tissue-specific conditions. Finally, we identified 1,323 genetic variants that corresponded to 158 miRNA expression quantitative trait loci for 14 miRNAs (FDR <0.2), which were enriched in promoter regions (p = 0.03). This enrichment corresponded to a range of specific tissues (e.g., breast or fat) although not to blood tissue, supporting the concept that the expression of circulating miRNAs is under the genetic control of different tissues.
Introduction
MicroRNAs (miRNAs) are small non-coding RNAs that regulate the expression of their target genes binding a complementary seed sequence[Citation1]. Several studies have identified miRNA signatures associated with a specific disease or stages of disease [Citation2]. Among them, circulating miRNAs (i.e., those in whole blood, plasma, or serum) are particularly relevant because these are easy to assess in a non-invasive way, which is the most desirable characteristic of a useful biomarker.
Despite the promising findings in some diseases [Citation2,Citation3], the clinical application is still unachieved [Citation4]. In this regard, a wide range of analytic and pre-analytic conditions cause high inter- and intra-assay variability. For example, the extraction method, type of tubes for collection, time of storage, and normalization method must be reported to promote consistency across studies [Citation5–8]. Also, the biological basis of circulating miRNAs must be considered, in the context of the constant interaction with the abovementioned technical issues. For example, major differences must be expected among circulating miRNAs profiles when released from cells with or without vesicles, exosomes, or lipids [Citation9], between plasma and platelet-poor plasma [Citation10], or between serum and plasma [Citation8]. Moreover, for circulating miRNAs synthetized in a specific blood cell, the effect of the cell count as a confounder must be considered [Citation11]. All of these previous findings have provided a valuable basis to standardize methods for measurement, processing, and normalizing miRNA data. However, further studies are still needed before miRNAs can be utilized in the clinic.
Moreover, the genetic regulation of miRNAs must be studied further. Some genome-wide mapping studies have reported datasets of miRNA expression quantitative trait loci (miR-eQTLs). Most relevant examples are of the mapping studies conducted on whole blood as a part of the Framingham study [Citation12], on lymphoblastoid cell lines [Citation13], and most recently, on the whole blood of European obese subjects [Citation14]. These studies have provided valuable information about genetic biases and trends, such as an enrichment in mRNA-eQTLs or an important effect of distal variants. Moreover, other authors have used their miR-eQTLs datasets, for example, to develop a probability model to classify the genetic variants around a miRNA gene in eQTL or non-eQTL [Citation15]. However, the examples are still too few, so more tissue and cell-specific genome-wide mapping studies are needed. Each new piece of information will help to increase our knowledge about genetic regulation of miRNAs and their role in human diseases.
In the present study, we analyse the expression data of 103 platelet-poor plasma miRNAs in 104 individuals. Technical and biological features (e.g., haemolysis marker or age), as well as blood cell counts, are examined as sources of variability. Moreover, we unravel the proximal miR-eQTLs and their relationship with regulatory regions.
Results
Sources of variability in miRNA expression
The principal component analysis (PCA) of the 103 miRNAs expressed in at least 90% of the 104 individuals revealed that the first four principal components (PCs) explained 44.2% of the overall variability (). These first four PCs were extracted and correlated with technical and biological features, namely, synthetic controls (UniSp2, UniSp4, UniSp5, UniSp6, and UniSp3), haemolysis marker (dCt hsa-miR-23a-3p-hsa-miR-451a), age, sex, body mass index (BMI), smoking habit and disease condition. The results are given in Supplemental Data 1.
Figure 1. PCA of the 103 plasma miRNAs in the 104 subjects. (a) Percentage of variance explained by each of the first 20 components. (b) Eigen value, percentage of variance explained and cumulative (cum) variance explained by each of the first four principal components. (c) Coordinates for each of the 104 subjects, in the first and second PCs. The three most contributing miRNAs were: hsa-miR-103a-3p, hsa-miR-199a-3p and hsa-miR-107 for the first PC, and hsa-miR-451a-3p, hsa-miR-144-3p and hsa-miR-23b-3p for the second PC. (d) Coordinates for the 104 subjects in the third and fourth components. The three most contributing miRNAs were hsa-miR-19a-3p, hsa-miR-19b-3p and hsa-miR-423-5p for the third PC, and hsa-miR-29a-3p, hsa-miR-185-5p and hsa-miR-25-5p for the fourth PC
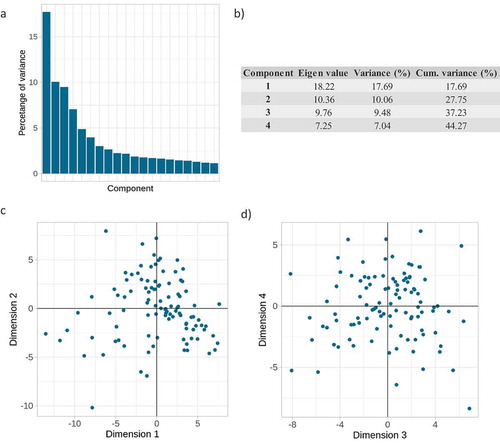
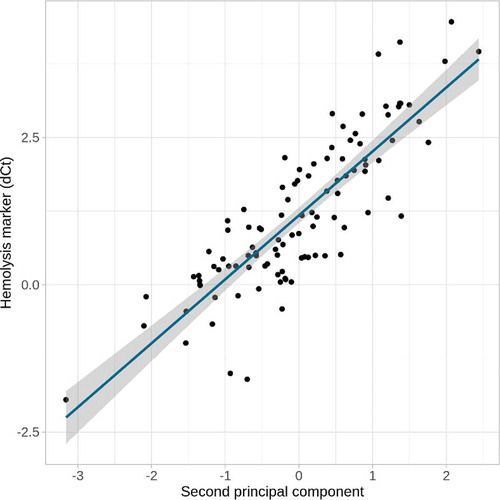
Only one significant (false discovery rate [FDR] <0.1) association was identified, the second PC, which explained 10.1% of the variability was strongly correlated with the haemolysis marker (β = 0.84, p = 2.07x10⁻²⁹, ). It should be noted that the maximum value of the haemolysis marker dCt was 4.46, far from dCt = 7, from which samples should be excluded, and below dCt = 5, from which samples are considered as at low risk of haemolysis (please, see Methods for further details). Furthermore, to ensure that the disease condition was not a confounder, the correlation between disease and haemolysis was calculated and it was not significant (β = −0.11, p = 0.27).
Figure 2. Correlation between haemolysis marker and second PC. The second PC of the 103 miRNAs explained a 10.1% of their variability and was strongly correlated (β = 0.84, p = 2.07x10⁻²⁸) with the haemolysis marker (dCt hsa-miR-23a-3p – hsa-miR-451a)
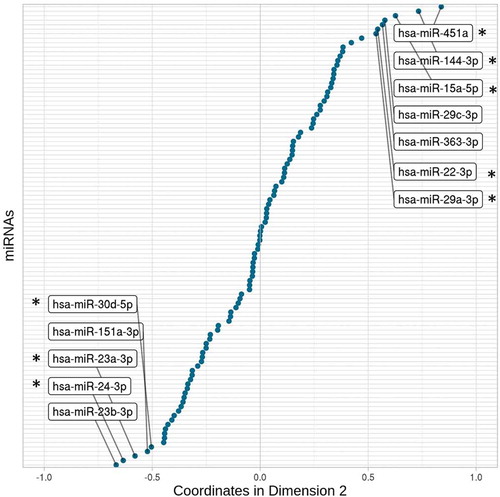
The larger contributors and, therefore, the better-represented miRNAs on the second PC are shown in . As expected, the haemolysis marker-miRNAs (i.e., hsa-miR-451a and hsa-miR-23a-3p) were among the greater contributors and on opposite coordinates. However, also other miRNAs were closely related to both of them: the miRNAs most susceptible and most stable to haemolysis. Furthermore, the contributions of these 12 highlighted miRNAs explained ~44% of the second PC, whereas the remaining 91 miRNAs accounted for 56% of the variability represented in the second dimension (Supplemental Data 2). Therefore, even in low hemolyzed samples, haemolysis could be understood as a confounding factor in plasma miRNA expression studies.
Figure 3. Coordinates of each of the 103 miRNAs in the second dimension. The miRNAs with coordinates less than −0.5 and greater than 0.5 are labelled. It represents the miRNAs that are most stable (negative x axis) and susceptible (positive x axis) to haemolysis. Among them, asterisks show the ones for which previous studies support their susceptibility or stability against haemolysis
Effect of blood cell counts on miRNA expression
The first four PCs were correlated with blood cell counts. However, none of them was associated significantly (FDR >0.1). To explore the effect on the individual variability, single correlations between each of the miRNAs and each blood cell count were tested (Supplemental Data 3). Only one significant correlation was obtained: hsa-miR-150-5p and lymphocyte count (β = 0.39, p = 4.8x10−05, FDR = 0.07). Moreover, the same analysis was performed using the residual values of the miRNAs corrected by the first four PCs (Supplemental Data 4). Only the above correlation reached statistical significance (β = 0.40, p = 2.90x10−05, FDR = 0.06). Therefore, no blood cell count was a major determinant of the overall variability affecting miRNA expression in platelet-poor plasma, and only one of 103 miRNAs analysed was significantly associated with a specific blood cell count.
The correlations between disease and blood cell counts were calculated to ensure that the disease was not a confounding factor. None of the correlations reached statistical significance (FDR >0.1).
Genome-wide mapping of miRNA expression
The expression of each miRNA, corrected for the effect of the aforementioned first four PCs, was associated with the genetic variants located 1MB around the corresponding miRNA gene. As the X chromosome was not imputed in our sample, a total of 98 miRNAs were included.
At FDR <0.2, 1,323 significant genetic variants were identified (Supplemental Data 5). Setting linkage disequilibrium (LD) limit at r2 = 0.8, corresponded with 158 unique cis-miR-eQTLs for 14 mature miRNAs and 16 miRNA genes (Supplemental Data 6).
Therefore, cis-miR-eQTLs were detected for 14.3% of the miRNAs. None of the signals was shared between more than one miRNA. hsa-miR-7a-5p is encoded at three different positions in the genome, and significant signals were obtained for all of them. For the other miRNAs that are encoded at more than one position, cis-miR-eQTLs were obtained only for one of the positions. Regarding the 158 cis-miR-eQTLs, most of them were located in intronic regions (62.6%) and 50,63% were also mRNA-eQTLs.
Tissue specificity of the miR-eQTLs
First, the positions of the 158 cis-miR-eQTLs were analysed in relation to promoter or enhancer regions determined by histone markers, as indicators of active regulatory regions. The frequencies of both enhancer and promoter regions were compared with the expected by chance in non-miR-eQTLs (please see Methods). Though there was not enrichment in enhancer regions (expected = 50.63%, observed = 53.97; p > 0.05), there was a significant enrichment in promoter regions (expected = 15.48%, observed = 21.51%; p = 0.03).
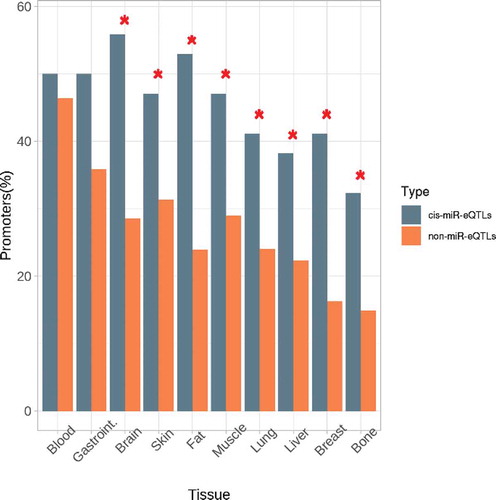
The tissues in which the miR-eQTLs were identified as regulatory regions were analysed by testing the enrichment against the random non-miR-eQTLs. summarizes the results for both enhancer and promoter regions. Although there was not a global enrichment in enhancers, the lung and liver enhancers were specifically overrepresented. Moreover, while the great majority of tissue-specific promoters were enriched, only blood and gastrointestinal tissues were not significantly overrepresented (). Overall, cis-miR-eQTLs for expression of miRNAs in platelet-poor plasma were enriched in promoter regions in several specific tissues but not in blood tissue.
Table 1. Enrichment analysis of cis-miR-eQTLs in regulatory regions. Frequencies expected by chance (non-miR-eQTLs) and observed in the 158 cis-miR-eQTLs identified, for both enhancers and promoters of each tissue, and the significance of the enrichment test
Figure 4. Tissue enrichment for the cis-miR-eQTLs located in promoter regions. Comparison of the observed frequencies of promoters by tissue and the frequencies expected by chance in the non-miR-eQTLs of the same characteristics
Discussion
In this study, we have shed light on the factors that affect the expression of miRNAs in plasma and on their genetic regulation.
Our results showed that the haemolysis marker was strongly () correlated with the second PC, which explained ~10% of the variability in the 103 widely expressed miRNAs. While some technical and analytical parameters regarding miRNA quantification are not standardized yet [Citation5–7], haemolysis marker is globally established as the most sensitive method to detect haemolysis in miRNA expression analysis, even more than other available measures, such as spectrophotometry [Citation16]. The rule is to discard those samples with a haemolysis marker above 7, consider as medium-risk those in the range 5–7, and low risk when under 5 [Citation17]. In this regard, some studies have identified great differences in the expression of circulating miRNAs among samples with different grades of haemolysis[Citation18]. Thus, not only the high-risk haemolysis samples excluded, but methodological procedures have been developed to analyse the effect of haemolysis in miRNA when proposed as a disease biomarker [Citation19]. However, all of these previous studies analysed the effect on hemolyzed samples in comparison to non-hemolyzed ones. Our results suggest, for the first time, that haemolysis affects the expression of miRNAs even when all of the samples are in the safe range of haemolysis. Therefore, our data suggest that in addition to being used as a categorical control, the haemolysis marker could be used also as a continuous technical covariate. Using the haemolysis marker as covariate, a ~ 10% of variability would be removed and thus, the consistency across studies may be enhanced.
Furthermore, the analysis of the coordinates of each miRNA in the second PC dimension () identified the miRNAs that are most stable and most susceptible to haemolysis in platelet-poor plasma. The miRNAs in the group of hsa-miR-451a (enriched in red blood cells [Citation20]) included four miRNAs known to be related to haemolysis. First, hsa-miR-144-3p is encoded in the same genetic locus that hsa-miR-451a and the expressions of these two are known to be coordinated [Citation21]. Also, hsa-miR-15a-5p, which is encoded on the genetic cluster hsa-miR-15a/16-1, is highly susceptible to haemolysis [Citation18,Citation19]. For the other two miRNAs in the group, some previous studies have suggested their susceptibility to haemolysis and thus, our results support the implication of hsa-miR-29a [Citation22] and hsa-miR-22-3p [Citation23]. To our knowledge, the two remaining miRNAs, hsa-miR-29 c-3p and hsa-miR-363-3p, have not been related to haemolysis before. It should be noted that some miRNAs known to be related to red blood cells [Citation24] were not into the most affected by haemolysis in our sample, such as hsa-miR-16 (position 25/103 in the ranking by contribution to the second dimension) or hsa-miR-92 (position 35/103). From these results, it seems that hsa-miR-16 and hsa-miR-92 have less influence on haemolysis, or that the methodologies used for their detection have different sensitivities for these two miRNAs. Among the miRNAs that are most stable against haemolysis, besides hsa-miR-23a-3p, we find that previous studies have reported hsa-miR-24-3p and hsa-miR-30d to be unaffected by haemolysis [Citation24,Citation25]. In the course of our literature survey, we have not come across any study that has related the other two stable miRNAs, namely, hsa-miR-151a-3p and hsa-miR-23b-3p, with haemolysis. Overall, we have identified the two subsets of the miRNAs, the most stable and the most susceptible to haemolysis in the safe range of haemolysis, in platelet-poor plasma. Also, we provide the contribution of each of the 103 miRNAs to this variability (Supplemental Data 2). We expect these data would prove useful for checking any particular miRNA when proposed as a biomarker of a disease, as well as for further studies that analyse the effect of haemolysis on miRNA quantification.
Then, we explored the correlations of blood cell counts with each miRNA and with their PCs. We found that only hsa-miR-150-5p and lymphocyte count reached statistical significance. This association has been reported earlier in an exhaustive study that advised the researchers to be aware of the effect of blood cell counts when measuring circulating miRNAs because some miRNA expression levels could be simply mirroring the corresponding cell count [Citation11]. However, we found that no other miRNA was significantly associated with a blood cell count in our sample. In this sense, a genome-wide mapping of miRNAs in whole blood found no significant differences whether or not the miRNAs were adjusted to the blood cell counts [Citation12]. In accordance, our analysis indicated that, neither the expression of miRNAs in plasma nor their quantification is biased by the blood cell count and therefore, encourage their potential role as circulating biomarkers of certain diseases. Moreover, our results suggest that even for these miRNAs synthetized in a specific blood cell (e.g., hsa-miR-150-5p), miRNA levels do not merely mirror the corresponding cell count but can represent a specific biological process (e.g., hsa-miR-451a has been related to erythrocyte maturation [Citation21,Citation26] and hsa-miR-150-5p to the prognostic of patients with sepsis [Citation27,Citation28]).
Further, we have identified and reported a dataset of 1,323 genetic variants that correspond to 158 cis-miR-eQTLs for 14 miRNAs and 16 miRNAs genes. Similar useful datasets have been provided for whole blood or specific cell types [Citation12–14]. We expect that our plasma cis-miR-eQTLs dataset will prove to be a useful piece of information for other researches. As in the case of the previous studies, we only obtained cis-miR-eQTLs for ~14% of the tested miRNAs. This reflects the complexity of the genetic regulation that underlies miRNA expression.
We found that cis-miR-eQTLs were specifically enriched in promoter regions and a specific enrichment in several tissues, whereas not in blood. This result concurs with our expression analysis and suggests that miRNAs expressed in plasma are genetically regulated in different tissues, though not specifically in blood cells. In this regard, how and why miRNAs are released into extracellular biofluids is not clear. While miRNA expression is highly tissue-specific [Citation29] and, therefore, the levels of circulating miRNAs are sometimes poorly associated with their levels in other specific tissues [Citation30], several studies have reported close associations between aberrant circulating miRNA levels and their levels of expression in particular tissues [Citation31,Citation32]. However, a range of theories about their biological basis has been suggested. It is theorized that circulating miRNAs are mere bioproducts of cell activity or cell death, or selectively released as mechanisms of cell-cell communication [Citation9,Citation33,Citation34]. We consider that all of these theories could apply and, although we cannot hypothesize about their function, our results suggest that the origin of circulating miRNAs is genetically controlled by different specific tissues and not especially by the blood cells, which further enhances their value as biomarkers of tissue-specific conditions.
One limitation of our study is that the sample size (n = 104) could limit the ability to detect associations with either genetic variants or with technical and biological features. Thus, some relevant relationships could remain hidden. However, we have included only the proximal genetic variants and used multiple testing corrections to ensure that the results are reliable. Second, we highlight that the results about the relation with blood cell counts must be interpreted only for platelet-poor plasma. It is possible that other results could be found in other biofluids, such as platelet-rich plasma or serum. Also, it should be considered that half of the population included in this study has suffered a thrombotic event. However, the disease has been analysed as a confounding factor throughout the study and none of the highlighted miRNAs are associated with the disease in our cohort [Citation35]. Finally, we acknowledge that all findings need to be validated in independent populations.
In conclusion, the main findings of this study are: (1) the haemolysis marker explains 10% of variability of miRNA expression even in mild-hemolyzed samples and it could be used as a continuous technical covariate, (2) expression of miRNAs in platelet-poor plasma is not widely biased by blood cell counts, (3) a total of 158 cis-miR-eQTLs for 14 miRNAs at FDR <0.2 are identified, and (4) the cis-miR-eQTLs for plasma miRNAs are enriched in promoter regions, but not specifically in the blood-tissue regions. These results provide valuable knowledge gaining further understanding of the variability in miRNA assays, the genetic regulation of circulating miRNAs, and their potential role as biomarkers of disease.
Methods and patients
Population
This study used the miRNA data of the discovery phase of a venous thrombosis specific research [Citation35]. Therefore, the population was 104 subjects of the ‘Genetic Analysis of Idiopathic Thrombophilia’ (GAIT-2) cohort [Citation36]. The population included 52 patients who had suffered a thrombotic event in previous years (excluding paraneoplastic thrombosis) and 52 healthy controls, matched for age and sex, and genetically unrelated. Briefly, of the 104 subjects, 68 (65.5%) were females, with an average age of 49.5 years (range 20.3–87.3 years), average BMI of 27.4 and 34 (32.7%) were active smokers.
The GAIT-2 study was reviewed and approved by the Institutional Review Board of the Hospital de la Santa Creu i Sant Pau (Barcelona, Spain). All participants gave written informed consent for themselves and for their minor children. They acknowledge that they could not be identified via the paper and we have ensured their complete anonymity.
miRNA quantification
Before the collection of samples, the anticoagulant, antiplatelet and anti-inflammatory treatments that the subjects had been undergoing, if any, were suspended. Moreover, the samples were collected at least three months after the last thrombotic event and at least one month after any acute inflammatory process. Platelet-poor plasma was collected in citrated tubes, centrifugated (2000 g for 25 minutes at room temperature) and frozen at −80ºC until use.
The isolation of miRNAs was done with miRCURYTM RNA Isolation Kit (Exiqon) and miRNA was reverse transcribed to cDNA using miRCURY™ LNA™ Universal RT (Exiqon). Then, 752 miRNAs were quantified by qPCR in each of the 104 subjects, using miRCURY LNA™ miRNA miRNOME PCR Panel-Human I+ II (Exiqon). Amplification was performed in a LightCycler® 480-Real Time PCR System (Roche). Quality was assayed using UniSp2, UniSp4, and UniSp5 as controls of miRNA extraction, UniSp6 as reverse transcription control, and UniSp3 as inter-plate calibrator. Specificity and contamination were controlled by non-template controls. Haemolysis was assayed using the miRNA haemolysis marker (i.e., dCt hsa-miR-23a-3p – hsa-miR-451a) [Citation17]. Ct values above 37 were considered undetectable. Following manufacturer protocol, raw Ct values were corrected by the inter-plate calibrator (UniSp3) and the most stable value for inter-individual normalization was selected using NormFinder [Citation37].
All the assays met all the quality controls. The ‘global mean’ of the 40 miRNAs expressed in all the individuals was found as the most suitable value for normalization. Thus, for miRNA a of a subject s, measured in the plate p, the final expression value (dCq) was as follows:
where, plate calibration factor (p) = UniSp3 (p) – mean UniSp3 (all plates)
and where, Global Mean (s) = mean Cq value of the 40 miRNAs for individual s.
Blood cell counts
Blood cell counts were quantified on fresh blood using the haematologic analyser Sysmex XE-2100. We included absolute numbers of platelets, leucocytes, lymphocytes, basophils, eosinophils, neutrophils, monocytes (109/litre), and erythrocytes (1012/litre).
Statistics of miRNA expression
All statistical analyses were performed using R, version 3.6.1. The miRNAs expressed in more than 90% of the individuals were selected for further analyses, to reduce missing values. The remaining missing values were imputed by the predictive mean matching method, using R package mice [Citation38]. PCA was calculated by Eigen decomposition and the PCs and the corresponding contributions and coordinates for each variable were extracted using the R package FactoMineR [Citation39]. The first four PCs were associated, using Pearson correlations, with technical factors (i.e., haemolysis marker, Unisp2, UniSp3, UniSp4, UniSp5, and Unisp6), and biologic features (i.e., age, sex, BMI, smoking attitude [codified as smokers or non-smokers] and disease condition [if they had suffered a thrombotic event, codified as 0 for ‘no’ and 1 for ‘yes’]). Later, the same PCs and the expression of every single miRNA were correlated with the blood cell counts using Pearson correlations. Significance was adjusted for multiple comparisons using FDR [Citation40], with the qvalue R package. Afterwards, for subsequent analyses, miRNA expression values were corrected for the effect of the aforementioned PCs.
Genotyping and identification of cis-miR-eQTLs
Genotyping and imputation processes in the GAIT-2 population have been described extensively [Citation36]. Briefly, the genotyping was done with a combination of HumanOmniExpressExome-8v1.2 and HumanCoreExome-12v1.1, and the imputation to the 1000 genomes panel was done using IMPUTE2 [Citation41]. The genetic variants with minor allele frequency (MAF) <5% in the 104 subjects were excluded.
Associations between the expression of each miRNA and its cis genetic variants (i.e., those located 1MB around the miRNA gene) were calculated using R package MatrixEQTL [Citation42]. The associations, with age and sex as covariates, were performed using the linear additive model. The associations at FDR <0.2 from the FDR estimates calculated directly by MatrixEQTL, were considered statistically significant. Then, the statistically associated genetic variants were grouped into independent cis-miR-eQTLs using a LD threshold of r2 = 0.8. The genetic locations of the miRNA genes were obtained from miRBase [Citation43] v20 in the genome build GRCh37.p5.
Regulatory regions and other genome features
The genomic features regarding the genetics variants identified as cis-miR-eQTLs were annotated using R package haploR [Citation44] under the default settings. Enrichment tests were performed for the frequency of active regulatory regions (i.e., enhancers and promoters), based on the 15-state model of ChromHMM [Citation45]. Expected frequencies by chance were calculated by the mean value of 100 random samples of 100 genetic variants bearing the same characteristics. That is, the genetic variants located 1MB around the miRNA genes and with MAF ≥5% (i.e., from those tested but not associated with any miRNA) and named ‘non-miR-eQTLs’ according to the previous nomenclature [Citation15]. These expected frequencies were compared with the observed frequencies by a two-tailed chi-square test.
Supplemental Material
Download MS Excel (276.6 KB)Acknowledgments
We thank William H. Stone for reviewing the manuscript, and A. Cardenas and C. Muñoz for their technical support.
Disclosure statement
The authors declare no conflict of interest
Supplementary material
Supplemental data for this article can be accessed here
Additional information
Funding
Notes
1. Gastrointestinal.
References
- Huntzinger E, Izaurralde E. Gene silencing by microRNAs: contributions of translational repression and mRNA decay. Nat Rev Genet. 2011;12(2):99–110.
- Wang J, Chen J, Sen S. MicroRNA as Biomarkers and Diagnostics. J Cell Physiol. 2016;231(1):25–30.
- Pogribny IP. MicroRNAs as biomarkers for clinical studies. Exp Biol Med. 2018;243(3):283–290.
- Saliminejad K, Khorram Khorshid HR, Ghaffari SH. Why have microRNA biomarkers not been translated from bench to clinic? Futur Oncol. 2019;15(8):801–803.
- Glinge C, Clauss S, Boddum K, et al. Stability of circulating blood-based microRNAs-Pre-Analytic methodological considerations. PLoS One. 2017;12(2):1–16.
- Poel D, Buffart TE, Oosterling-Jansen J, et al. Evaluation of several methodological challenges in circulating miRNA qPCR studies in patients with head and neck cancer. Exp Mol Med. 2018;50(3):e454–e454.
- Pritchard CC, Cheng HH, Tewari M. MicroRNA profiling: approaches and considerations. Nat Rev Genet. 2012;13(5):358–369.
- McDonald JS, Milosevic D, Reddi HV, et al. Analysis of circulating microRNA: preanalytical and analytical challenges. Clin Chem. 2011;57(6):833–840.
- Sohel MH. Extracellular/circulating MicroRNAs: release mechanisms, functions and challenges. Achiev Life Sci. 2016;10(2):175–186.
- Binderup HG, Houlind K, Madsen JS, et al. Pre-storage centrifugation conditions have significant impact on measured microRNA levels in biobanked EDTA plasma samples. Biochem Biophys Reports. 2016;7:195–200.
- Pritchard CC, Kroh E, Wood B, et al. Blood cell origin of circulating MicroRNAs: a cautionary note for cancer biomarker studies. Cancer Prev Res. 2012;5(3):492LP- 497.
- Huan T, Rong J, Liu C, et al. Genome-wide identification of microRNA expression quantitative trait loci. Nat Commun. 2015;6:1–9.
- Gamazon ER, Ziliak D, Im HK, et al. Genetic architecture of microRNA expression: implications for the transcriptome and complex traits. Am J Hum Genet. 2012;90(6):1046–1063.
- Nikpay M, Beehler K, Valsesia A, et al. Genome-wide identification of circulating-miRNA expression quantitative trait loci reveals the role of several miRNAs in the regulation of cardiometabolic phenotypes. Cardiovasc Res. 2019;115(11):1629–1645.
- Budach S, Heinig M, Marsico A. Principles of microRNA regulation revealed through modeling microRNA expression quantitative trait loci. Genetics. 2016;203(4):1629–1640.
- Shah JS, Soon PS, Marsh DJ. Comparison of methodologies to detect low levels of hemolysis in serum for accurate assessment of serum microRNAs. PLoS One. 2016;11(4):e0153200.
- Blondal T, Jensby Nielsen S, Baker A, et al. Assessing sample and miRNA profile quality in serum and plasma or other biofluids. Methods. 2013;59(1):164–169.
- Kirschner MB, Edelman JJB, Kao SC-H, et al. The impact of hemolysis on cell-free microRNA biomarkers. Front Genet. 2013;4:94.
- Pizzamiglio S, Zanutto S, Ciniselli CM, et al. A methodological procedure for evaluating the impact of hemolysis on circulating microRNAs. Oncol Lett. 2017;13(1):315–320.
- Rasmussen KD, Simmini S, Abreu-Goodger C, et al. The miR-144/451 locus is required for erythroid homeostasis. J Exp Med. 2010;207(7):1351–1358.
- Kretov DA, Walawalkar IA, Mora-Martin A, et al. Ago2-dependent processing allows miR-451 to evade the global microRNA turnover elicited during erythropoiesis. Mol Cell. 2020;78(2):317–328.e6.
- Yamada A, Cox MA, Gaffney KA, et al. Technical factors involved in the measurement of circulating microRNA biomarkers for the detection of colorectal neoplasia. PLoS One. 2014;9(11):e112481–e112481.
- Landoni E, Miceli R, Callari M, et al. Proposal of supervised data analysis strategy of plasma miRNAs from hybridisation array data with an application to assess hemolysis-related deregulation. BMC Bioinformatics. 2015;16(1):388.
- Kirschner MB, Kao SC, Edelman JJ, et al. Haemolysis during sample preparation alters microRNA content of plasma. PLoS One. 2011;6(9):e24145–e24145.
- Meerson A, Ploug T. Assessment of six commercial plasma small RNA isolation kits using qRT-PCR and electrophoretic separation: higher recovery of microRNA following ultracentrifugation. Biol Methods Protoc. 2016;1(1):1–9.
- Pase L, Layton JE, Kloosterman WP, et al. miR-451 regulates zebrafish erythroid maturation in vivo via its target gata2. Blood. 2009;113(8):1794–1804.
- Vasilescu C, Rossi S, Shimizu M, et al. MicroRNA fingerprints identify miR-150 as a plasma prognostic marker in patients with sepsis. PLoS One. 2009;4(10):e7405.
- Ma Y, Liu Y, Hou H, et al. MiR-150 predicts survival in patients with sepsis and inhibits LPS-induced inflammatory factors and apoptosis by targeting NF-κB1 in human umbilical vein endothelial cells. Biochem Biophys Res Commun. 2018;500(3):828–837.
- Liang Y, Ridzon D, Wong L, et al. Characterization of microRNA expression profiles in normal human tissues. BMC Genomics. 2007;8:1–20.
- Nagy ZB, Barták BK, Kalmár A, et al. Comparison of circulating miRNAs expression alterations in matched tissue and plasma samples during colorectal cancer progression. Pathol Oncol Res. 2019;25(1):97–105.
- Zedan AH, Hansen TF, Assenholt J, et al. MicroRNA expression in tumour tissue and plasma in patients with newly diagnosed metastatic prostate cancer. Tumor Biol. 2018;40(5):1–11.
- Xu L, Li M, Wang M, et al. The expression of microRNA-375 in plasma and tissue is matched in human colorectal cancer. BMC Cancer. 2014;14:714.
- Turchinovich A, Weiz L, Burwinkel B. Extracellular miRNAs: the mystery of their origin and function. Trends Biochem Sci. 2012;37(11):460–465.
- Zhao C, Sun X, Li L. Biogenesis and function of extracellular miRNAs. ExRNA. 2019;1(1):1–9.
- Rodriguez-Rius A, Lopez S, Martinez-Perez A, et al. Identification of a plasma microRNA profile associated with venous thrombosis. Arterioscler Thromb Vasc Biol. 2020;May:1392–1399. DOI:10.1161/ATVBAHA.120.314092
- Martin-Fernandez L, Ziyatdinov A, Carrasco M, et al. Genetic determinants of thrombin generation and their relation to venous thrombosis: results from the GAIT-2 project. PLoS One. 2016;11(1):1–12.
- Andersen CL, Jensen JL, Orntoft TF. Normalization of real-time quantitative reverse transcription-PCR data: a model-based variance estimation approach to identify genes suited for normalization, applied to bladder and colon cancer data sets. Cancer Res. 2004;64(15):5245–5250.
- van Buuren S, Groothuis-Oudshoorn K. mice: multivariate imputation by chained equations in R. J Stat Software. 2011 December;1(3). https://www.jstatsoft.org/v045/i03.
- Lê S, Josse J, Husson F. FactoMineR: an R package for multivariate analysis. J Stat Software. 2008;1(1). DOI:10.18637/jss.v025.i01.
- Storey JD. A direct approach to false discovery rates. J R Stat Soc Ser B Stat Methodol. 2002;64(Part 3):479–498.
- Howie BN, Donnelly P, Marchini J. A flexible and accurate genotype imputation method for the next generation of genome-wide association studies. PLoS Genet. 2009;5:6.
- Shabalin AA. Matrix eQTL: ultra fast eQTL analysis via large matrix operations. Bioinformatics. 2012;28(10):1353–1358.
- Griffiths-jones S, Grocock RJ, Dongen SV, et al. miRBase: microRNA sequences, targets and gene nomenclature. Nucleic Acids Res. 2006;34:140–144.
- Zhbannikov IY, Arbeev K, Yashin AI. haploR: an R-package for querying web-based annotation tools. F1000Res. 2017;6(1):97.
- Ernst J, Kellis M. ChromHMM: automating chromatin-state discovery and characterization. Nat Methods. 2012;9:215.