
ABSTRACT
To investigate the detailed functions and underlying mechanisms of miR-518a-5p/CCR6 in diffuse large B cell lymphoma (DLBCL) is needed. In this study, CCR6 expression levels were tested both in DLBCL cell lines and specimens. Through bioinformatics analysis and quantitative real-time PCR (qRT-PCR) validation, CCR6’s targeted miRNA was obtained. Dual luciferase assay was used to verify their targeted relationship. Futhermore, using qRT-PCR, western blot, CCK8, Transwell assays, flow cytometry, pyrosequencing, chromatin immunoprecipitation, and azacitidine/C646 treatment, the detailed functions and underlying mechanisms of CCR6 and its targeted miRNA in DLBCL were detected. We found that negative correlation existed between CCR6 and miR-518a-5p in DLBCL. Both up-regulated miR-518a-5p and down-regulated CCR6 inhibited cell proliferation and invasion in vitro. Experiment then verified the regulatory relationship between miR-518a-5p and CCR6. JAK2 and STAT6 levels were reduced in DLBCL cells transfected with miR-518a-5p mimic or CCR6 small interfering RNA. Interestingly, we showed for the first time that a hyper-methylated condition existed at the promoter region of miR-518a-5p and azacitidine changed levels of miR-518a-5p in a time- and concentration-dependent manner. Finally, we found an enriched histone H3 on lysine 27 acetylation existed in the promoter of CCR6, whose expression could also be changed via C646 in a time- and concentration-dependent manner. The above results suggest that miR-518a-5p-CCR6 feedback loop plays a critical role in DLBCL development. The overexpression of CCR6 is mainly mediated by epigenetic modification through transcriptional and post-transcriptional activation, which provides new directions for DLBCL treatment.
Introduction
Diffuse large B cell lymphoma (DLBCL) is an aggressive lymphoma and the most frequent lymphoma accounting for more than 30% of the lymphoma cases [Citation1]. It also has one of the highest mortality rates in the developed world. Although efforts have been made in recent years to improve survival outcomes of DLBCL patients, mortality figures remain high. As such, identification of potential biomarkers is required for a better understanding of DLBCL pathogenesis, intensive monitoring to optimize the likelihood of timely intervention, and developing individualized treatment plans.
Chemokines, known as chemotactic cytokines and the largest subfamily of cytokines, have been widely accepted as an important part of cross talk between tumour cells and tumour microenvironment [Citation2]. They and their receptors are also found to play an important role in tumour initiation, growth and invasion [Citation2]. More recently, chemokines and their receptors were reported to be associated with the modulation of DLBCL, including tumour proliferation, tumour migration and invasion [Citation3]. In our previous bioinformatics analysis, it has been suggested that CCR6 may play an important role in DLBCL [Citation4]. The human CCR6 gene is located on chromosome 6q27 with only one chemokine ligand, CCL20. CCR6 is expressed on immature dendritic cells, natural killer T cells, subsets of CD4+ and CD8 + T cells, and most B cells [Citation5]. CCR6 is also a specific marker of regulatory T cells distinguishing them from other helper T cells [Citation5]. Although CCR6 has been verified to be expressed on numerous cancer cells, including colorectal cancer, thyroid cancer and laryngeal cancer [Citation6–8], the expression status and function of CCR6 in DLBCL are not fully elucidated. Further investigations are needed to fill in these blanks.
MicroRNA (MiRNA), a small and high-conserved non-coding RNA molecule (containing about 22 nucleotides), functions in RNA silencing and mediates post-transcriptional regulation of gene expression. To date, dysregulation of miRNAs in cancer contribute to the multistep process of carcinogenesis either as oncogenes or tumour suppressor genes, that is, miRNAs and their targeted genes combine together in a functional network to influence disease initiation and progression [Citation9]. Thus, we hypothesize that CCR6’s targeted miRNAs also likely play a similar role in DLBCL.
Epigenetics is a way of genetic inheritance, which refers to the mechanism that mediates transcriptional and post-transcriptional regulation without altering primary DNA sequences. Epigenetics includes DNA methylation, histone modification, chromatin remodelling, and non-coding RNAs. It has been verified that chemokines/chemokine receptors underlying cancer pathogenesis are associated with epigenetic alterations [Citation10]. MiRNAs whose permanent expression levels are silenced by methylation have been reported in various B-cell lymphomas [Citation11–13]. Since chemokines/chemokine receptors’ regulation mechanisms have not been reported yet in DLBCL and are worthy of further study, we want to reveal which epigenetic alteration contributed to CCR6’s regulation.
In the present study, it was confirmed that CCR6 expression was elevated in most DLBCL tissues compared with non-tumour lymph node tissues. Bioinformatics and Chromatin immunoprecipitation (ChIP) analysis showed the CCR6 promoter was acetylated, which was positively associated with its expression. Targeted miRNA screening and validation showed that miR-518a-5p, which was highly methylated, mediated post-translational regulation of CCR6. Downregulation of CCR6 and overexpression of miR-518a-5p resulted in cancer suppression in vitro. Interestingly, we also demonstrated that CCR6 and miR-518a-5p formed a feedback loop and negatively regulated the expression of each other in DLBCL cell lines. Our study offers new biomarkers for DLBCL. Furthermore, the data here show for the first time that epigenetic modification of CCR6 at transcriptional and post-transcriptional levels promotes DLBCL proliferation and invasion, which may provide new treatment directions for DLBCL.
Material and methods
miRNA prediction
To predict potential miRNAs that target CCR6, TargetScan (http://www.targetscan.org/vert_72/) [Citation14], miRWalk (http://mirwalk.umm.uni-heidelberg.de/) [Citation15], StarBase (http://starbase.sysu.edu.cn/starbase2/) [Citation16], miRDB (http://mirdb.org/) [Citation17], miRTarBase (http://mirtarbase.mbc.nctu.edu.tw/php/index.php) [Citation18] and DIANA-microT (http://diana.imis.athena-innovation.gr/DianaTools/index.php?r=microT_CDS/index) [Citation19] were used. Overlapping miRNAs from at least five miRNA databases were selected.
Patients’ specimens
DLBCL cases selected in our study met the following criteria: (1) cases should only be confirmed by pathological examination of lymph node biopsy or lymphadenectomy; (2) formalin-fixed, paraffin-embedded (FFPE) lymph node specimens prior to any treatment were available between Jan 2016 and Jan 2018; (3) all the patients have undergone to the same first-line treatment course (R-CHOP/CHOP). Thus FFPE samples originating from 56 cases of DLBCL and 29 cases suffered from reactive lymphoid hyperplasia were collected in the Haematology Department of Fujian Medical University Union Hospital. Our research was approved by the Medical Ethics Committee of Fujian Medical University Union Hospital, and written informed consent was obtained from all patients ahead of the experiment. The study has been performed in accordance with the ethical standards as laid down in the 1964 Declaration of Helsinki and its later amendments or comparable ethical standards. Information on those included DLBCL patients is listed in Table S1.
Immunohistochemistry analysis
Immunohistochemistry analysis was performed on the above FFPE sections. The primary antibody used was CCR6 (1:500, Abcam, USA). Staining was detected using a MaxVisionTM detection kit (KIT-5220, Fuzhou Maixin Inc., China).
Bioinformatics analysis of CCR6
The expression level of CCR6 in DLBCL was also verified through the Cancer Cell Line Encyclopaedia (CCLE, https://portals.broadinstitute.org/ccle/) [Citation20].
CCR6 mutation in DLBCL was detected through cBioPortal for Cancer Genomics (http://cbioportal.org). Epigenetic modification of the CCR6 promoter region was performed via Cistrome Data Browser (http://cistrome.org/db/) [Citation21] and the UCSC Genome Browser database (http://genome.ucsc.edu/) [Citation22].
Cell cultivation and transfection
The normal B cell line, HMy2.CIR was purchased from the Cell Bank of Chinese Academy of Science (Shanghai, China). DLBCL cell lines SU-DHL-2 and SU-DHL-6 were both obtained from the American Type Culture Collection (ATCC, Manassas, VA, USA). All the cell lines were authenticated using short tandem repeat (STR) analysis. For cell cultivation, SU-DHL-2 and SU-DHL-6 cells were cultured in Roswell Park Memorial Institute-1640 (RPMI-1640) medium (Gibco, USA), while the HMy2.CIR cell was cultured in Iscove’s Modified Dulbecco (IMBM) Medium (Gibco, USA). All mediums were supplemented with 10% foetal bovine serum (FBS) (Gibco, USA) and 1% penicillin-streptomycin. Cells were maintained at 37°C in standard culture conditions.
Subsequently, cells were cultured in 24-well dishes (5.0 × 10⁴ cells per well) for 2 hours before transfection. Cells transduced with empty vectors were established as a control group. Transfections were performed with HitransG P (Genechem, China) according to the manufacturer’s protocol (Genechem, China). SU-DHL-2 and SU-DHL-6 cells were selected for the down-regulation and up-regulation experiment by transferring small interfering RNA (siRNA)/mimics.
Quantitative real-time polymerase chain reaction (qRT-PCR)
Total RNA of cells was extracted by TRIzol (CWBIO, China) and sequentially purified via the chloroform, isopropanol, and 70% ethanol. Reverse transcription for miRNA and mRNA relied on an All-in-One™ miRNA qRT-PCR Detection Kit (GeneCopoeia, USA) and a RevertAid First Strand cDNA Synthesis Kit (Thermoscientific, USA), respectively. qRT-PCR was carried out on Applied Biosystems 7500/7500 Fast Real-time PCR System (Thermo Fisher Scientific, USA). The U6 and GADPH were used to normalize miRNA and mRNA samples, respectively. Relative quantification of target primers was calculated by the 2-ΔΔCT method. The experiment was repeated three times. Primers used for qRT-PCR analysis are listed in Table S2.
Western blot analysis
Total protein was extracted by protein extract radio-immunoprecipitation assay (RIPA) from cells. A total of 12 μg protein was separated by 10% sodium lauryl sulphate-polyacrylamide gel electrophoresis (SDS-PAGE) and transferred onto the polyvinylidene fluoride (PVDF) membranes. After 1 hour’s block through 5% DifcoTM Skim Milk at room temperature, the PVDF membranes were incubated with the appropriate primary antibodies at 4°C overnight (CCR6, JAK1, JAK2, STAT3, STAT4, STAT5A, STAT6 and GADPH at 1:500, 1:1000, 1:1000, 1:1000, 1:1000, 1:1000, 1:1000, and 1:3000, respectively). Information on the antibodies used in this study was listed in Table S3. The PVDF membranes were then washed through Tris Buffered Saline with 0.05% Tween-20 (TBST) three times and incubated with the secondary antibody (1:5000) at room temperature for one hour. Finally, the membranes were exposed for quantitative analysis, using GAPDH as an internal reference. All experiments were repeated in triplicate.
Cell proliferation and invasion analysis
Proliferative ability of DLBCL cells was analysed by CCK-8 and colony formation assays. Briefly, as for the CCK-8 assay, 2 × 10³ cells were incubated into the 96‐well plates in 200 μl serum medium. After incubation for 24 hours, the cells were left untreated (blank control), miRNA negative control, miRNA mimic, CCR6 siRNA−, CCR6 siRNA+, miRNA negative control+CCR6 siRNA−, miRNA negative control+CCR6 siRNA+, miR-518a-5p inhibitor+CCR6 siRNA− and miR-518a-5p inhibitor+CCR6 siRNA+ groups for 24, 48, 72 or 96 hours.
CCK-8 from a CCK-8 kit (Dojindo Laboratories, Japanese) was added into each well and incubated at 37 °C for 2 hours. The absorbance was measured at 450 nm using a microplate reader (BioTek, USA). For the colony formation assay, 2 × 10³ DLBCL cells were seeded into the 6 cm‐dishes with 10 ml serum medium at 37°C, 5% CO2 for 10‐14 days. Next, cells were washed with phosphate buffer saline (PBS) multiple times and fixed by 5 ml methyl alcohol for 20 minutes. Colonies were stained with Giemsa and visually counted behind a transparent mash paper. Each experiment was repeated in triplicate.
Transwell assays were performed to examine the invasion of DLBCL cells in vitro. The upper chambers included serum-free RPMI1640 medium and were coated with Matrigel (Corning Incorporated, USA). The lower chambers were filled with RPMI1640 supplemented with 10% FBS. After successful transfection, cells were seeded into upper chambers at a cell density of 5 × 10⁴/mL and cultured at 37°C for 24 hours. The migrated and invaded cells were counted under an inverted microscope (Olympus Corporation, Japan).
Flow cytometry
For apoptosis analysis, DLBCL cells were cultured in vitro and divided into nine groups, including untreated (blank control), miRNA negative control, miRNA mimic, CCR6 siRNA-, CCR6 siRNA+, miRNA negative control+CCR6 siRNA-, miRNA negative control+CCR6 siRNA+, miR-518a-5p inhibitor+CCR6 siRNA- and miR-518a-5p inhibitor+CCR6 siRNA+ groups. Untreated cells and transfected cells were harvested after 72 hours’ transfection and dual-stained with PE Annexin V Apoptosis Detection Kit (BD PharmingenTM, USA) following manufacturer’s instructions. Stained cells were immediately analysed on the same Flow Cytometer (BD PharmingenTM, USA).
For cell cycle analysis, DLBCL cells were cultured in vitro and divided into five groups, including untreated (blank control), miRNA negative control, miRNA mimic, CCR6 siRNA-, CCR6 siRNA+. After 72 hours, the cells were collected, washed with cold PBS and fixed in 75% ethanol overnight at 4°C. Subsequently, the ethanol was removed and the cells were washed with PBS two times and added with 500 μl propidium iodide (PI; BD PharmingenTM, USA) for staining, mixed evenly, and cultured in conditions devoid of light for 30 minutes at 4°C. Finally, flow cytometry (BD PharmingenTM, USA) was used to detect cell cycle.
Dual-luciferase reporter assay
The 3´ UTR segments of CCR6, which were predicted to interact with its targeted miRNAs, were amplified by PCR and cloned to psiCHECK-2 vector (Promega, USA), named wild type (WT) or mutation (MUT) reporters, respectively. Then WT or MUT reporters was co-transfected with 293 T cells in accordance with manufacturer’s instructions (Promega Dual-Luciferase system, Promega, USA). Cells were harvested after 48 h post-transfection. The luciferase activity was detected using the Tanon-1200 gel imaging system (Tanon, China). All experiments were repeated in triplicate.
Methylation-specific polymerase chain reaction (MSP)
The methylation status of CCR6’s targeted miRNAs were investigated in clinical specimens and DLBCL cell lines. Following DNA extraction, bisulphite modification was carried out according to the manufacturer’s instructions (Epitect Bisulphite Kit, QIAGEN, Germany). PCR was carried out using primers specifically for methylated and unmethylated miRNA. The conditions for PCR were one cycle of 94°C for 15 minutes, 43 cycles at 94°C for 30 seconds, 52°C for 30 seconds, and 72°C for 30 seconds, and a final extension at 72°C for 7 minutes. Positive and negative PCR control DNA sets were purchased from QIAGEN, and distilled water served as a blank control. PCR products were analysed by 2% polyacrylamide gel electrophoresis and ethidium bromide staining.
When only a methylated miRNA product was present, miRNA was defined as completely methylated; when only an unmethylated miRNA product was observed, miRNA was defined as completely unmethylated. In addition, when both methylated and unmethylated miRNA products were observed, miRNA was defined as partially methylated.
Pyrophosphate sequencing
Pyrophosphate sequencing was performed to determine whether miRNA expression had an influence on its own promoter methylation. PyroMark Assay Design 2.0 was used to design pyrophosphate sequencing primers. Subsequently, the genomic DNA samples were PCR amplified and the site-specific methylation levels were quantified via pyrosequencing analysis (PyroMark Q96 ID, QIAGEN, Germany).
ChIP
ChIP assays were performed in SU-DHL-2 and SU-DHL-6 cells according to the manufacturer’s protocol (Thermoscientific, USA). The diluted DNA-protein complex was incubated with an equal amount of antibody (Abcam, United Kingdom) or mouse IgG (Abcam, United Kingdom) magnetic beads overnight at 4°C. We adsorbed magnetic beads with a magnetic separation rack, purified the DNA and then analysed by qRT-PCR. The PCR primers for amplifying the promoter region of the CCR6 were as follows: forward: 5´- ACCGCAGATAACGACAATGC −3´;, reverse: 5´- CATGAGCACGTTAAGTCCCG −3´.
Effect of azacitidine and C646 in DLBCL
We also used azacitidine (#AB2385, Sigma, USA), a DNA methyltransferase inhibitor, and C646, (S7152, Selleck, USA), a histone acetyltransferase inhibitor, to validate the epigenetic regulation of CCR6 and its candidate miRNA, respectively. Expression levels of CCR6 and its miRNA in different time periods (0, 12, 24, and 48 h) and concentrations were investigated.
Statistical analysis
All data analyses were performed by the SPSS 20.0 (IBM, USA) and GraphPad Prism 7 (GraphPad Software Inc., USA) software. The continuous data were depicted as mean ± standard deviation and compared by t-test. P < 0.05 was considered as statistical significance. P < 0.01 was considered as obvious statistical significance.
Results
CCR6 expression in DLBCL cells and tissues
To determine the expression of CCR6 in DLBCL cell lines, two cell lines SU-DHL-2 and SU-DHL-6 were firstly used. It was found that CCR6 mRNA and protein levels were significantly higher in DLBCL cell lines than the normal B cell line, HMy2.CIR (ac)). Consistent with the results, an analysis from CCLE showed that CCR6 mRNA expression was elevated in eight other DLBCL cell lines, including SU-DHL-1, SU-DHL-4, SU-DHL-8, SU-DHL-10, OCI-LY3, OCI-LY10, OCI-LY19 and Toledo ()). Among the above DLBCL cell lines, SU-DHL-4, SU-DHL-1, Toledo and OCI-LY19 belong to germinal centre B-cell-like (GCB) lymphoma, while SU-DHL-2, SU-DHL-8, OCI-LY3, and OCI-LY10 are identified as activated B-cell-like (ABC) lymphoma. These results support the hypothesis that CCR6 is markedly overexpressed in DLBCL cell lines.
Figure 1. CCR6 and miR-518a-5p expression levels in DLBCL cell lines and tissues. (a). The expression level of CCR6 was measured in two DLBCL cell lines; (b). Western blot analysis (left) and densitometric analysis (right) for CCR6 in the SU-DHL-2 cell line compared with the normal B cell line HMy2.CIR; (c). Western blot analysis (left) and densitometric analysis (right) for CCR6 in the SU-DHL-6 cell line compared with the normal B cell line HMy2.CIR; (d). CCR6 expression in seven other cell lines from the CCLE database; €. Expression levels of CCR6 in DLBCL samples compared with the control group; (f). ROC analysis for the accuracy of CCR6 in the diagnosis of DLBCL; G. qRT-PCR analysis for miR-518a-5p expression in two DLBCL cell lines compared with the normal B cell line HMy2.CIR; H. qRT-PCR analysis for miR-518a-5p expression levels in DLBCL samples compared with the control group; I. The correlation between miR-518a-5p and CCR6 evaluated by the Pearson correlation test. *P < 0.05 and **P < 0.01
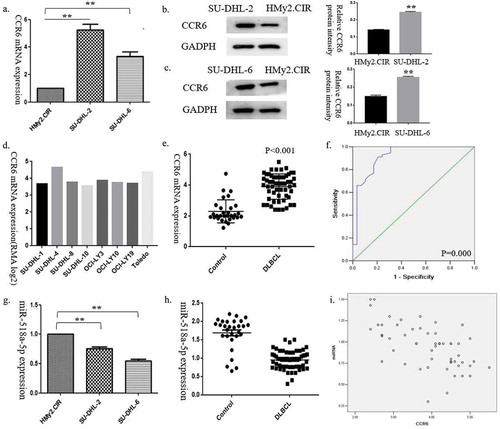
To further confirm the results, an immunohistochemistry analysis of 56 DLBCL samples was performed. Similar to the results of DLBCL cell lines, positive CCR6 staining was observed to be strongly correlated with tumours, not the reactive lymphoid hyperplasia tissues (78.6% vs. 48.3%, p = 0.007). Then, we performed qRT-PCR in patients’ specimens. Results showed that CCR6 mRNA levels were also significantly elevated in DLBCL tissues compared with controls ()). Therefore, it was demonstrated that CCR6 played as a promoter in DLBCL.
Clinical significance of CCR6 in DLBCL
In order to investigate clinical significance of CCR6 in DLBCL, receiver operating characteristic (ROC) curve analysis was performed to evaluate the association between CCR6 mRNA levels and DLBCL. Interestingly, we found that CCR6 might be an effective diagnosis biomarker to differentiate between reactive lymph node hyperplasia and DLBCL, with an area under the curve (AUC) of 0.917 (), P = 0.000).
The median mRNA levels of CCR6 in DLBCL tissues was regarded as the cut-off. CCR6 expression levels were divided into two groups (≥4.1 and <4.1). As shown in , higher expression of CCR6 was observed to be correlated with the presentation of B symptoms (p = 0.047) and worse international prognostic index (IPI) scores (p = 0.029). By contrast, CCR6 expression levels were not correlated with other clinicopathological parameters, including gender, age, subtypes, clinical stages and first-line treatment response.
Table 1. The correlation between CCR6 expression and clinicopathological features in DLBCL
miRNA prediction
The targeted miRNAs of CCR6 were predicted through TargetScan [Citation14], miRWalk [Citation15], StarBase [Citation16], miRDB [Citation17], miRTarBase [Citation18] and DIANA-microT [Citation19]. Overlapping miRNAs predicted by at least five prediction programmes were identified for further analysis, i.e. hsa-miR-129-5p, hsa-miR-518a-5p and hsa-miR-6879-3p. Among the miRNAs, only miR-518a-5p exhibited much lower expression levels in DLBCL cell lines than the HMy2.CIR cell line (), p < 0.001). QRT-PCR analysis displayed a similar result in DLBCL tissues (), p < 0.001), suggesting that CCR6 might be targeted by miR-518a-5p and miR-518a-5p might play an important role in DLBCL.
Clinical significance of miR-518a-5p in DLBCL
The clinical value of miR-518a-5p was validated using a Pearson correlation analysis between expression levels of miR-518a-5p and CCR6 in DLBCL samples. As shown in ), a significantly negative correlation was detected (the Pearson correlation coefficient was −0.597, p = 0.000), that is, miR-518a-5p expression levels were significantly reduced in DLBCL with high CCR6 expression.
The median levels of miR-518a-5p in DLBCL tissues were regarded as the cut-off. Then miR-518a-5p expression levels were divided into two groups (≥0.98 and <0.98). However, as shown in , miR-518a-5p expression levels were not observed to be correlated with DLBCL clinicopathological parameters. Even so, these results supported the hypothesis that miR-518a-5p is markedly inhibited in DLBCL and miR-518a-5p as a post-transcriptional repressor might regulate CCR6 expression.
Table 2. The correlation between miR-518a-5p expression and clinicopathological features in DLBCL
A negative regulatory feedback loop between miR-518a-5p and CCR6 in DLBCL
Motivated by the above observation that negative correlation existed between miR-518a-5p and CCR6 expression levels in DLBCL tissues, we continued to investigate the correlation between miR-518a-5p and CCR6 in vitro. As shown in (ab), CCR6 could be partially reversed in SU-DHL-2 and SU-DHL-6 cells transfected with miR-518a-5p mimic, while CCR6 knockdown activated miR-518a-5p in DLBCL cells ()). Since our results showed that the expression of miR-518a-5p is regulated by CCR6, we hypothesized that miR-518a-5p and CCR6 may reciprocally regulate each other. To test this, we searched for the targeted binding site between miR-518a-5p and 3ʹUTR of CCR6 mRNA using the MicroRNA.org online prediction (http://www.microrna.org/microrna/home.do, )). Dual luciferase assay revealed that miR-518a-5p mimic transfection significantly declined the relative luciferase activity of CCR6, indicating the regulatory relationship between miR-518a-5p and CCR6 ()). Thus, these findings indicated that miR-518a-5p and CCR6 formed a negative regulatory feedback loop in DLBCL.
Figure 2. A negative regulatory feedback loop between miR-518a-5p and CCR6 in DLBCL. (a). qRT-PCR (left) and western blot analysis (middle and right) of CCR6 for the efficiency of miR-518a-5p overexpression in SU-DHL-2 cells; (b). qRT-PCR (left) and western blot analysis (middle and right) of CCR6 for the efficiency of miR-518a-5p overexpression in SU-DHL-6 cells; (c). qRT-PCR analysis of miR-518a-5p for the efficiency of CCR6 knockdown in both SU-DHL-2 and SU-DHL-6 cells; D. The binding site between miR-518a-5p and the 3ʹ-UTR of CCR6 mRNA (upper) as well as the result of dual luciferase assay (lower). *P < 0.05 and **P < 0.01
The role of miR-518a-5p and CCR6 in the proliferation and invasion of DLBCL cells
Based on the above experimental data of miR-518a-5p and CCR6, we speculated that both miR-518a-5p and CCR6 played an important role in DLBCL tumorigenesis. To investigate this assumption, we enhanced miR-518a-5p or suppressed CCR6 expression levels in SU-DHL-2 and SU-DHL-6 cells. Then CCK-8 assays were applied to determine the effects of miR-518a-5p and CCR6 on DLBCL cell proliferation. Results showed that the proliferation ability of SU-DHL-2 and SU-DHL-6 cells was decreased via miR-518a-5p overexpression or CCR6 knockdown ()). In agreement with the CCK-8 assay, colony amounts of DLBCL cells were notably decreased with the transient transfection of CCR6 siRNA compared with those in the negative control group, and vice versa in DLBCL miR-518a-5p mimic/negative control cells ()).
Figure 3. MiR-518a-5p/CCR6 accelerates DLBCL cell proliferation and invasion in vitro. (a). The proliferative ability of DLBCL miR-518a-5p mimic/negative control (left) cells and DLBCL CCR6 inhibitor/negative control (right) cells was measured via the CCK-8 assay; (b). The SU-DHL-2 and SU-DHL-6 cells with miR-518a-5p mimic or CCR6 inhibitor transfection were subjected to the colony formation assay; (c). The cell apoptosis of SU-DHL-2 CCR6 inhibitor/negative control (upper) cells and SU-DHL-6 CCR6 inhibitor/negative control (lower) cells was measured through flow cytometry analysis; (d). The cell apoptosis of SU-DHL-2 miR-518a-5p mimic/negative control (upper) cells and SU-DHL-6 miR-518a-5p mimic/negative control (lower) cells was measured through flow cytometry analysis; (e). The cell cycle of SU-DHL-2 CCR6 inhibitor/negative control (upper) cells and SU-DHL-6 CCR6 inhibitor/negative control (lower) cells was measured through flow cytometry analysis; (f). The invasion ability of SU-DHL-2 CCR6 inhibitor/negative control (upper) cells and SU-DHL-6 CCR6 inhibitor/negative control (lower) cells was measured through the Transwell assay; (g). The invasion ability of SU-DHL-2 miR-518a-5p mimic/negative control (upper) cells and SU-DHL-6 miR-518a-5p mimic/negative control (lower) cells was measured through the Transwell assay; (h). The proliferative capacity of SU-DHL-2 miR-518a-5p inhibitor/negative control cells with co-transfection of the CCR6 inhibitor was indicated by CCK-8; (i). The invasion capacity of SU-DHL-2 miR-518a-5p inhibitor/negative control cells with co-transfection of the CCR6 inhibitor was indicated via the Transwell assay; (j). The proliferative capacity of SU-DHL-2 miR-518a-5p inhibitor/negative control cells with co-transfection of the CCR6 inhibitor was indicated through the colony formation assay; (k). The cell apoptosis of SU-DHL-2 miR-518a-5p inhibitor/negative control cells with co-transfection of the CCR6 inhibitor was measured through flow cytometry analysis. The data were represented as the means ± standard deviation of three independent experiments. *P < 0.05 and **P < 0.01
Cell apoptosis analysis through flow cytometry exhibited that knockdown of CCR6 resulted in a remarkable rise in cell apoptosis ()). Similar conclusions were reached in SU-DHL-2 and SU-DHL-6 cells with miR-518a-5p overexpression ()). Significant changes in the G1 and S cycles appeared in cells by transferring CCR6 siRNA ()), indicating that knockdown of CCR6 limited DLBCL cell proliferation through its stimulatory effect on both apoptosis and cell cycle arrest. However, no significant changes in cell cycle were found in miR-518a-5p mimic-treated DLBCL cells, suggesting the DLBCL cell proliferation limitation only relied on its stimulatory effect on apoptosis.
Furthermore, we performed transwell assays to investigate the invasion capability of DLBCL cells with CCR6 downregulation or miR-518a-5p overexpression. It was indicated that both knockdown of CCR6 and overexpression of miR-518a-5p significantly inhibited invasion in DLBCL cells ((fg)). These results support miR-518a-5p and CCR6 participate in the invasion of DLBCL cells in vitro.
In order to further elaborate the post transcriptional regulation of miR-518a-5p, we proceeded to explore whether the decreased proliferative and invasive capabilities by CCR6 siRNA could be restored through miR-518a-5p repression compared with those in the negative control group. As shown in ), decreased proliferation caused by the CCR6 inhibitor was partially abolished by miR-518a-5p repression in an CCK-8 assay. Similar to the CCK-8 assay, the diminished colony amounts of DLBCL cells induced by the CCR6 inhibitor was partially strengthened by co-transfected with miR-518a-5p siRNA ()). Cell apoptosis analysis through flow cytometry exhibited that co-transfection with the CCR6 and miR-518a-5p inhibitor resulted in a remarkable fall in cell apoptosis rates compared with the CCR6 inhibitor group ()), suggesting that miR-518a-5p regulated CCR6 to affect cell apoptosis and promote cell proliferation. Additionally, knockdown of miR-518a-5p could reverse the CCR6 siRNA-mediated inhibition of cell invasion in the Transwell assay ()). Taken together, these data verify the inhibitory effect of miR-518a-5p on CCR6 in vitro.
The influence of miR-518a-5p and CCR6 in JAK-STAT signalling pathway
To investigate the modulation that miR-518a-5p/CCR6 mediated cell proliferation and invasion in DLBCL cells, we speculated that miR-518a-5p and CCR6 were related to the classical signal pathways. Motivated by KEGG pathways of CCR6 ()) and the critical role of the JAK-STAT pathway in lymphoma [Citation23,Citation24], we tested JAK1-2, STAT3-6 in DLBCL cells transfected with miR-518a-5p mimic and CCR6 siRNA, respectively. As shown in (be), both JAK2 and STAT6 were effectively decreased compared with the negative control group at mRNA and protein levels, suggesting that miR-518a-5p/CCR6 regulated DLBCL cell proliferation, invasion, apoptosis and cell cycle arrest through targeting JAK2-STAT6 signalling pathway.
Figure 4. Up-regulation of miR-518a-5p and down-regulation of CCR6 attenuated JAK2-STAT6 signalling pathway activity. (a). The KEGG pathway of CCR6; (b). qRT-PCR analysis of JAK1-2, STAT3-6 mRNA expression in miR-518a-5p mimic/negative control SU-DHL-2 (left) and SU-DHL-6 (right) cells; (c). Western blot analysis and densitometric analysis of JAK2 and STAT6 in miR-518a-5p mimic/negative control SU-DHL-2 and SU-DHL-6 cells; (d). qRT-PCR analysis of JAK1-2, STAT3-6 mRNA expression in CCR6 inhibitor/negative control SU-DHL-2 (left) and SU-DHL-6 (right) cells; (e). Western blot analysis and densitometric analysis of JAK2 and STAT6 in CCR6 inhibitor/negative control SU-DHL-2 and SU-DHL-6 cells. *P < 0.05 and **P < 0.01
The mechanism underlying the abnormal expression of miR-518a-5p in DLBCL
Methylation rates of miR-518a-5p in DLBCL tissues and cell lines
According to our former observation that miR-518a-5p was significantly restrained in DLBCL cell lines and tumour tissues, we hypothesized that a potential inhibiting factor existed during the transcription of miR-518a-5p in DLBCL tumorigenesis. Since methylation is implicated in various tumour suppressor miRNAs, we detected methylation levels not only in DLBCL tissues, but also in miR-518a-5p mimic DLBCL cells through MSP. Primers used for MSP analysis are listed in Table S4.
As shown in , 64.3% tumour tissues from DLBCL patients existed hyper-methylation for miR-518a-5p, including 8 complete methylation and 28 partial methylation, while there were only 2 patients revealing hyper-methylation in the control group. Similar results of MSP for the miR-518a-5p promoter are detected in DLBCL cells (), further indicating a hyper-methylated condition in the miR-518a-5p promoter in DLBCL.
Figure 5. MiR-518a-5p is under the regulation of methylation in DLBCL cells. (a). Different methylation levels existed on the miR-518a-5p promoter region between DLBCL tissues and reactive lymphoid hyperplasia; (b). Methylation analysis of miR-518a-5p through MSP in SU-DHL-2 (upper) and SU-DHL-6 (lower) cells; (c). Methylation levels of two CpG sites on the miR-518a-5p promoter region were examined via pyrosequencing analysis in SU-DHL-2 (left) and SU-DHL-6 (right) cells; (d). Relative miR-518a-5p expression levels determined by Control/Azacitidine in SU-DHL-2 and SU-DHL-6 cells; (e). Different concentrations (0, 2, 4, 6 μmol/L) and times (0, 12, 24, 48 h) were applied to determine the effects of Azacitidine on miR-518a-5p expression in DLBCL cells; (f). The mRNA levels of CCR6 in SU-DHL-2 and SU-DHL-6 cells when treated with Azacitidine/Control; (g). Western blot analysis and densitometric analysis of CCR6 in SU-DHL-2 (upper) and SU-DHL-6 (lower) cells when treated with Azacitidine/Control. The data are shown as the means±standard deviation of three independent experiments. *P < 0.05 and **P < 0.01
The influence of miR-518a-5p expression on its own promoter methylation
To validate the relationship between miR-518a-5p expression and miR-518a-5p’s promoter methylation, SU-DHL-2 and SU-DHL-6 cells were transfected with miRNA negative control and miR-518a-5p mimic, respectively. Pyrosequencing analysis of the miR-518a-5p promoter region was then performed in the above two DLBCL cell lines. As shown in ), compared with the negative control group, methylation levels of the CpG_3 site were decreased in miR-518a-5p mimic DLBCL cells, indicating the methylated level of the CpG_3 site was negatively correlated with miR-518a-5p expression in DLBCL.
The influence of azacitidine on miR-518a-5p expression in DLBCL cell lines
We also used azacitidine, a DNA methyltransferase inhibitor, to verify the mechanism of miR-518a-5p regulation. We treated SU-DHL-2 and SU-DHL-6 cells with azacitidine (6 μmol/L) for 48 hours and measured the expression levels of miR-518a-5p. As shown in ), azacitidine notably relieved transcription inhibition and promoted miR-518a-5p expression in both SU-DHL-2 and SU-DHL-6 cells. Additionally, when exposed to azacitidine for different time periods (0, 12, 24, and 48 h) or concentrations (0, 2, 4, and 6 μmol/L), the levels of miR-518a-5p in SU-DHL-2 and SU-DHL-6 cells gradually increased in a time- and dose-dependent manner ()). By contrast, the mRNA and protein levels of CCR6 were dramatically reduced in SU-DHL-2 and SU-DHL-6 cells ((fg)). These findings were not only consistent with the results of previous MSP and pyrosequencing analysis, but also demonstrated the mechanism underlying the overexpression of CCR6 in DLBCL from post-transcriptional regulation. Furthermore, epigenetic modification might be effective and important for DLBCL, especially in light of introduction of epigenetic inhibitors into clinical practice of DLBCL.
The mechanism underlying the overexpression of CCR6 in DLBCL
To detect the mechanisms contributed to the abnormal expression of CCR6 in DLBCL, we firstly searched cBioPortal (http://www.cbioportal.org/) to investigate the frequency of genetic alteration in CCR6 in DLBCL patients. Among the five included datasets [Citation25–29], CCR6 only had a genetic alteration in 2 of 1295 DLBCL cases, accounting for less than 0.1% of cases. The frequency of genetic alteration in CCR6 is very low, suggesting that epigenetic regulation mainly contribute to abnormal expression of CCR6 in DLBCL patients.
From UCSC, it is found that histone H3 on lysine 27 acetylation (H3 K27ac) enrichment exists at the CCR6 promoter region. Then we performed H3K27ac enrichment analysis in the CCR6 promoter through the Cistrome Data Browser. As ) showed, enrichment of H3K27ac in the promoter region of CCR6 was involved in OCI-LY1, OCI-LY7, SU-DHL-6 and OCI-LY3 cells. It is suggested that histone H3K27ac may be involved in the transcriptional regulation of CCR6.
Figure 6. H3K27ac in the promoter of CCR6 promotes CCR6 transcription. (a). Enrichment analysis of H3K27Ac in CCR6 promoter in DLBCL cell lines through Cistrome Data Browser; (b). Different concentrations (0, 4, 8 μmol/L) and times (0, 12, 24, 48 h) were applied to determine the effects of C646 on the CCR6 expression in DLBCL cells; (c). Alteration of H3K27ac enrichment in CCR6 promoter in SU-DHL-2 (left) and SU-DHL-6 (right) cell line after C646 treatment

Next, the transcriptional regulation of histone acetylation in CCR6 was determined by treating SU-DHL-2 and SU-DHL-6 cell lines with C646, a histone acetyltransferase inhibitor. This treatment resulted in a significantly decreased expression of CCR6 mRNA in a time- and dose-dependent manner ()). This change was further verified by ChIP in DLBCL cell lines. After C646 treatment, as the inhibitor concentration increased, the concentration of H3K27ac bound to the promoter region of CCR6 decreased ()). Taken together, we concluded that H3K27ac in the promoter of CCR6 increases the transcription of CCR6 in DLBCL.
Discussion
Chemokine and their receptors are important molecules in the regulation of cancer progression, including DLBCL [Citation3]. Clinical studies have shown that CCR1, CXCR5, CCL18, and CXCL12 may be useful for DLBCL detection and classification [Citation30–34]. In our study, we verified the role of CCR6 in DLBCL for the first time. Our results showed that CCR6 was significantly elevated in DLBCL and higher expression of CCR6 correlated with the presentation of B symptoms and worse IPI scores. Further studies detected down-regulated CCR6 suppressed the proliferation and invasion capabilities of DLBCL cells through inducing the G1 cell cycle arrest and promoting their apoptosis. In this regard, we have reasons to speculate CCR6 plays a critical role in DLBCL.
As we know, mRNAs are usually regulated by their targeted miRNAs from post-transcriptional regulation. Several potential target miRNAs of CCR6 were predicted by bioinformatics analysis. Among these miRNAs, only miR-518a-5p showed much lower expression levels in DLBCL than the control group. Thus we hypothesized that CCR6 was the functional target of miR-518a-5p in DLBCL. According to the clinical data, the negative expression correlation between miR-518a-5p and CCR6 was concluded. CCR6 could be partially reversed in DLBCL cells transfected with miR-518a-5p mimic. Functional experiments demonstrated miR-518a-5p suppressed cell proliferation, invasion and promoted apoptosis in DLBCL.
Based on the above finding, i.e., miR-518a-5p acts as the functional target and a post-transcriptional repressor of CCR6, we need to find out how CCR6/miR-518a-5p affects DLBCL development. To solve this problem, CCR6’s downstream JAK-STAT signalling pathways were investigated. We revealed that levels of JAK2 and STAT6 were decreased in DLBCL cells transfected with miR-518a-5p mimic or CCR6 siRNA. Similar result has been reached by Hao et al. [Citation35], who reported chemical JAK2 inhibition decreased the cellular proliferation of classical Hodgkin lymphoma (cHL) and primary mediastinal large B-cell lymphoma (MLBCL) cell lines and induced their apoptosis. Further study demonstrated that chemical JAK2 inhibition decreased phosphorylation of JAK2, STAT1, STAT3, and STAT6 and reduced the expression of additional downstream targets, including PD-L1 in vivo and in vitro [Citation35]. Miloudi et al. [Citation36] found that primary mediastinal B-cell lymphoma (PMBL) cells are characterized by several genetic abnormalities that conduct to the constitutive activation of JAK2/STAT6 signalling pathway. Since JAK2 is mainly activated by phosphorylation in lymphoma cases [Citation37], we speculate miR-518a-5p/CCR6 plays an important role in activating the JAK2-STAT6 signalling pathway and then promoting DLBCL development.
Epigenetics plays an important role in gene transcriptional regulation and the destruction of epigenetic mechanisms is closely related to tumorigenesis. In the present study, we showed for the first time that miR-518a-5p was forced to be inhibited due to high enrichment of methylation at its promoter region. The higher degree of methylation, the lower the miR-518a-5p expression, which can be partially reversed in the presence of azacitibine in DLBCL cells. Meanwhile, we verified the role of H3K27ac in regulating CCR6 expression in DLBCL cells, CCR6 was up-regulated in DLBCL due to enrichment of H3K27ac in its promoter, which can be partially reversed in the presence of C646. Since azacitibine could affect both miR-518a-5p and CCR6 expression, it was considered that the overexpression of CCR6 was mainly mediated by epigenetic modification through transcriptional and post-transcriptional activation, i.e., levels of CCR6 was regulated by both histone acetylation and miR-518a-5p methylation. Additionally, in view of the ubiquitous nature of the chemokine/chemokine receptor network makes it difficult to target; the research of nano-drug carriers is still immature, regulating tumour related genes through epigenetic modification is supposed to be effective and important, especially in light of introducing epigenetic inhibitors into clinical practice.
Interestingly, it was found that in DLBCL cell lines, artificial CCR6 downregulation by transfection led to significantly increased expression of miR-518a-5p. Thus we hypothesized that miR-518a-5p and CCR6 can constitute a negative feedback loop in DLBCL. To validate our hypothesis, we applied bioinformatics analysis and mechanism experiments. We uncovered that miR-518a-5p regulated the expression of a luciferase construct containing the 3´UTR of CCR6. Therefore, it is concluded that the miR-518a-5p-CCR6 negative feedback loop exists in DLBCL. Based on this observation, it is reasonable to speculate miR-518a-5p partially reversed the biological function of CCR6, and vice versa. We also hypothesized both miR-518a-5p and CCR6 levels could be changed in DLBCL when exposed to azacitibine and C646, respectively, i.e., the abnormal expression of miR-518a-5p and CCR6 might be regulated through both miR-518a-5p hyper-methylation and CCR6 acetylation. However, in this study we have well described the inhibitory effect of miR-518a-5p on CCR6. The inhibitory effect of CCR6 on miR-518a-5p required further verification in the future.
In conclusion, the present study is the first to reveal the role of CCR6 and its targeted miRNA in DLBCL. Their clinical significance and functions were assessed (). Moreover, it is revealed that epigenetic mechanisms play a critical role in DLBCL. As shown in , overexpression of CCR6 in DLBCL is mediated by histone H3K27 acetylation and miR-518a-5p methylation. Furthermore, the study is the first to report the negative feedback loop between CCR6 and miR-518a-5p. Thus this study not only provides new markers, but also new directions for DLBCL treatment, especially when studies of chemokine/chemokine receptor targeting drugs are not satisfactory. Meanwhile, this study provides a theoretical basis for the combination of two epigenetic inhibitors in DLBCL. However, the mechanisms underlying the observation that CCR6 inhibits miR-518a-5p need further research in the future. The translational and post-translational regulation of CCR6 are also required. Anyway, the miR-518a-5p-CCR6 feedback loop plays a critical role in promoting aggressive biological behaviours of DLBCL. The abnormal expression of CCR6 is mainly mediated by epigenetic modification through transcriptional and post-transcriptional activation, which then activates the JAK2-STAT6 signalling pathway and promotes DLBCL progression. Our results may serve as a reference for future lymphoma research in epigenetics.
Figure 7. A schematic diagram is used to illuminate regulation in our study. MiR-518a-5p was forced to be inhibited due to high enrichment of DNA methylation on its promoter region, which can be partially reversed in the presence of azacitibine in DLBCL cells. In view of the negative feedback loop between miR-518a-5p and CCR6, the enhanced levels of CCR6 in DLBCL is due to the methylation regulation of miR-518a-5p and histone H3K27 acetylation at the CCR6 promoter region. Down-regulated miR-518a-5p and up-regulated CCR6 activates the JAK2-STAT6 signalling pathway to promote the proliferation and invasion of DLBCL cells, indicating an important role of the miR-518a-5p-CCR6 feedback loop in DLBCL

Ethical approval
This article does not contain any studies with animals.S
Supplemental Material
Download MS Word (23.7 KB)Acknowledgments
This work was supported through funds provided by several projects. The authors thank all anonymous reviewers for their time, comments, and constructive criticism.
Disclosure statement
The authors declare that they have no conflict of interest.
Supplementary material
Supplemental data for this article can be accessed here.
Additional information
Funding
References
- Siegel RL, Miller KD, Jemal A. Cancer statistics, 2019. CA Cancer J Clin. 2019;69:7–34.
- Nagarsheth N, Wicha MS, Zou W. Chemokines in the cancer microenvironment and their relevance in cancer immunotherapy. Nat Rev Immunol. 2017;17(9):559–572.
- Huang Q, Liu F, Shen J. The significance of chemokines in diffuse large B-cell lymphoma: a systematic review and future insights. Future Oncol. 2019;15(12):1385–1395.
- Huang Q, Liu F, Shen J. Bioinformatic validation identifies candidate key genes in diffuse large-B cell lymphoma. Per Med. 2019;16(4):313–323.
- Ito T, Carson WF, Cavassani KA, et al. CCR6 as a mediator of immunity in the lung and gut. Exp Cell Res. 2011;317:613–619.
- Zhu CC, Chen C, Xu ZQ, et al. CCR6 promotes tumor angiogenesis via the AKT/NF-κB/VEGF pathway in colorectal cancer. Biochim Biophys Acta Mol Basis Dis. 2018;1864(2):387–397. .
- Lu E, Su J, Zhou Y, et al. CCL20/CCR6 promotes cell proliferation and metastasis in laryngeal cancer by activating p38 pathway. Biomed Pharmacother. 2017;85:486–492.
- Coperchini F, Croce L, Marinò M, et al. Role of chemokine receptors in thyroid cancer and immunotherapy. Endocr Relat Cancer. 2019;26(8):R465–R478. .
- Nishimura T, Fabian MR. Scanning for a unified model for translational repression by microRNAs. Embo J. 2016;35(11):1158–1159.
- Garcia-Gomez A, Rodríguez-Ubreva J, Ballestar E. Epigenetic interplay between immune, stromal and cancer cells in the tumor microenvironment. Clin Immunol. 2018;196:64–71.
- Mazzoccoli L, Robaina MC, Apa AG, et al. MiR-29 silencing modulates the expression of target genes related to proliferation, apoptosis and methylation in Burkitt lymphoma cells. J Cancer Res Clin Oncol. 2018;144(3):483–497. .
- Go H, Jang JY, Kim CW, et al. Identification of microRNAs modulated by DNA hypomethylating drugs in extranodal NK/T-cell lymphoma. Leuk Lymphoma. 2019;23:1–9.
- Wang QM, Lian GY, Song Y, et al. Downregulation of miR-152 contributes to DNMT1-mediated silencing of SOCS3/SHP-1 in non-Hodgkin lymphoma. Cancer Gene Ther. 2019;26(7–8):195–207. .
- Agarwal V, Bell GW, Nam JW, et al. Predicting effective microRNA target sites in mammalian mRNAs. Elife. 2015;4:e05005.
- Sticht C, De La Torre C, Parveen A, et al. miRWalk: an online resource for prediction of microRNA binding sites. PLoS One. 2018;13(10):e0206239.
- Li JH, Liu S, Zhou H, et al. starBase v2.0: decoding miRNA-ceRNA, miRNA-ncRNA and protein-RNA interaction networks from large-scale CLIP-Seq data. Nucleic Acids Res. 2014;42(Database issue):D92–D97.
- Liu W, Wang X. Prediction of functional microRNA targets by integrative modeling of microRNA binding and target expression data. Genome Biol. 2019;20(1):18.
- Chou CH, Shrestha S, Yang CD, et al. miRTarBase update 2018: a resource for experimentally validated microRNA-target interactions. Nucleic Acids Res. 2018;46(D1):D296–D302. .
- Paraskevopoulou MD, Georgakilas G, Kostoulas N, et al. DIANA-microT web server v5.0: service integration into miRNA functional analysis workflows. Nucleic Acids Res. 2013;41(Web Server issue):W169–W173. .
- Ghandi M, Huang FW, Jané-Valbuena J, et al. Next-generation characterization of the cancer cell line encyclopedia. Nature. 2019;569(7757):503–508. .
- Mei S, Qin Q, Wu Q, et al. Cistrome data browser: a data portal for ChIP-Seq and chromatin accessibility data in human and mouse. Nucleic Acids Res. 2017;45(D1):D658–D662. .
- Casper J, Zweig AS, Villarreal C, et al. The UCSC Genome Browser database: 2018 update. Nucleic Acids Res. 2018;46(D1):D762–D769. .
- Karmali R, Gordon LI. Molecular subtyping in diffuse large B cell lymphoma: closer to an approach of precision therapy. Curr Treat Options Oncol. 2017;18:11.
- Aoki-Kinoshita KF, Kanehisa M. Gene annotation and pathway mapping in KEGG. Methods Mol Biol. 2007;396:71–91.
- Chapuy B, Stewart C, Dunford AJ, et al. Molecular subtypes of diffuse large B cell lymphoma are associated with distinct pathogenic mechanisms and outcomes. Nat Med. 2018;24(5):679–690. .
- Lohr JG, Stojanov P, Lawrence MS, et al. Discovery and prioritization of somatic mutations in diffuse large B-cell lymphoma (DLBCL) by whole-exome sequencing. Proc Natl Acad Sci U S A. 2012;109(10):3879–3884. .
- Reddy A, Zhang J, Davis NS, et al. Genetic and functional drivers of diffuse large B cell lymphoma. Cell. 2017;171(2):481–494. .
- Morin RD, Mungall K, Pleasance E, et al. Mutational and structural analysis of diffuse large B-cell lymphoma using whole-genome sequencing. Blood. 2013;122(7):1256–1265. .
- Hoadley KA, Yau C, Hinoue T, et al. Cell-of-origin patterns dominate the molecular classification of 10,000 tumors from 33 types of cancer. Cell. 2018;173(2):291–304. .
- Luo X, Shi F, Qiu H, et al. Identification of potential key genes associated with diffuse large B-cell lymphoma based on microarray gene expression profiling. Neoplasma. 2017;64(6):824–833.
- Song H, Tong D, Cha Z, et al. C-X-C chemokine receptor type 5 gene polymorphisms are associated with non-Hodgkin lymphoma. Mol Biol Rep. 2012;39(9):8629–8635.
- Charbonneau B, Wang AH, Maurer MJ, et al. CXCR5 polymorphisms in non-Hodgkin lymphoma risk and prognosis. Cancer Immunol Immunother. 2013;62(9):1475–1484. .
- Recasens-Zorzo C, Cardesa-Salzmann T, Petazzi P, et al. Pharmacological modulation of CXCR4 cooperates with BET bromodomain inhibition in diffuse large B-cell lymphoma. Haematologica. 2019;104(4):778-788.
- Zhou Q, Huang L, Gu Y, et al. The expression of CCL18 in diffuse large B cell lymphoma and its mechanism research. Cancer Biomark. 2018;21(4):925–934.
- Hao Y, Chapuy B, Monti S, et al. Selective JAK2 inhibition specifically decreases Hodgkin lymphoma and mediastinal large B-cell lymphoma growth in vitro and in vivo. Clin Cancer Res. 2014;20(10):2674–2683.
- Miloudi H, Leroy K, Jardin F, et al. STAT6 is a cargo of exportin 1: biological relevance in primary mediastinal B-cell lymphoma. Cell Signal. 2018;46:76–82.
- Derenzini E, Younes A. Targeting the JAK-STAT pathway in lymphoma: a focus on pacritinib. Expert Opin Investig Drugs. 2013;22(6):775–785.