
ABSTRACT
Dynamic modifications of chromatin allow rapid access of the gene regulatory machinery to condensed genomic regions facilitating subsequent gene expression. Inflammatory cytokine stimulation of cells can cause rapid gene expression changes through direct signalling pathway-mediated transcription factor activation and regulatory element binding.
Here we used the Assay for Transposase Accessible Chromatin with high-throughput sequencing (ATAC-seq) to assess regions of the genome that are differentially accessible following treatment of cells with interleukin-1 (IL-1). We identified 126,483 open chromatin regions, with 241 regions significantly differentially accessible following stimulation, with 64 and 177 more or less accessible, respectively. These differentially accessible regions predominantly correspond to regions of the genome marked as enhancers. Motif searching identified an overrepresentation of a number of transcription factors, most notably RelA, in the regions becoming more accessible, with analysis of ChIP-seq data confirmed RelA binding to these regions. A significant correlation in differential chromatin accessibility and gene expression was also observed.
Functionality in regulating gene expression was confirmed using CRISPR/Cas9 genome-editing to delete regions that became more accessible following stimulation in the genes MMP13, IKBKE and C1QTNF1. These same regions were also accessible for activation using a dCas9-transcriptional activator and showed enhancer activity in a cellular model.
Together, these data describe and functionally validate a number of dynamically accessible chromatin regions involved in inflammatory signalling.
Introduction
A dynamic epigenetic code consisting of histone modifications and nucleosome positioning, as well as other modifications such as DNA methylation, functions to allow, or to prevent, access by transcriptional regulatory machinery to this chromatin [Citation1,Citation2]. DNA methylation is a well characterized epigenetic mark, but generally only transcriptional enhancer levels of methylation correlate well with gene expression [Citation3] and DNA methylation changes are not considered dynamic [Citation4]. In contrast, dynamic modifications of chromatin can rapidly allow access of condensed genomic regions to gene regulatory machinery. These chromatin modifications can occur either via covalent histone modifying enzymes, such as histone acetyltransferases or methyltransferases, or by ATP-dependent chromatin remodelling complexes, such as SWI/SNF, which are capable of altering the position of nucleosomes along DNA [Citation5,Citation6]. Genome-wide methods for examining chromatin modification (e.g. ChIP-seq) or chromatin accessibility (e.g. DNase-Seq) have provided detailed information on regulatory regions of the genome however, although powerful, such techniques often require millions of cells and complex, time-consuming, sample preparation. Recently, the Assay for Transposase Accessible Chromatin with high-throughput sequencing (ATAC-seq) method has gained popularity due to its simplicity and low cell number requirement [Citation7].
The pro-inflammatory cytokine interleukin-1 (IL-1) plays a critical role in host responses to pathogens and other harmful agents. To activate cellular responses IL-1 binds to its cognate receptor, IL1R1, which heterodimerises with the common co-receptor IL1RAcP [Citation8,Citation9]. This tertiary complex then recruits intracellular signalling molecules, including myeloid differentiation factor 88 (MyD88), IL1R-associated kinase (IRAK) and TNF receptor-associated factor 6 (TRAF6) to elicit its cellular response via activation of nuclear factor-κB (NF-κB), as well as mitogen-activated protein kinases (MAPK) p38, c-Jun N-terminal kinase (JNK) and extracellular signal-regulated kinase (ERK) pathways [Citation10,Citation11]. Given the importance of interleukin signalling a number of clinical syndromes are genetically-associated with a dysregulation of the pathway, while IL-1-related cytokine inhibitors are clinically relevant, especially for a number of auto-inflammatory disorders [Citation12].
While tissue-specific chromatin accessibility patterns are well documented, the more immediate changes in chromatin accessibility in response to cell activation or signalling are only beginning to be elucidated [Citation1,Citation13,Citation14]. Chromatin dynamics have been revealed by either DNase I or micrococcal nuclease digestion followed by sequencing in cells undergoing stimulation by oestrogen or TNFα [Citation15,Citation16]. Stimulation of murine macrophages with IL-1β, amongst other stimuli, altered acetylation at ~4000 enhancer regions [Citation17]. While stimulation of epithelial cells with IL-1 identified active enhancer regions with NF-κB binding and increased histone acetylation [Citation18]. NF-κB activated by TNFα-induced signalling has also been associated with active chromatin regions undergoing remodelling [Citation15,Citation19]. More recently, ATAC-seq has been used to identify chromatin accessibility changes between resting and stimuli-activated immune cells [Citation20,Citation21], while Weiterer et al. determined IL-1α responsive enhancers in HeLa-derived KB cells [Citation22].
Here, we used ATAC-seq to establish dynamic changes in chromatin accessibility following short-term IL-1 stimulation. We identified 241 regions which are rendered significantly differentially accessible by the cytokine treatment, and these are enriched distal from promoters, at ENCODE/Roadmap defined enhancer regions. As anticipated, genomic regions that become accessible during the stimulation are significantly enriched for NF-κB (RelA) binding motifs and correlate with gene expression changes following stimulation. We confirmed the function of several of these putative enhancers in regulating IL-1-dependent gene expression following CRISPR/Cas9-mediated genomic deletion. Similarly, using a dCas9-transcriptional activator (dCas9-VPR), gRNAs to these regions could potentiate IL-1-induced target gene expression. Finally, we tested the response of these enhancers to IL-1 in vitro using luciferase reporters. Together, these data define a number of novel, dynamic, inflammatory signalling-dependent enhancer loci.
Materials and methods
Cell culture
SW1353 chondrosarcoma cells (ATCC, LGC Standards, Teddington, UK) were cultured as previously described [Citation23]. As with SW1353, HEK 293 T cells were cultured in DMEM. HEK 293 T were transfected using FugeneHD (Promega, Southampton, UK) with plasmids lentiCRISPR v2 or lenti-EF1a-dCas9-VPR-Puro, plus packaging plasmids psPAX2 and pCMV-VSV-G (Addgene plasmids #52,961, #99,373, #12,260, and # 8454, respectively). After 48 and 72 hr lentivirus was harvested by centrifugation. SW1353 cells were lentivirus transduced and puromycin-selected to generate SW1353-Cas9 cells, stably expressing Cas9, or SW1353-VPR, expressing dCas9-VPR.
ATAC-seq
SW1353-Cas9 cells (30,000/cm2) were seeded in a 6-well plate, and the next day serum-starved overnight, followed by IL-1α (1 ng/ml) stimulation for 6 hours (in triplicate, with untreated control cells also in triplicate, to yield 6 ATAC-seq samples). Using the Buenrostro et al. [Citation7,Citation24] protocol modified to reduce mitochondrial DNA contamination [Citation25], nuclei were isolated by lysis of cells using ice-cold lysis buffer (10 mM Tris-HCl, pH 7.4, 10 mM NaCl, 3 mM MgCl2 and 0.1% IGEPAL CA-630) and centrifugation at 500 g for 10 minutes at 4°C. Following isolation, the nuclei were resuspended in the transposase reaction mix (25 μL 2x TD buffer, 2.5 μL Transposase TDE1 (Nextera Tn5 Transposase, Illumina, Cambridge, UK) in a total volume of 50 μL and incubated for 30 minutes at 37°C. All samples were subsequently purified using Qiagen MinElute PCR Purification Kit (Qiagen, Manchester, UK), eluting in 10 μl of Elution Buffer. Transposed DNA was PCR amplified using the NEB Next High-Fidelity PCR Master Mix (New England Biolabs, Hitchin, UK) and primer Ad1_noMX in combination with one of six barcoded primers in a 50 μL reaction. Oligonucleotide primer sequences are listed in Supplementary Table 1. Cycling conditions were as previously described [Citation24]. An aliquot of the reaction was subjected to quantitative real-time PCR cycles, the remaining 45 μL was then subjected to PCR for a calculated additional number of cycles as described to avoid amplification to saturation. Finally, the amplified libraries were purified using a Qiagen MinElute PCR Purification Kit and eluted in 20 μl Elution Buffer before quantitation on an Agilent 4200 TapeStation (Agilent Technologies LDA UK Limited, Stockport, UK). Pooled libraries were sequenced on a High-Output Illumina NextSeq500 generating paired-end 75 bp reads.
Data analysis and bioinformatics
All 6 samples were sequenced to a depth of 53–74 million paired-end reads (Supplementary Table 2). Quality control of raw sequencing reads was performed using FastQC (v0.11.7). All samples passed QC. Reads were aligned to the hg38 reference genome using Bowtie2 short read aligner (v2.3.4.1) [Citation26] using default settings. Peaks were called using MACS2 (v2.1.1.20160309) [Citation27] with the – nomodel option on. Peaks with an FDR < 0.05 were considered significant. The Integrative Genomics Viewer (IGV) [Citation28] was used to visualize read coverage and peaks. Peaks were annotated using the annotatePeaks.pl program within HOMER (v4.9.1) [Citation29]. The DiffBind (v2.12.0) Bioconductor package was used to find differentially open peaks between IL-1 and control samples. For differential peak testing, a consensus peak set was generated by DiffBind using default settings; a peak was considered a consensus peak if it appears in two or more samples. A total of 126,483 unique consensus peaks were found. The DESeq2 method implemented within DiffBind was used to test differential peaks between conditions. Using this method, 241 peaks with an FDR < 0.05 were found (Supplementary Table 3). To determine the chromatin state of the peaks, the data were intersected with chromatin state data from Roadmap E049 cells – bone marrow-derived mesenchymal stem cell (BM-MSC) differentiated chondrocytes [Citation30]. From these cells the 18-state model was collapsed to the 5 representative states and the size of the peak-intersected states summed. Statistical significance of peak enrichment in chromatin states was determined using a Pearson’s Chi-squared test with Yates’ continuity correction. MEME (v5.0.3) [Citation31] was used for de novo motif searching in up- and down-regulated peaks, with a minimum motif length of 6bp and a maximum motif length of 30bp. The TOMTOM motif matching tool within the MEME suite of tools was used to match motifs found by MEME to known motifs. Genomic Regions Enrichment of Annotations Tool (GREAT) [Citation32] was used to find gene ontology terms related to 661 up- and 1649 down-regulated peaks (defined with a less stringent cut-off of ≥1.5 fold and p ≤ 0.01 non-FDR-adjusted).
Transcriptome analysis
An Illumina HT-12 v4 microarray was used to measure gene expression in IL-1α treated SW1353 samples (n = 3) compared to controls (n = 3). The lumi Bioconductor package [Citation33] was used to pre-process and normalize the data. Probes with a detection p-value > 0.01 were removed from the analysis. Microarray signals were log2 transformed and normalized using the Robust Spline Normalization (RSN) procedure within lumi. Differential gene expression analysis was performed using the limma package [Citation34]. A linear model was fitted to the data and an empirical Bayes method implemented within limma was used to find differentially expressed genes between conditions. As data were collected in two experimental batches, this information was added as a covariate in the linear model. Multiple tests were corrected for using the Benjamini-Hochberg method and genes with an FDR < 0.05 were considered to be significant (Supplementary Table 4). ATAC-seq peaks were linked to the transcription start site (TSS) of the nearest gene present on the gene expression microarray using a custom R script.
Genome-editing
SW1353-Cas9 cells seeded into 6 well plates at 10,000 cells/cm2 were transfected with 50 µM of each gRNA (two gRNAs per region to delete) duplexed with 100 µM tracrRNA using DharmaFECT 1 transfection reagent (Horizon Discovery, Cambridge, UK) following a modified version of the IDT ‘Alt-R CRISPR/Cas9 System’ protocol. The control transfection contained DharmaFECT 1 but no duplex. Cells were incubated at 37°C and after 3 days trypsinized and reseeded into a 75 cm2 flask with a small proportion used for genomic DNA isolation with an Invitrogen PureLink Genomic DNA mini kit following manufacturer’s instructions (ThermoFisher Scientific, Life Technologies Ltd, Paisley, UK). Genomic regions of interest were amplified from 100 ng isolated gDNA using Phire Polymerase II (ThermoFisher Scientific) following the manufacturer’s protocol.
Luciferase analysis
Genomic regions (and deletions) corresponding to the ATAC-seq putative enhancer peaks 21,603, 48,601, 8848, and 90,201 were amplified with Phire II polymerase (ThermoFisher Scientific) with template gDNA used from the corresponding wild-type or Cas9-edited SW1353 cells. PCR oligonucleotides contained additional sequences complementary to Bgl II restriction endonuclease digested pGL3-promoter plasmid (Promega, Southampton, UK) for subsequent cloning using the InFusion HD Cloning Kit protocol (Takara Bio, Saint-Germain-en-Laye, France). All plasmids were confirmed by Sanger sequencing. For luciferase analysis, SW1353 cells were seeded into 96 well plates at 18,000 cells/cm2. Each well was transfected with 25ng of the corresponding putative enhancer-cloned pGL3-promoter luciferase reporter along with 1.5ng Renilla (pRL-TK Vector, Promega) control reporter vector using FuGENE HD transfection reagent as previously described [Citation35]. Transfected cells were serum starved overnight prior to stimulation with IL-1α (0.5 ng/ml) for either 6 hrs or 24hrs as indicated. PBS-washed cells were lysed with passive lysis buffer (Promega) and luminescence monitored using a Glomax Luminometer and the Dual-Luciferase Reporter Assay System (Promega). Firefly luciferase data were normalized to the Renilla luciferase control. An NF-κB-luc reporter (Takara Bio) was used as a positive control (Supplementary Figure 11A).
Data availability
The following published datasets were used in this study. For KB cell RELA ChIP-seq NCBI GEO submission GSE52469 [Citation18,Citation36], KB/HeLa cell IL-1 ATAC-seq accession GSE134436 [Citation22]. Chromatin state data for Roadmap E049 BM-MSC differentiated chondrocytes accession GSE19465 [Citation30,Citation37]. ATAC-seq data and microarray data generated here are available with the accession GSE144303 and GSE144489, respectively.
Results
Interleukin-1 signalling initiates dynamic chromatin accessibility changes
To investigate dynamic chromatin signatures during IL-1 stimulation we used the chondrosarcoma cell line SW1353, which has a well-characterized robust response to IL-1 stimulation [Citation38]. A modified ATAC-seq protocol [Citation25] was performed in triplicate on control or IL-1 stimulated cells, generating ~62 million reads/sample with a low level of contaminating mitochondrial DNA reads (between 1 and 11%) (Supplementary Table 2). The expected nucleosome banding patterns were identified by analysis of fragment size distribution (Supplementary Figure 1a). Interpretation of nucleosome positioning highlighted nucleosome depletion at transcription start sites (TSS) and the position of the most proximal nucleosomes (Supplementary Figure 1b).
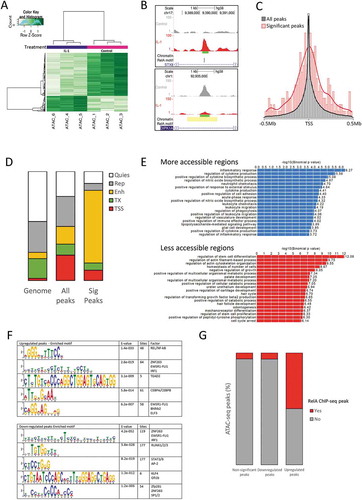
126,483 accessible chromatin regions (peaks) were identified across the samples. The genomic distribution of the peaks were annotated with Genbank features to indicate their genic or intergenic localization (Supplementary Figure 2). Differential accessibility was assessed by comparison of peaks between control and IL-1-treated samples. 241 significant regions were identified with 64 and 177 becoming more or less accessible, respectively, following IL-1 treatment (). Examples of regions that became more or less accessible are given for peaks within the STX8 and DIPK1A (previously FAM69A) gene loci respectively (, with additional examples in Supplementary Figure 3). The majority of the 126,483 accessible regions are centred around the TSS, however, the 241 significant regions showed an extended distribution with a proportion displaying chromatin changes distal to gene promoters ( and Supplementary Table 3). Next, we examined accessible region distribution in relation to chromatin state information obtained from BM-MSC-derived chondrocytes by the NIH Roadmap Epigenomics project [Citation30,Citation37]. When assessing all the regions (‘All peaks’) there was increased representation at TSS and enhancers compared to the genome-wide distribution of the chromatin states (). For the 241 significantly differentially accessible regions there was a highly significant enrichment at regions marked as enhancers, compared to ‘All peaks’ (p < 2.2 x 10⁻¹⁶) or the genome-wide distribution (p < 2.2 x 10⁻¹⁶) of the chromatin state (). A recent study also identified IL-1-regulated genomic regions in HeLa-derived KB cells stimulated for 60 minutes [Citation22]. When analysing both datasets identically (Supplementary Table 4), we identified 159 more and 137 less accessible regions in common following IL-1 stimulation (Supplementary Figure 4). Of interest, only the more accessible regions following stimulation contained a highly significant overlap (p < 0.0001) between the datasets, indicating that common genomic regions become accessible following IL-1 stimulation independent of cell-type. Regions that become less accessible could be less cell-type specific or may simply reflect the differences in the initial chromatin states of the diverse cells.
Figure 1. ATAC-seq identified peaks in IL-1-stimulated chondrocytes
IL-1-driven accessible chromatin regions are associated with RelA/NF-κB binding
By associating differentially accessible regions with their nearest gene, gene ontology (GO) analysis revealed regions of increased accessibility were associated with terms connected to an inflammatory response or a response to external stimuli (). Terms associated with less accessible regions were more diverse, but interestingly given that SW1353 are a chondrosarcoma cell line, contained terms associated with cartilage including ‘palate development’ and ‘positive regulation of cartilage development’. Motif analysis to identify potential transcription factors regulating differentially accessible regions indicated regions with increased accessibility were enriched for proteins such as NF-κB (RelA), IRF1/ZNF263, CEBPA, and ELF3 while motifs in regions with reduced accessibility following IL-1 treatment included those for ZNF263, RUNX1 and STAT3 (). Next we intersected the location of our peaks with a RelA ChIP-seq dataset generated following 1 hour IL-1 stimulation of HeLa-derived KB cells [Citation18,Citation36]. For all the accessible regions, or those with reduced accessibility, only approximately 5% were associated with a RelA peak. In contrast, 50% of the significantly more accessible regions following stimulation contained at least one associated RelA-bound ChIP-seq peak (p < 2.2 x 10⁻¹⁶)().
Dynamic alterations in chromatin accessibility correlate with gene expression changes
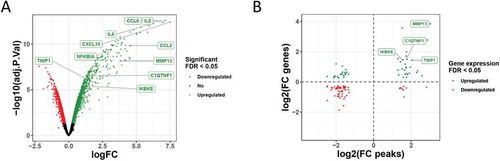
To establish whether the changes in chromatin accessibility were associated with gene expression changes SW1353 cells were again stimulated with IL-1 for 6 hours and whole-genome gene expression microarray analysis performed. IL-1 stimulation resulted in 408 upregulated and 51 downregulated genes (2-fold, FDR <0.05) (, Supplementary Table 5). Prototypical IL-1 response genes including IL8 (CXCL8), IL6, CCL2 and NFKBIA were all significantly upregulated, but no significant peaks were found at these loci, although increases in accessibility were apparent at the CXCL8, IL6 and CXCL10 loci (Supplementary Figure 5). Next, we correlated the differentially expressed genes with the changes in chromatin accessibility. The majority of chromatin accessibility changes occurred without an expression change to the nearest gene. However, where gene expression changes were associated with accessibility changes there was a positive correlation between accessibility and altered gene expression (Spearman’s rank correlation rho 0.4771, p < 1 x10⁻⁷), suggesting that the opening/closing of chromatin contributes to the observed transcriptional regulation ( and Supplementary Figure 6). We also observed that an overall higher ATAC-seq read count per gene positively correlated with the level of gene expression in both control and IL-1 stimulated conditions (Supplementary Figure 7 and Supplementary Table 6).
Figure 2. Correlation between differentially accessible chromatin regions and gene expression changes
Newly accessible regions following IL-1 stimulation can act as enhancers
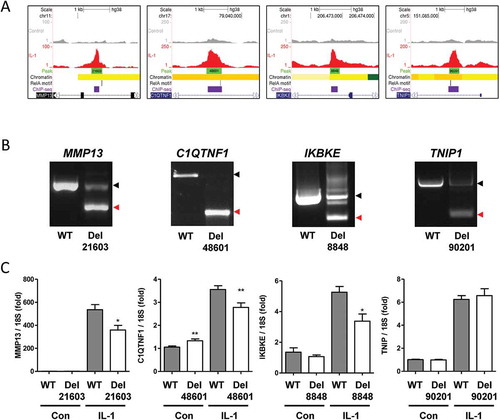
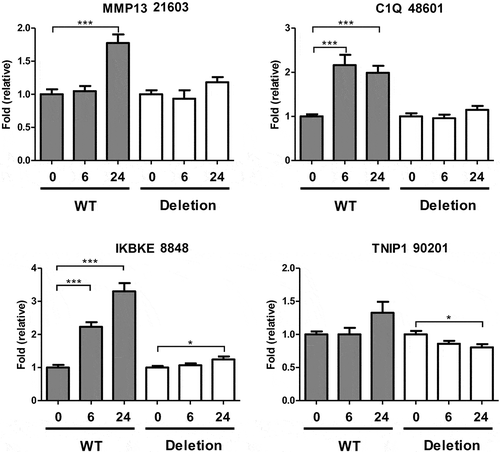
To test whether regions of increased accessibility at IL-1-induced gene loci were required for gene induction we used pairs of gRNAs and Cas9 to delete significant intronic accessible regions within the MMP13 (peak 21,603), C1QTNF1 (peak 48,601), IKBKE (peak 8848) and TNIP1 (peak 90,201) loci ( and b). All four genes were upregulated following IL-1 stimulation (). RelA binding sites were identified at these regions by both MEME motif analysis and the intersection with IL-1-induced RelA ChIP-seq peaks () [Citation36]. Further, interrogation of published ChIP-seq data at the Gene Transcription Regulation Database (GTRD) also indicated the presence of RelA binding in multiple datasets (Supplementary Figure 8) [Citation39]. We also used JEME (joint effect of multiple enhancers), which predicts enhancer-target gene interactions by leveraging enhancer features and gene expression levels from consortia datasets, to determine the target genes of all our accessible regions [Citation40]. These predicted interactions for the regions within MMP13, C1QTNF1, and TNIP1 with their respective gene promoter/TSS (Supplementary Figure 9). Cas9-mediated deletion of the IL-1-induced accessible regions at the MMP13, C1QTNF1 and IKBKE loci caused a corresponding reduction in the upregulation of gene expression by IL-1 (). TNIP1 basal or induced expression was unaffected. Expression of the well-characterized IL-1 responsive gene IL-8 was unaffected by deletion of any of the four regions, confirming they did not affect NF-κB signalling per se (Supplementary Figure 10A).
Figure 3. Effect of Cas9-mediated putative enhancer deletion on IL-1-induced gene expression
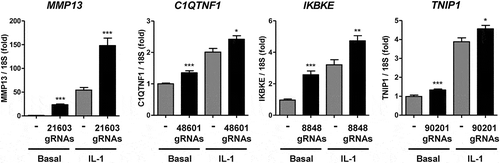
The requirement of these regions for IL-1-induced gene expression suggests they act as enhancers. Accordingly, we targeting an activating dCas9-VPR (dCas9-VP64-p65-Rta fusion protein) to the ATAC-seq-identified accessible regions to provide further evidence that these putative enhancers regulate local gene expression [Citation41]. Consistent with this, the treatment of SW1353 constitutively expressing dCas9-VPR (Supplementary Figure 10B) with gRNAs targeting these regions resulted in upregulation of basal gene expression of MMP13, C1QTNF1 and IKBKE (). The IL-1-induced expression of all four genes was also increased following gRNA addition. In contrast transfection with gRNAs targeting the other genes (i.e. alternative regions in the genome) had no effect (Supplementary Figure 10C).
Figure 4. Effect of enhancer-targetted Cas9-VPR on gene expression
Finally, to further assess the ability of these regions to act as IL-1-responsive enhancers the regions were cloned into an enhancer luciferase reporter and the impact of stimulation determined. The regions remaining following the Cas9 deletion were cloned as controls. MMP13, C1QTNF1 and IKBKE regions displayed basal activity above the empty vector, pGL3-promoter (Supplementary Figure 11B). Following IL-1 stimulation for 6 or 24 hours the accessible regions at the C1QTNF1 and IKBKE loci promoted luciferase expression (), while for the MMP13 region, only the later time point saw an increase in luciferase activity. The region within TNIP1 did not significantly drive luciferase expression at either time. Neither the MMP13 nor C1QTNF1 regions remaining after Cas9-deletion were able to drive IL-1 induction of luciferase activity but the IKBKE deletion region did show some residual low-level ability to enhance luciferase expression at 24 hours post IL-1 treatment.
Figure 5. Enhancer activity of differentially accessible chromatin regions
Discussion
Herein we established the chromatin accessibility landscape in the well-characterized IL-1-responsive SW1353 chondrocyte cell line following IL-1 stimulation [Citation38]. We identified 241 regions exhibiting changes in chromatin accessibility, a large proportion of which correspond with enhancer regions of chondrocytes. Importantly, we have experimentally examined the function of a number of these differentially accessible regions and confirmed their enhancer activity and contribution to IL-1-induced gene expression.
Changes in chromatin conformation and accessibility are widespread during development where cells undergoing differentiation exhibit major alterations in gene expression [Citation1]. Consistent with this, comparison of chromatin differences between cell types by ATAC-seq has identified large numbers of regions of differing accessibility [Citation13]. This supports previous findings using the similar DNase I sensitivity assay, that chromatin accessibility at expression quantitative trait loci (eQTLs) is the major determinant of human expression variation [Citation42]. Many such accessible regions overlap with enhancer modifications confirming the cell type-specific regulation of gene expression by enhancers. The impact of signalling pathway activation on chromatin accessibility is less well established. Calderon et al. used distinct stimuli to induce biologically relevant responses in a range of T and B cell subsets and monocytes and NK cells and assessed chromatin accessibility via ATAC-seq [Citation20]. Overall they found dramatic changes in the chromatin landscapes of the B and T cells, but limited effects in innate lineage cells. Macrophages, differentiated from induced pluripotent stem cell (iPSC) lines, have also been assessed for stimuli-dependent chromatin accessibility changes, including using IFNγ [Citation21]. Similarly, murine macrophage enhancers have been classified into several categories based on their response to several distinct stimuli. This identified a relatively small number (2140) of genomic regions that were unmarked (lacking H3K4me1 and H3K27Ac histone modifications) in unstimulated cells but which acquired enhancer features upon at least one stimulation, including IL-1β, which were termed latent enhancers [Citation17]. We observed our differentially accessible chromatin regions overwhelmingly corresponded to regions marked by H3K4me1 and H3K27Ac in MSC-derived chondrocytes, thereby categorized as enhancers. Without chromatin state data from control or IL-1-stimulated SW1353 cells we can only speculate whether our differentially assessable regions have histone marks characteristic of enhancers in the absence or presence of IL-1 stimulation, in contrast to latent enhancers. Recently, Weiterer et al. determined IL-1α responsive enhancers in HeLa-derived KB cells using ATAC-seq [Citation22]. In contrast to our data, they identified >75,000 IL-1-induced open regions although their experiment was only in singlicate and therefore they could not determine significance. However, when commonly co-analysing the two datasets it was apparent regions becoming more accessible following IL-1 treatment significantly overlapped when compared to those becoming less accessible, perhaps unsurprisingly, suggesting important inflammatory regulated regions of the genome are cell-type independent.
De novo motif discovery within the latent enhancers defined following TNFα or IL-1β stimulation of macrophages identified significant RelA/NF-κB over-representation [Citation17]. Similarly, NF-κB motifs are enriched in accessible regions also marked by H3K27Ac following IL-1α stimulation [Citation22]. Within the IL-1 increased accessible regions in our dataset a similar, highly significant, enrichment for RelA/NF-κB binding motifs was observed. Analysis of the GTRD ChIP-seq database and IL-1-induced RelA ChIP-seq data confirmed that the four regions focussed upon were also bound by RelA in cells. While NF-κB is not thought to be a ‘pioneering factor’, i.e. a transcription factor able to initiate chromatin remodelling, evidence does support a role for the factor in changing the nucleosome landscape at activated loci [Citation15,Citation43]. The second most enriched motif in IL-1 increased accessible regions was IRF1, interferon regulatory factor 1, a factor that increases with IL-1 stimulation [Citation44]. We also identified enrichment for the ELF3 binding motif, which again is induced by IL-1 and is a crucial mediator of the phenotypic and transcriptional changes induced by this cytokine, including in chondrocytes [Citation45,Citation46], where it can also regulate MMP13 expression [Citation47]. Chondrocyte-specific Elf3 deletion also reduces the severity of disease in a murine osteoarthritic model [Citation48]. Thus, our analysis identifies physiologically relevant additional IL-1-responsive factors besides NF-κB, though we cannot rule out that the activation of these transcription factors are secondary events due to our chosen 6 hour time point. Motifs enriched in the less accessible peak regions were more diverse but did not contain RelA/NF-κB. However, enriched motifs included for factors known to also be regulated by IL-1, or to co-ordinate with NF-κB, including IRF1 again, RUNX and STAT3/6 [Citation49,Citation50].
IL-1 treatment of cells predominantly activates NF-κB and MAPK signalling leading to the transcriptional regulation of a wide variety of genes. However, the role of chromatin alterations and enhancers in this activation is largely unknown. Stimulation of SW1353 with IL-1 for 6 hours results in expression changes of greater than 2-fold in almost 500 genes. It is unclear why only a small proportion of IL-1-induced genes exhibited changes in chromatin accessibility but where an accessible region was linked to an IL-1-regulated gene there was a strong positive correlation, suggesting that accessibility influences gene expression. Similarly, in contrast to other studies identifying a large number of accessibility changes [Citation21], IL-1 stimulation in SW1353 cells resulted in only a small number of changes. The regulation of many IL-1-induced genes may not require chromatin accessibility changes because cells are already primed to rapidly respond to stimuli. Indeed most promoters already exhibit reduced nucleosome occupancy [Citation7,Citation51]. Certainly, the majority of the significant accessibility changes in SW1353 cells after IL-1 stimulation occurred at intronic or intergenic positions, rather than TSS or promoters. Additionally, many gene promoters exhibit heavy acetylation before stimulation and are thus constitutively and immediately accessible, while some genes require modifications to chromatin structure during NF-κB recruitment to allow transcription [Citation52,Citation53]. Consistent with this, the pre-existing chromatin state was found to determine the activation of rapidly–induced NF-κB target genes by RelA [Citation54]. Accordingly, critical IL-1 response genes activated immediately forego the requirement for chromatin accessibility changes where the chromatin is already active, while later responding genes or those requiring additional inputs may be regulated by regions requiring activation of the chromatin to increase accessibility [Citation55]. Additionally, activation of genes without concomitant accessibility changes might reflect movement of gene loci into transcription factories [Citation56,Citation57].
We confirmed the function of a number of accessible regions in regulating IL-1-induced gene expression, focussing on regions that became more accessible with stimulation. We chose to focus on regions within MMP13, C1QTNF1, IKBKE and TNIP1 because all had strong evidence for the binding of RelA following IL-1 stimulation. These accessible regions were all intronic to the purported regulated gene, and the deletion of these regions within MMP13, C1QTNF1 and IKBKE lead to a reduction in the respective gene expression following IL-1 stimulation, highlighting intronic enhancers and their role in gene regulation. However, none of the regions deleted completely ablated the induction of the corresponding gene, and in fact deletion of region 90,201 near TNIP1 had no effect on the genes' expression. Cas9-mediated deletions were successful for all genes but did not reach 100% for 3 of the 4 genes studied. It is likely that complete deletion may further reduce gene expression. Accordingly, we cannot entirely rule out an enhancer role for the region within the TNIP1 locus despite little evidence of enhancer activity. However, even when taking the lack of complete deletion into consideration, our data are consistent with a model of multiple enhancers looping to control expression and suggests an important role for enhancer redundancy in the regulation of inflammatory signalling, as has been seen during development where the purported mechanistic function is to prevent deleterious phenotypic consequences [Citation58]. No impact of intron deletion was observed on the basal level of gene expression suggesting splicing was not impacted. An effect of transcribing polymerase on chromatin accessibility at intronic regions also cannot be excluded but there is little evidence of an overall increase in accessibility at IL-1-induced gene body regions. The proximity of intronic enhancer to their respective gene promoters may facilitate function and future work would assess the role of intergenic enhancers identified herein.
MMP13, matrix metalloproteinase-13, is a collagenase responsible for cartilage collagen turnover and pathological destruction in osteoarthritis progression. MMP13 is highly regulated by inflammatory signalling, the inhibition of which is a proposed therapeutic strategy in OA, however the mechanism by which cytokines directly impact on its expression has proven to be somewhat elusive [Citation59]. Proximal promoter AP-1 factor binding is critical for the accurate inflammatory induced expression of the gene and in part the binding of ATF3, however, NF-κB is also critical for activating cytokine-induced MMP13 expression [Citation60–63]. The data here suggests this could in part be via a novel RelA-bound intron 5 enhancer. Two distal enhancers at −10kb and −30kb in osteoblasts may also contribute to basal and Vitamin D receptor, or RUNX2-mediated, MMP13 expression [Citation64]. IKBKE, TNIP1 and C1QTNF1 are themselves important molecules in inflammatory signalling [Citation65–69] and known to be regulated in an NF-κB-dependent manner [Citation68,Citation70].
In conclusion, we have identified a number of dynamic chromatin accessibility changes modulated by short stimulation with IL-1. Regions that become accessible are enriched for RelA binding motifs and chromatin enhancer marks. Finally, we have functionally validated the regulatory function of several regions using a range of tools, including CRISPR/Cas9-mediated genome editing. Of particular interest our data suggests the presence of an intronic enhancer important for the regulation of MMP13 expression following cytokine stimulation. Our data confirms that ATAC-seq represents a simple method to identify novel and highly dynamic chromatin changes and potentially important enhancer regions following cell stimulation.
Declaration of contributions
DAY and MJB were involved in concept and study design. JF, ACP, CC, SO’B, KT-P, GN, and MJB were involved in data collection. KC, MJB, LNR and DAY were involved in data analysis and interpretation. DAY, MJB and DJD obtained the funding. All authors were involved in drafting the manuscript and gave final approval of the version submitted.
Supplemental Material
Download MS Excel (4.3 MB)Supplemental Material
Download Zip (890.7 KB)Acknowledgments
This work was supported by the Medical Research Council and Versus Arthritis as part of the MRC-Arthritis Research UK Centre for Integrated Research into Musculoskeletal Ageing (CIMA, grant references JXR 10641 and MR/P020941/1); the Newcastle upon Tyne Hospitals NHS Charity; the JGW Patterson Foundation; and The Dunhill Medical Trust (R476/0516).
Disclosure statement
All authors declare no competing interests.
Supplementary data
Supplemental material for this article can be accessed here.
Additional information
Funding
References
- Klemm SL, Shipony Z, Greenleaf WJ. Chromatin accessibility and the regulatory epigenome. Nat Rev Genet. 2019;20(4):207–220.
- Allis CD, Jenuwein T. The molecular hallmarks of epigenetic control. Nat Rev Genet. 2016;17(8):487–500.
- Barter MJ, Bui C, Cheung K, et al. DNA hypomethylation during MSC chondrogenesis occurs predominantly at enhancer regions. Sci Rep. 2020;10(1):1169.
- Wu X, Zhang Y. TET-mediated active DNA demethylation: mechanism, function and beyond. Nat Rev Genet. 2017;18(9):517–534.
- Teif VB, Rippe K. Predicting nucleosome positions on the DNA: combining intrinsic sequence preferences and remodeler activities. Nucleic Acids Res. 2009;37(17):5641–5655.
- Whitehouse I, Flaus A, Cairns BR, et al. Nucleosome mobilization catalysed by the yeast SWI/SNF complex. Nature. 1999;400(6746):784–787.
- Buenrostro JD, Giresi PG, Zaba LC, et al. Transposition of native chromatin for fast and sensitive epigenomic profiling of open chromatin, DNA-binding proteins and nucleosome position. Nat Methods. 2013;10(12):1213–1218.
- Garlanda C, Dinarello CA, Mantovani A. The interleukin-1 family: back to the future. Immunity. 2013;39(6):1003–1018.
- Dinarello CA. Overview of the IL-1 family in innate inflammation and acquired immunity. Immunol Rev. 2018;281(1):8–27.
- Weber A, Wasiliew P, Kracht M. Interleukin-1 (IL-1) pathway. Sci Signal. 2010;3(105): 1. p. cm.
- Cohen P. The TLR and IL-1 signalling network at a glance. J Cell Sci. 2014;127(Pt 11):2383–2390.
- Palomo J, Dietrich D, Martin P, et al. The interleukin (IL)-1 cytokine family–Balance between agonists and antagonists in inflammatory diseases. Cytokine. 2015;76(1):25–37.
- Liu C, Wang M, Wei X, et al. An ATAC-seq atlas of chromatin accessibility in mouse tissues. Sci Data. 2019;6(1):65.
- Zhu J, Adli M, Zou J, et al. Genome-wide chromatin state transitions associated with developmental and environmental cues. Cell. 2013;152(3):642–654.
- Diermeier S, Kolovos P, Heizinger L, et al. TNFalpha signalling primes chromatin for NF-kappaB binding and induces rapid and widespread nucleosome repositioning. Genome Biol. 2014;15(12):536.
- He HH, Meyer CA, Chen MW, et al. Differential DNase I hypersensitivity reveals factor-dependent chromatin dynamics. Genome Res. 2012;22(6):1015–1025.
- Ostuni R, Piccolo V, Barozzi I, et al. Latent enhancers activated by stimulation in differentiated cells. Cell. 2013;152(1–2):157–171.
- Jurida L, Soelch J, Bartkuhn M, et al. The activation of IL-1-induced enhancers depends on TAK1 Kinase activity and NF-kappaB p65. Cell Rep. 2015;10(5):726–739.
- Brown JD, Lin C, Duan Q, et al. NF-kappaB directs dynamic super enhancer formation in inflammation and atherogenesis. Mol Cell. 2014;56(2):219–231.
- Calderon D, Nguyen MLT, Mezger A, et al. Landscape of stimulation-responsive chromatin across diverse human immune cells. Nat Genet. 2019;51(10):1494–1505.
- Alasoo K, Rodrigues J, Mukhopadhyay S, et al. Shared genetic effects on chromatin and gene expression indicate a role for enhancer priming in immune response. Nat Genet. 2018;50(3):424–431.
- Weiterer SS, Meier‐Soelch J, Georgomanolis T, et al. Distinct IL-1alpha-responsive enhancers promote acute and coordinated changes in chromatin topology in a hierarchical manner. Embo J. 2020;39(1):e101533.
- Woods S, Barter MJ, Elliott HR, et al. miR-324-5p is up regulated in end-stage osteoarthritis and regulates Indian Hedgehog signalling by differing mechanisms in human and mouse. Matrix Biol. 2019;77:87–100.
- Buenrostro JD, Wu B, Chang HY, et al. ATAC-seq: a method for assaying chromatin accessibility Genome-Wide. Curr Protoc Mol Biol. 2015;109(1–21):21 29. 29 9.
- Montefiori L, Hernandez L, Zhang Z, et al. Reducing mitochondrial reads in ATAC-seq using CRISPR/Cas9. Sci Rep. 2017;7(1):2451.
- Langmead B, Salzberg SL. Fast gapped-read alignment with Bowtie 2. Nat Methods. 2012;9(4):357–359.
- Feng J, Liu T, Qin B, et al. Identifying ChIP-seq enrichment using MACS. Nat Protoc. 2012;7(9):1728–1740.
- Thorvaldsdottir H, Robinson JT, Mesirov JP. Integrative Genomics Viewer (IGV): high-performance genomics data visualization and exploration. Brief Bioinform. 2013;14(2):178–192.
- Heinz S, Benner C, Spann N, et al. Simple combinations of lineage-determining transcription factors prime cis-regulatory elements required for macrophage and B cell identities. Mol Cell. 2010;38(4):576–589.
- Roadmap Epigenomics C, Meuleman W, Ernst J, et al. Integrative analysis of 111 reference human epigenomes. Nature. 2015;518(7539):317–330.
- Bailey TL, Boden M, Buske FA, et al. MEME SUITE: tools for motif discovery and searching. Nucleic Acids Res. 2009;37(Web Server issue):W202–8.
- McLean CY, Bristor D, Hiller M, et al. GREAT improves functional interpretation of cis-regulatory regions. Nat Biotechnol. 2010;28(5):495–501.
- Du P, Kibbe WA, Lin SM. lumi: a pipeline for processing Illumina microarray. Bioinformatics. 2008;24(13):1547–1548.
- Ritchie ME, Phipson B, Wu D, et al. limma powers differential expression analyses for RNA-sequencing and microarray studies. Nucleic Acids Res. 2015;43(7):e47.
- Le LT, Swingler TE, Crowe N, et al. The microRNA-29 family in cartilage homeostasis and osteoarthritis. J Mol Med (Berl). 2016;94(5):583–596.
- Handschick K, Beuerlein K, Jurida L, et al. Cyclin-dependent kinase 6 is a chromatin-bound cofactor for NF-kappaB-dependent gene expression. Mol Cell. 2014;53(2):193–208.
- Herlofsen SR, Bryne JC, Høiby T, et al. Genome-wide map of quantified epigenetic changes during in vitro chondrogenic differentiation of primary human mesenchymal stem cells. BMC Genomics. 2013;14:105.
- Gebauer M, Saas J, Sohler F, et al. Comparison of the chondrosarcoma cell line SW1353 with primary human adult articular chondrocytes with regard to their gene expression profile and reactivity to IL-1beta. Osteoarthritis Cartilage. 2005;13(8):697–708.
- Yevshin I, Sharipov R, Kolmykov S, et al. GTRD: a database on gene transcription regulation-2019 update. Nucleic Acids Res. 2019;47(D1):D100–D105.
- Cao Q, Anyansi C, Hu X, et al. Reconstruction of enhancer-target networks in 935 samples of human primary cells, tissues and cell lines. Nat Genet. 2017;49(10):1428–1436.
- Chavez A, Scheiman J, Vora S, et al. Highly efficient Cas9-mediated transcriptional programming. Nat Methods. 2015;12(4):326–328.
- Degner JF, Pai AA, Pique-Regi R, et al. DNase I sensitivity QTLs are a major determinant of human expression variation. Nature. 2012;482(7385):390–394.
- Comoglio F, Simonatto M, Polletti S, et al. Dissection of acute stimulus-inducible nucleosome remodeling in mammalian cells. Genes Dev. 2019;33(17–18):1159–1174.
- Orzalli MH, Smith A, Jurado KA, et al. An antiviral branch of the IL-1 signaling pathway restricts immune-evasive virus replication. Mol Cell. 2018;71(5):825–840. e6.
- Conde J, Otero M, Scotece M, et al. E74-like factor 3 and nuclear factor-kappaB regulate lipocalin-2 expression in chondrocytes. J Physiol. 2016;594(21):6133–6146.
- Longoni N, Sarti M, Albino D, et al. ETS transcription factor ESE1/ELF3 orchestrates a positive feedback loop that constitutively activates NF-kappaB and drives prostate cancer progression. Cancer Res. 2013;73(14):4533–4547.
- Otero M, Plumb DA, Tsuchimochi K, et al. E74-like factor 3 (ELF3) impacts on matrix metalloproteinase 13 (MMP13) transcriptional control in articular chondrocytes under proinflammatory stress. J Biol Chem. 2012;287(5):3559–3572.
- Wondimu EB, Culley KL, Quinn J, et al. Elf3 contributes to cartilage degradation in vivo in a surgical model of post-traumatic Osteoarthritis. Sci Rep. 2018;8(1):6438.
- Martincuks A, Andryka K, Küster A, et al. Nuclear translocation of STAT3 and NF-kappaB are independent of each other but NF-kappaB supports expression and activation of STAT3. Cell Signal. 2017;32:36–47.
- Mengshol JA, Vincenti MP, Brinckerhoff CE. IL-1 induces collagenase-3 (MMP-13) promoter activity in stably transfected chondrocytic cells: requirement for Runx-2 and activation by p38 MAPK and JNK pathways. Nucleic Acids Res. 2001;29(21):4361–4372.
- Ramirez-Carrozzi VR, Braas D, Bhatt DM, et al. A unifying model for the selective regulation of inducible transcription by CpG islands and nucleosome remodeling. Cell. 2009;138(1):114–128.
- Saccani S, Pantano S, Natoli G. Two waves of nuclear factor kappaB recruitment to target promoters. J Exp Med. 2001;193(12):1351–1359.
- Kolovos P, Georgomanolis T, Koeferle A, et al. Binding of nuclear factor kappaB to noncanonical consensus sites reveals its multimodal role during the early inflammatory response. Genome Res. 2016;26(11):1478–1489.
- Zhao M, Joy J, Zhou W, et al. Transcriptional outcomes and kinetic patterning of gene expression in response to NF-kappaB activation. PLoS Biol. 2018;16(9):e2006347.
- Bhatt D, Ghosh S. Regulation of the NF-kappaB-Mediated Transcription of Inflammatory Genes. Front Immunol. 2014;5:71.
- Osborne CS, Chakalova L, Brown KE, et al. Active genes dynamically colocalize to shared sites of ongoing transcription. Nat Genet. 2004;36(10):1065–1071.
- Papantonis A, Kohro T, Baboo S, et al. TNFalpha signals through specialized factories where responsive coding and miRNA genes are transcribed. Embo J. 2012;31(23):4404–4414.
- Osterwalder M, Barozzi I, Tissières V, et al. Enhancer redundancy provides phenotypic robustness in mammalian development. Nature. 2018;554(7691):239–243.
- Young DA, Barter MJ, Wilkinson DJ. Recent advances in understanding the regulation of metalloproteinases. F1000Res. 2019;8:195.
- Chan CM, Macdonald CD, Litherland GJ, et al. Cytokine-induced MMP13 expression in Human Chondrocytes is dependent on activating transcription factor 3 (ATF3) regulation. J Biol Chem. 2017;292(5):1625–1636. .
- Fan Z, Yang H, Bau B, et al. Role of mitogen-activated protein kinases and NFkappaB on IL-1beta-induced effects on collagen type II, MMP-1 and 13 mRNA expression in normal articular human chondrocytes. Rheumatol Int. 2006;26(10):900–903.
- Raymond L, Eck S, Hays E, et al. RelA is required for IL-1beta stimulation of Matrix Metalloproteinase-1 expression in chondrocytes. Osteoarthritis Cartilage. 2007;15(4):431–441.
- Liacini A, Sylvester J, Li WQ, et al. Induction of matrix metalloproteinase-13 gene expression by TNF-alpha is mediated by MAP kinases, AP-1, and NF-kappaB transcription factors in articular chondrocytes. Exp Cell Res. 2003;288(1):208–217.
- Meyer MB, Benkusky NA, Pike JW. Selective distal enhancer control of the Mmp13 gene identified through clustered regularly interspaced short palindromic repeat (CRISPR) Genomic deletions. J Biol Chem. 2015;290(17):11093–11107.
- Hacker H, Karin M. Regulation and function of IKK and IKK-related kinases. Sci STKE. 2006 2006;357:13. p. re.
- Zhang J, Tian M, Xia Z, et al. Roles of IkappaB kinase epsilon in the innate immune defense and beyond. Virol Sin. 2016;31(6):457–465.
- Mauro C, Pacifico F, Lavorgna A, et al. ABIN-1 binds to NEMO/IKKgamma and co-operates with A20 in inhibiting NF-kappaB. J Biol Chem. 2006;281(27):18482–18488.
- Verstrepen L, Carpentier I, Beyaert R. The biology of A20-binding inhibitors of NF-kappaB activation (ABINs). Adv Exp Med Biol. 2014;809:13–31.
- Peterson JM, Aja S, Wei Z, et al. CTRP1 protein enhances fatty acid oxidation via AMP-activated protein kinase (AMPK) activation and acetyl-CoA carboxylase (ACC) inhibition. J Biol Chem. 2012;287(2):1576–1587.
- Wang N, Ahmed S, Haqqi TM. Genomic structure and functional characterization of the promoter region of human IkappaB kinase-related kinase IKKi/IKKvarepsilon gene. Gene. 2005;353(1):118–133.