
 ?Mathematical formulae have been encoded as MathML and are displayed in this HTML version using MathJax in order to improve their display. Uncheck the box to turn MathJax off. This feature requires Javascript. Click on a formula to zoom.
ABSTRACT
Testicular germ cell tumours (TGCTs) are the most common cancer in young male adults (aged 15 to 40). Unlike most other cancer types, identification of molecular signatures in TGCT has rarely reported. In this study, we developed a novel integrative analysis framework to identify co-methylated and co-expressed genes [mRNAs and microRNAs (miRNAs)] modules in two TGCT subtypes: non-seminoma (NSE) and seminoma (SE). We first integrated DNA methylation and mRNA/miRNA expression data and then used a statistical method, CoMEx (Combined score of DNA Methylation and Expression), to assess differentially expressed and methylated (DEM) genes/miRNAs. Next, we identified co-methylation and co-expression modules by applying WGCNA (Weighted Gene Correlation Network Analysis) tool to these DEM genes/miRNAs. The module with the highest average Pearson’s Correlation Coefficient (PCC) after considering all pair-wise molecules (genes/miRNAs) included 91 molecules. By integrating both transcription factor and miRNA regulations, we constructed subtype-specific regulatory networks for NSE and SE. We identified four hub miRNAs (miR-182-5p, miR-520b, miR-520c-3p, and miR-7-5p), two hub TFs (MYC and SP1), and two genes (RECK and TERT) in the NSE-specific regulatory network, and two hub miRNAs (miR-182-5p and miR-338-3p), five hub TFs (ETS1, HIF1A, HNF1A, MYC, and SP1), and three hub genes (CDH1, CXCR4, and SNAI1) in the SE-specific regulatory network. miRNA (miR-182-5p) and two TFs (MYC and SP1) were common hubs of NSE and SE. We further examined pathways enriched in these subtype-specific networks. Our study provides a comprehensive view of the molecular signatures and co-regulation in two TGCT subtypes.
Introduction
Testicular germ cell tumours (TGCTs) are the most common cancer in young men (ages 18–45), accounting for about 1% of the male population, and more than 50,000 new cases every year [Citation1–4]. TGCTs can be divided into two subtypes: seminomas (SE) and non-seminomas (NSE), where NSE patients were often diagnosed as mixed subtypes, including SE and subtypes of NSE [Citation1,Citation3,Citation4]. It is of great importance to explore the genomic mechanisms of TGCT to help the decision-making of the treatment of TGCT. Therefore, a number of studies have been performed to analyse the molecular characterization of TGCT. Litchfield et al. discussed the genomic features of TGCT by using a longitudinal approach, from cancer predisposition to long-term survival status, and collected 25 risk loci of TGCT [Citation5]. Later, they identified 19 new risk loci based on the analysis of Genome-Wide Association Studies (GWAS) of a large number of TGCT samples and controls [Citation2]. The epigenetics of TGCTs have also been analysed, including DNA methylation, histone modification, and RNA interference, and furthermore, some DNA methylation-based biomarkers were identified, such as APC, p16, p14, miR-373-3p, and so on [Citation4,Citation6,Citation7]. In our recent work, we performed a systematic investigation of molecular profiles related to telomere length and FFL models by using the molecular expression profiles of TGCT samples from The Cancer Genome Atlas (TCGA) and described it in terms of NSE and SE [Citation8,Citation9]. Recently, Shen et al. studied the molecular characterization of TGCT using multi-omics data, including mRNA, miRNA expression, DNA methylation, copy number variation as well as somatic mutation, and found that DNA methylation and miRNA expression profiles were able to distinguish different subtypes. Three genes (KIT, KRAS, and NRAS) were identified significantly mutated in SE samples [Citation1].
On the other hand, as one of the most studied epigenetic events, high DNA methylation is associated with reduced gene expression, and DNA methylation change in the genes has been considered as a biomarker of complex diseases, including cancer [Citation10]. However, there are problems to be solved, for example, what is the exact relationship between DNA methylation and gene expression? And how does DNA methylation affect disease initialization and development? A number of studies have been performed to identify DNA methylation patterns. Jiao et al. put forwards a method named FEM (Functional Epigenetic Modules) to identify various gene expression modules by integrating DNA methylation and gene expression data [Citation11]. Zhang et al. proposed an algorithm called lmQCM which can find co-methylation modules from pan-cancer data [Citation12]. In our previous work, we proposed a statistical model which can identify significant genes through integrating DNA methylation profile and gene expression profile, and effectively discover tumour markers [Citation13]. We also integrated and analysed DNA methylation as well as gene expression data by using a rule-based approach [Citation14,Citation15]. Ma et al. detected various epigenetic modules from multiple networks through integrating DNA methylation and mRNA expression profiles that classified breast cancer subtypes successfully [Citation16]. Recently, Hao et al. identified DNA methylation markers of breast cancer, colon cancer, liver cancer, and lung cancer via investigating methylation patterns [Citation17]. Furthermore, other related motif/module methods and molecular network analyses have been applied to disease and found interesting results [Citation18,Citation19]. However, there is still no systematic analysis of DNA methylation patterns of TGCT subtypes.
In this work, we investigated and compared methylation patterns of the two main subtypes of TGCT, NSE versus SE, based on our previous method [Citation13]. DNA methylation profiles and mRNA/miRNA expression data were analysed by using a distance score called INTcon [Citation13]. Then, DEM genes/miRNAs were identified with CoMEx score [Citation13]. Since there were no tumour-matched normal samples for TGCT in TCGA project, differential expressed/methylated genes/miRNAs were defined according to their values in NSE samples versus SE samples. We discovered functional co-methylation and co-expression modules of molecules for these DEM genes/miRNAs based on their combined scores using WGCNA (Weighted correlation network analysis) [Citation20]. PCC (Pearson correlation coefficient) was then computed between each pair of genes belonging to the same module. Next, several cluster validity indices were computed to evaluate the quality of clustering in WGCNA.
In addition, we explored various significant molecules considering their transcriptional and post-transcriptional regulations. For this, we evaluated the TF-target gene pairs and miRNA-target gene pairs with specific PCC cut-off and p-value cut-off. After that, we built subtype-specific regulatory networks and identified various hub molecules of each regulatory network. The common hubs between these two networks were identified. Furthermore, we conducted KEGG pathway analysis and extracted significantly enriched KEGG pathways for each subtype. In conclusion, our method is useful for the identification of various potential modules as well as hubs for any kind of disease.
Results
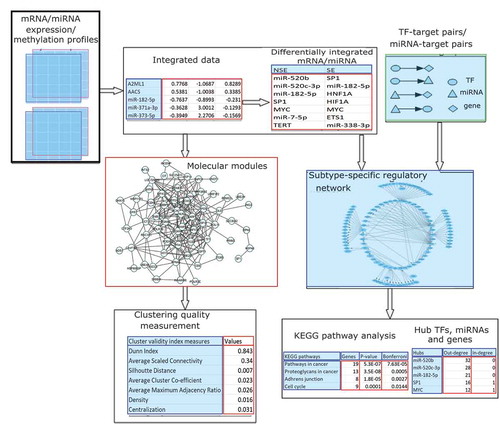
We performed our analysis according to the pipeline in . Firstly, we integrated mRNA/miRNA expression profiles and methylation profiles and computed differentially expressed/methylated mRNAs and miRNAs. Then we performed two parallel lines of analysis for these mRNAs and miRNAs. On one hand, we detected molecular modules using WCGNA and evaluated the most significant module. On the other hand, we constructed and analysed subtype-specific gene regulatory networks by integrated expression profiles/methylation profiles and TF-target/miRNA-target pairs.
Figure 1. Flowchart of the analysis of the integration of DNA methylation and expression data for mRNA as well as miRNA
Differentially expressed and methylated gene/miRNA identification and module detection
CoMEx is a statistical test similar to t-test; it uses the fudge factor for integrating the expression and methylation profiles of the transcripts and then generating DEM transcripts (see Materials and Methods). Using the CoMEx analysis, we identified 2739 DEM genes and 28 DEM miRNAs (CoMEx, p-value<0.05) by comparing experimental samples versus control samples. To explore the functional organization of these significant (DEM) molecules, we used WGCNA to detect gene and miRNA modules. Firstly, the integrated expression levels and methylation values of the significant genes and miRNAs were taken as input for the WGCNA. In this study, we compared NSE with SE to identify TGCT subtype-specific features. According to ), we chose the power 3 that was best fit for the scale-free topology. Twenty-three modules were identified ()), which demonstrated that the molecules could be effectively organized into modules that integrated expression and DNA methylation values. The topmost module has the highest correlation (‘greenyellow’ module) consisting of 41 molecules. We constructed the co-expression network for this module with PCC cut-off 0.6 (). Among the 41 molecules, 39 were up-regulated and 2 were down-regulated (). Silhouette Width plot for NSE versus SE is shown in . The x-axis denotes Silhouette Width ([0, Citation1]), and the y-axis denotes each individual cluster. The average Silhouette Width is obtained as 0.01. Other clustering validity index measurements such as Clustering Co-efficient, Dunn Index, Heterogeneity, Maximum Adjacency Ratio (MAR), average Scaled Connectivity were 0.023, 0.843, 0.369, 0.026, and 0.34, respectively, as shown in .
Table 1. Up-regulated and down-regulated genes in ‘greenyellow’ module (NSE versus SE, |logFC| >0.5)
Table 2. Different cluster validity index measures during the module detection through average linkage clustering
Figure 2. Differentially expressed and methylated (DEM) module analysis in two subtypes: non-seminoma (NSE) and seminoma (SE). a. Soft threshold power for NSE versus SE. The first sub-figure (left) presents soft threshold (power) (in x-axis) versus scale-free topology fit, signed R^2 (in y-axis) plot, where the red horizontal line signifies the lower borderline of the standard value of scale-free topology fit, signed R^2 to maintain the scale-free topology. In this study, we obtained power 3 for this purpose. The second sub-figure (right) denotes soft threshold (power) (in x-axis) versus mean connectivity (in y-axis) plot. b. Gene dendrogram and module colours for NSE versus SE obtained by using dynamic tree cut method. The entire tree is cut at default height (0.99). Each colour signifies an individual resultant module
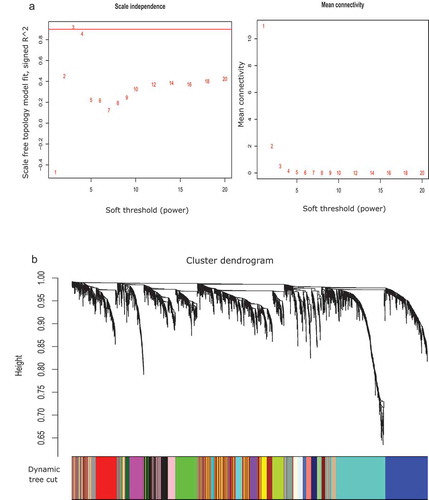
Figure 3. Co-expression module (‘greenyellow’ module, PCC: 0.6). Each node denotes an individual biomolecule where each edge signifies that the connecting node-pair has significant PCC (>0.6 or <-0.6). Insignificant PCC (0.6 or
-0.6) between any node-pair signifies that there is no connecting edge between the node-pair
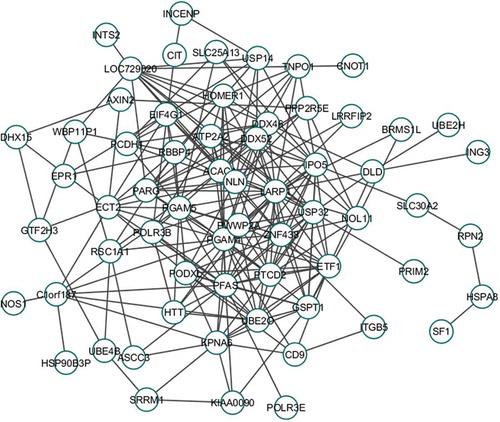
Figure 4. Silhouette Width plot for NSE versus SE. The x-axis denotes Silhouette Width ([0, 1]) and y-axis denotes each individual cluster. The average Silhouette Width is obtained as 0.01
![Figure 4. Silhouette Width plot for NSE versus SE. The x-axis denotes Silhouette Width ([0, 1]) and y-axis denotes each individual cluster. The average Silhouette Width is obtained as 0.01](/cms/asset/b52eaef0-bbd1-4ac3-bae1-608d6a720ec1/kepi_a_1790108_f0004_b.gif)
Subtype-specific regulatory network analysis
We evaluated the TF-target gene pairs and miRNA-target gene pairs with PCC cut-off 0.3, and p-value <0.05. Of note, the TFs, miRNAs and target genes in our regulation pairs were significant genes and miRNAs (). As TFs may activate or suppress their target genes while miRNAs suppress their target genes, we retained TF-target gene pairs with a |PCC| greater than 0.3, while miRNA-target gene pairs with a PCC less than −0.3. The number of regulations is shown in . For NSE, there were 72 TF-target gene pairs, including 25 unique TFs and 61 unique target genes and 97 miRNA-target gene pairs, including 7 unique miRNAs and 63 unique target genes, respectively. For SE, there were 64 TF-target gene pairs including 24 unique TFs and 55 unique target genes, and 25 miRNA-target gene pairs including 6 unique miRNAs and 25 unique target genes. We constructed subtype-specific regulatory networks for NSE and SE, respectively.
Table 3. Statistics of regulation pairs in TGCT NSE and SE subtypes (PCC > 0.6, p-value <0.05)
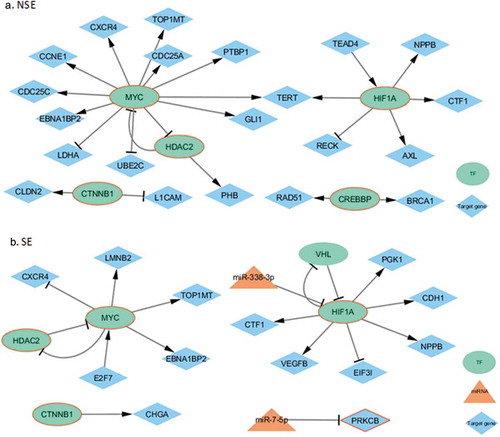
Figure 5. Subtype-specific regulatory networks related to Thyroid hormone signalling pathway. The molecules with red borders were related to the pathway. (a) The mentioned NSE-specific network. (b) The mentioned SE-specific network
For the NSE subtype-specific regulatory network, 142 nodes including 25 TFs, 7 miRNAs, and 120 target genes along with 169 edges were found. Among them, four were hub miRNAs and another four were hub genes. Among these four hub genes, two were TFs and the remaining two were target genes. The four top miRNAs, miR-520b, miR-520 c-3p, 182–5p, and miR-7-5p, were onco-miRNAs for various kinds of cancer including hepatocellular carcinoma, breast cancer, glioblastoma (GBM) and many more [Citation21–23]. They all had higher out-degree, but no in-degree. The out-degree of them was 32, 28, 21, and 11, respectively. The top two TFs, SP1, and MYC, were both oncogenes. They had high out-degree (16 of SP1 and 12 of MYC), and low in-degree (1 of both genes). The top two target genes, TERT and RECK (in-degree 5 for both), were oncogenes.
For the SE-specific regulatory network, 103 nodes including 24 TFs, 6 miRNAs and 73 target genes along with 89 links were identified. Among these molecules, two miRNAs and five TFs were detected as hub. Also three target genes were selected as hubs from 73 target genes. The top two miRNAs, miR-182-5p and miR-338-3p, were onco-miRNAs for different kinds of cancer, including renal cell carcinoma, glioblastoma (GBM), osteosarcoma cells, gastric cancer, and many more. They had higher out-degree (16 and 4, respectively), but no in-degree. Hence, these two miRNAs made more sense than the other molecules. The top three target genes, CDH1, CXCR4, and SNAI1 had the higher in-degree (4, 3, and 3), but no out-degree. Among them, CDH1 and CXCR4 were oncogenes. Three TFs, SP1, HNF1A, and ETS1 had higher out-degree (16, 8, and 5, respectively), but no in-degree. Hence, these three TFs are extremely important.
Pathway analysis
KEGG pathway enrichment analysis was conducted by an online tool Database for Annotation, Visualization and Integrated Discovery (DAVID) [Citation24]. There were 27 and 8 significant KEGG pathways (p < 0.05) enriched in NSE and SE, respectively. Interestingly, we found five enriched pathways that were shared by these two subtypes. They are Pathways in cancer (p = 5.30E-07 for NSE and p = 2.38E-05 for SE), Adherens junction (p = 1.84E-05 for NSE and p = 2.34E-02 for SE), Transcriptional misregulation in cancer (p = 3.60E-03 for NSE and p = 3.20E-03 for SE), Thyroid hormone signalling pathway (p = 4.60E-02 for NSE and p = 1.69E-02 for SE), and Thyroid cancer (p = 4.59E-02 for NSE and p = 2.59E-02 for SE).
Interestingly, with BH correction of p-values, the number of resultant entities for differential analysis or pathway analysis became very low. For differential analysis, we obtained very small number of DEM features (especially, number of DEM miRNAs). Similarly, for pathway analysis, we identified very small number of significant genes/miRNAs (i.e., only 9 BH corrected KEGG pathways for NSE analysis, and only one BH corrected KEGG pathway for SE analysis according to ). Therefore, we considered only p-value without any correction to perform the entire analysis.
Table 5. KEGG pathway enrichment analysis of subtype-specific regulatory network genes using DAVID
Discussion
We constructed subtype-specific regulatory networks for NSE and SE subtypes. There were 142 nodes (25 TFs, 7 miRNAs, and 120 target genes) and 169 links in the NSE-specific regulatory network, while there were 103 nodes (24 TFs, 6 miRNAs, and 73 target genes) and 89 links in the SE-specific regulatory network. We identified four hub miRNAs and four hub genes (two TFs and two target genes) in the NSE-specific regulatory network, and two hub miRNAs and 8 hub genes (five TFs and three target genes) in the SE-specific regulatory network. One miRNA (miR-182-5p) and two genes (SP1 and MYC) were hubs for both of the two subtypes. We explored these hubs and their regulations in our analysis.
In the NSE network, the top four miRNAs (miR-520b, miR-520 c-3p, 182–5p, and miR-7-5p) were onco-miRNAs of many kinds of cancer, including breast cancer, glioblastoma (GBM), hepatocellular carcinoma, and so on [Citation21–23]. They had maximum out-degree (32, 28, 21, and 11, respectively) and no in-degree (). We sorted the miRNA-target gene pairs according to their absolute PCC value. The top five target genes of miR-520b were RPS6KA1, PON2, ASH1 L, DENND5B, and OPCML. The top five target genes of miR-520 c-3p were RPS6KA1, PON2, DENND5B, ASH1 L, and OPCML. The top five target genes of miR-185-5p were NF1, RECK, CADM1, THBS2, and VCL. The top five target genes of miR-7-5p were BTN2A2, PRDM6, RNF144A, ST3GAL5, and CTSK.
Table 4. Hubs in subtype-specific regulatory networks with respect to in-degree and out-degree centralities
In the NSE network, the top two TFs (SP1 and MYC) were oncogenes and had maximum out-degree (16 and 12, respectively) and in-degree of 1 (). Of the top five regulations for SP1, three target genes (TMPO, ATP2A2, and FGFR1) were activated, and two (OPN1LW and MC4 R) were suppressed. SP1 was activated by another TF ETS1. Of the top five regulations, MYC activated four target genes (TERT, CDC25A, TOP1MT, and PTBP1), while it only regressed one target gene (LDHA). MYC was suppressed by another TF HDAC2. SP1 (Sp1 Transcription Factor) is a zinc finger transcription factor that binds to GC-rich motifs of many promoters. The encoded protein is involved in many cellular processes, including cell differentiation, cell growth, apoptosis, and immune responses, responding to DNA damage, and chromatin remodelling (must provide scientific evidence). SP1 plays an important role during the tumour development, which can activate or suppress the expression of many oncogenes and tumour suppressor genes (TSGs) [Citation26]. MYC (MYC Proto-Oncogene, BHLH Transcription Factor) is a proto-oncogene. Its encoded product plays a role in cell cycle progression, apoptosis, and cellular transformation. MYC is also a telomerase activity-related gene, as was shown in our previous study [Citation8].
In the NSE network, the top two target genes (TERT and RECK) had maximum in-degree of, and both were oncogenes. Four TFs (MYCN, MYC, MAX, and HIF1A) activated TERT, while one TF (ETS1) suppressed TERT (). It was worth mentioning that MYCN was an important paralog of MYC, and MAX (MYC Associated Factor X) was also a TF that is related to MYC. Therefore, we believed that these three regulation pairs (MYC-TERT, MYCN-TERT, and MAX-TERT) played critical roles for NSE. RECK was activated by SP1, while regressed by three miRNAs (miR-520b, miR-520 c-3p, and miR-182-5p) and a TF (HIF1A). TERT (Telomerase Reverse Transcriptase) is a telomerase activity-related gene, and deregulation of telomerase expression in somatic cells may be involved in oncogenesis. We also found that TERT played important roles for TGCT in our previous study [Citation8]. RECK (Reversion Inducing Cysteine Rich Protein with Kazal Motifs) is suppressed strongly in many tumours and cells transformed by various kinds of oncogenes, and its down-regulation by oncogenic signals may facilitate tumour invasion and metastasis.
In the SE network, the top two miRNAs (miR-182-5p, and miR-338-3p) were onco-miRNAs for many types of cancer, including glioblastoma (GBM), gastric cancer, renal cell carcinoma, osteosarcoma cells, and so on. They had maximum out-degree (16 and 4, respectively) and no in-degree (). The top five target genes repressed by miR-182-5p were RHOJ, CREB3L1, SLC1A1, OSBPL10, and CADM1. The four target genes repressed by miR-338-3p were SOX4, SLC22A23, HIF1A, and TOM1. We have discussed miR-182-5p, as it was also a hub for the NSE network. miR-338-3p was reported to be related to several types of cancer, such as GBM, cervical cancer, and gastric cancer.
In the SE network, the top five TFs (SP1, HNF1A, HIF1A, MYC, and ETS1) had the maximum out-degree (16, 8, 7, 5, and 5, respectively) and only two TFs (HIF1A and MYC) had in-degree of 2, while the other three TFs had no in-degree (). Among these five TFs, SP1 and MYC were also hubs in the NSE network, as we discussed above. In the top five regulations, SP1 activated two target genes (GLI1 and LAMC2), while suppressed three target genes (TNFSF13, CYP27A1, and LYZ). Among the top five regulations, HNF1A activated three target genes (CLDN2, S100G, and NEUROG3) as well as suppressed two target genes (SLC22A9 and SNAI1). In the top five regulations, HIF1A activated four target genes (VEGFB, NPPB, PGK1, and CDH1) while suppressed VHL. In the meanwhile, HIF1A was suppressed by a miRNA (miR-338-3p) and a TF (VHL). MYC activated five target genes (EBNA1BP2, TOP1MT, and LMNB2, CXCR4, and HDAC2). MYC was activated by E2F7, while suppressed by HDAC2. ETS1 activated four target genes (TBXAS1, CSF3 R, SPRY2, and THBD) and suppressed SNAI1. Because SP1 and MYC were also the hubs in the NSE network, we discussed the other three TFs. HNF1A (HNF1 Homeobox A) and HIF1A (Hypoxia Inducible Factor 1 Subunit Alpha) were oncogenes. ETS1 (ETS Proto-Oncogene 1, Transcription Factor) was also an oncogene.
In the SE network, the top three target genes (CDH1, CXCR4, and SNAI1) had the maximum in-degree (4, 3, and 3) (), among which CDH1 and CXCR4 were oncogenes. CDH1 was activated by HIF1A and GATA3, while it was suppressed by KDM5A and SNAI2. CXCR4 was activated by KLF5 and VHL, while it was suppressed by MYC. SNAI1 was suppressed by three TFs (HNF1A, ETS1, and HMGA2). CDH1 (Cadherin 1) and CXCR4 (C-X-C Motif Chemokine Receptor 4) were oncogenes. SNAI1 (Snail Family Transcriptional Repressor 1) was important mesoderm formation in the developing embryo.
We performed KEGG pathway enrichment analysis using the online tool DAVID [Citation18]. We identified 27 and 8 significantly enriched pathways for NSE and SE, respectively (). Five pathways were enriched in both subtypes, including Pathways in cancer, Transcriptional misregulation in cancer, Adherens junction, Thyroid cancer, and Thyroid hormone signalling pathway. Interestingly, Thyroid hormone signalling pathway was enriched in both NSE and SE networks. It was reported that thyroid hormone was important for testicular development and function [Citation27]. We therefore explored the subtype-specific regulatory networks related to thyroid hormone signalling pathway for NSE and SE, as shown in . Of note, ellipse, triangle, and diamond in the figure refer to TF, miRNA, and target gene, respectively. The molecules with read borders were related to the pathway under consideration. Four TFs (MYC, HIF1A, HDAC2, and CTNNB1) in this pathway regulated target genes, among which MYC and HIF1A regulated the expression levels of many target genes. This result suggested that these two TFs might have played critical roles in both NSE and SE.
In our proposed work, our main aim is to identify hub molecules (miRNAs, genes, and TFs) from each of the two kinds of networks, NSE-specific regulatory network and SE-specific regulatory network, by integrating TCGT expression and methylation data through the consecutive utilization of statistical, clustering, and network analysis. As a result, we identified four hub miRNAs (miR-182-5p, miR-520b, miR-520c-3p, and miR-7-5p), two hub TFs (MYC and SP1), and two genes (RECK and TERT) in the NSE-specific regulatory network, while for the SE-specific regulatory network, we obtained two hub miRNAs (miR-182-5p and miR-338-3p), five hub TFs (ETS1, HIF1A, HNF1A, MYC, and SP1), and three hub genes (CDH1, CXCR4, and SNAI1). To assess the reliability of the results, we focused on the hubs, which are highly connected and unlikely false-positive results, and also the enriched pathways, as well as literature evidence. In pathway enrichment analysis, we focus on the set of genes from our analysis; therefore, the false signal from one molecule would be reduced. We also found the hubs (miRNAs and genes) have been extensively supported by literature evidence. For example, those top four miRNAs (miR-520b, miR-520c-3p, 182–5p, and miR-7-5p) were reported as onco-miRNAs in many cancer types, such as breast cancer, glioblastoma, and hepatocellular carcinoma [Citation21–23]. Furthermore, the top two target genes (TERT and RECK) were oncogenes and TERT was reported to play a significant role in TGCT [Citation8]. In pathway analysis, we first used the normal p-value for each enriched pathway. When we further adjusted the p-value by Benjamini-Hochberg procedure, there were 9 KEGG pathways for NSE and only one KEGG pathway for SE that remained significant. Finally, we can validate these findings by using simulation data and also experiments. For simulation, we can randomly select a similar number of genes, miRNAs, and TFs as we found in NSE and SE analysis, and then perform the network analysis. This procedure will repeat many times (e.g., 100 or 1000) to obtain an empirical p-value. However, such a procedure is complicated as selection of random data should be in caution [Citation28,Citation29]. For experimental validation, we can use gene-editing technology to knock in or knock out of the critical hub molecules in cell lines or animal models and then perform genome-wide gene expression and methylation to examine the altered change.
Conclusions
TGCTs were a well-known malignant disease. A lot of studies had been conducted regarding TCGT. In this study, we performed an extensive analysis to extract the functional co-methylation and co-expression gene/miRNA modules for the TCGT subtypes, NSE and SE, through the integration of the gene/miRNA expression and methylation profiles. First of all, DNA methylation profile and mRNA/miRNA expression data were integrated using a latest score INTcon, and then applied CoMEx score along with the corresponding p-value to identify DEM genes/miRNAs. After that, we generated functional co-methylation and co-expression modules of those molecules for the integrated profile of these DEM genes/miRNAs through WGCNA method. The topmost module with the maximum average PCC comprised of 91 molecules. The cluster validity index measures were also provided to evaluate the quality of the clustering used in WGCNA. In addition, we chose the TF-target gene pairs and miRNA-target gene pairs with p-value cut-off of 0.05 and PCC cut-off of 0.6. We built NSE subtype-based regulatory network as well as SE subtype-based network. We obtained four hub miRNAs and four hub genes for NSE-specific regulatory network. These four hub miRNAs were miR-520b, miR-520c-3p, miR-182-5p, and miR-7-5p that were basically onco-miRNAs for various kinds of cancer including hepatocellular carcinoma, breast cancer, GBM, etc. They all had higher out-degree (32, 28, 21, and 11, respectively), but zero in-degree. Among these four hub genes, two were TFs, SP1, and MYC that were also oncogenes, whereas remaining two, TERT and RECK, were target genes. The out-degrees of these two TFs were 16 and 12, respectively. The in-degree of these two target genes were 5 for both, while out-degree of them was zero for both. These two target genes were also oncogenes. On the other hand, in case of the SE-specific network, we identified two hub miRNAs and eight hub genes. Those miRNAs were miR-182-5p and miR-338-3p that were also onco-miRNAs of different kinds of cancer. They had higher out-degree (16 and 4, respectively), but zero in-degree. Thus, these two miRNAs made more sense than the other molecules. Among those hub genes, five (SP1, HNF1A, HIF1A, MYC, and ETS1) were TFs and three (CDH1, CXCR4, and SNAI1) were target genes. Those three target genes had the higher in-degree (4, 3, and 3, respectively), but zero out-degree. Among them, CDH1 and CXCR4 were oncogenes. Among these five TFs, three (SP1, HNF1A, and ETS1) had higher out-degree (16, 8, and 5, respectively), but without any in-degree. Hence, these three TFs might be interesting. Interestingly, a miRNA (miR-182-5p) and two genes (SP1 and MYC) were common hubs obtained from both these subtypes.
Furthermore, we conducted KEGG pathway analysis, and five pathways (Pathways in cancer, Transcriptional misregulation in cancer, Adherens junction, Thyroid cancer, and Thyroid hormone signalling pathway) were found to be significantly enriched in both these subtypes. In conclusion, this work indicates that our method is highly useful to extract potential gene/miRNA modules as well as hubs for any kind of disease. In the future, we will extend it by integrating more multi-omics profiles to identify hub molecules and evaluate the true positives by using simulation data as well as by experiments.
Materials and methods
Data retrieval and pre-process
Clinical information
We downloaded the TGCT patient clinical pathological information from TCGA (https://xenabrowser.net/datapages/? cohort = TCGA%20Testicular%20Cancer%20(TGCT), accessed date: 20 October 2017). There were a total of 156 samples in the original clinical data file. We filtered the data with the following two conditions as indicated in our previous study [Citation8]: (i) range of the age of the patient between 18 and 45; and (ii) the samples that were histologically defined as NSE or SE based on TCGA clinical data. This resulted in the determination of 48 NSE samples and 55 SE samples, respectively.
Expression profiles
Both of the gene expression and miRNA expression profiles of the patient samples presented above were downloaded from TCGA. For miRNA expression profile, we removed the miRNAs with missing value of more than 10% of the samples. We normalized the gene and miRNA expression levels using standard normalization technique.
Methylation profile
The DNA methylation profile of the patient samples was downloaded from TCGA. DNA methylation profile was measured experimentally using the Illumina Infinium HumanMethylation450 platform, and beta value was calculated for each array probe in each sample via BeadStudio software. We removed the probes with NA values. Furthermore, for the multiple to multiple mapping of probes and genes, we calculated the DNA methylation values for gene level using Principal Component Analysis (PCA). Finally, the DNA methylation values were normalized with z-score.
Transcriptional regulations
We extracted TF-gene pairs from TRANSFAC database [Citation30] (released on 6 April 2016) which provides a comprehensive TF-target relation. There were 12,906 TF-target gene pairs having a total of 901 unique TFs and a total of unique 3,354 unique target genes. Of note, a subset of the target genes was denoted as TFs.
Post-transcriptional regulations
We selected three reliable miRNA-target prediction databases, TargetScan [Citation31] (release 7.1, June 2016), miRanda [Citation32] (released on August 2010), and PITA [Citation33] (released on 9 December 2010). Furthermore, we extracted miRNA-target pairs from miRTarBase [Citation34] (released version 7.0 on 15 September 2017) where the data were curated from low- and high-throughput experimental procedures. Moreover, we retained the pairs if they were present in at least two databases, which resulted in the identification of 170,544 miRNA-target pairs having a total of 697 unique miRNAs and a total of unique 12,507 target genes. Of note, a subset of the target genes was denoted as TFs.
Identification of differentially expressed and methylated (DEM) genes/miRNAs
We extracted differentially expressed and methylated (DEM) genes/miRNAs according to the approach in a previous study [Citation13]. Since there were no tumour-matched normal samples, we defined DEM genes/miRNAs as those with significantly different expression levels and methylation levels between NSE group and SE group. In brief, we firstly normalized the gene/miRNA expression values and DNA methylation values with zero-mean normalization. Then, we integrated these two matrices into a single matrix using INTcon measure [Citation13].
CoMEx score and corresponding p-value [Citation13] were calculated from the integrated singular matrix for each gene/miRNA. Those genes/miRNAs having p-value less than 0.05 were defined as DEM genes/miRNAs. We discovered functional co-methylation and co-expression modules of molecules for these DEM genes/miRNAs based on their combined scores (INTcon values) using WGCNA (Weighted correlation network analysis). The INTcon score and CoMEx score are briefly described below.
Given that up-regulated, down-regulated, hyper-methylated and hypo-methylated genes are termed as DEup, DEdown, DMhyper, and DMhypo, respectively, the combinatorial patterns of these differential conditions in between the expression and methylation scores are (a) (DEup & DMhypo), (b) (DEdown & DMhyper), (c) (DEup & DMhyper), and (d) (DEdown & DMhypo). As high methylation tends to have low gene expression, while low methylation activates gene expression level, we considered only the inversely correlated patterns [(a) and (b)]. The gene expression profile is initially normalized using zero-mean normalization. Similarly, the methylation data is then normalized. Then, INTcon score between two features is computed through the following way: INTcon(i,j) = const*0.5*|NIexp(i,j)- NImethyl(i,j)|, where ‘|.|’ denotes the absolute score, ‘NIexp’ and ‘NImethyl’ are the normalized expression and normalized methylation scores, respectively. Whenever a gene falls into the pattern (DEup & DMhypo) or (DEdown & DMhyper), ‘const’ is ‘1’ else ‘0.’
CoMExi score of a gene i signifies the ratio of the difference in average value of group 1 and group 2 (i.e., avg(INTcon1)-avg(INTcon2)) to the sum of the standard error of the means of these two groups (termed as ‘stdei’). A positive constant value (denoted as ‘ꞓ’) is for continuous dataset, in which each data value of the gene towards a sample signifies the integrated score of its (normalized) methylation and (normalized) gene expression scores estimated depending upon the inverse association between them: CoMExi = (avg(INTcon1)-avg(INTcon2))/(stdei + ε). This score is equivalent to t-statistics and inspired by Significant Analysis of Microarrays (SAM) [Citation35,Citation36].
Gene module detection
After extracting the DEM genes and DEM miRNAs, we applied well-known R tool, WGCNA [Citation16] to determine gene/miRNA modules. We also presented the soft threshold power selection plot, and dendrogram plot using dynamic tree cut method. In addition, we evaluated various cluster validity index measures such as Dunn Index, Silhouette Width, Clustering Co-efficient, etc., for the corresponding clustering.
Regulatory property analysis
In addition, we analysed the regulatory properties of these significant genes and miRNAs. We evaluated the transcriptional regulation pairs, i.e., TF-target gene pairs, and post-transcriptional pairs, i.e., miRNA-target gene pairs, for these significant genes and miRNAs with PCC (Pearson Correlation Coefficient). We constructed subtype-specific regulatory networks for NSE and SE, and identified hub nodes based on their in-degree and out-degree, by extending the hub concept introduced by Yu et al. [Citation37]. Finally, the workflow of the proposed pipeline is represented in .
Acknowledgments
We thank the lab members of Bioinformatics and Systems Medicine Laboratory (BSML) for their valuable discussion on this project.
Disclosure statement
The authors report no conflict of interests.
Additional information
Funding
References
- Shen H, Shih J, Hollern DP, et al. Integrated molecular characterization of testicular germ cell tumors. Cell Rep. 2018;23(11):3392–3406.
- Litchfield K, Levy M, Orlando G, et al. Identification of 19 new risk loci and potential regulatory mechanisms influencing susceptibility to testicular germ cell tumor. Nat Genet. 2017;49(7):1133–1140. .
- Vasdev N, Moon A, Thorpe AC. Classification, epidemiology and therapies for testicular germ cell tumours. Int J Dev Biol. 2013;57(2–4):133–139.
- Costa AL, Lobo J, Jeronimo C, et al. The epigenetics of testicular germ cell tumors: looking for novel disease biomarkers. Epigenomics. 2017;9(2):155–169.
- Litchfield K, Levy M, Huddart RA, et al. The genomic landscape of testicular germ cell tumours: from susceptibility to treatment. Nat Rev Urol. 2016;13(7):409–419. .
- Buljubasic R, Buljubasic M, Bojanac AK, et al. Epigenetics and testicular germ cell tumors. Gene. 2018;661:22–33.
- Facchini G, Rossetti S, Cavaliere C, et al. Exploring the molecular aspects associated with testicular germ cell tumors: a review. Oncotarget. 2018;9(1):1365–1379. .
- Sun H, Kim P, Jia P, et al. Distinct telomere length and molecular signatures in seminoma and non-seminoma of testicular germ cell tumor. Brief Bioinform. 2018;20(4):1502–1512. .
- Qin G, Mallik S, Mitra R, et al. MicroRNA and transcription factor co-regulatory networks and subtype classification of seminoma and non-seminoma in testicular germ cell tumors. Sci Rep. 2020;10(1):852. .
- Jones PA. Functions of DNA methylation: islands, start sites, gene bodies and beyond. Nat Rev Genet. 2012;13(7):484–492.
- Jiao YM, Widschwendter M, Teschendorff AE. A systems-level integrative framework for genome-wide DNA methylation and gene expression data identifies differential gene expression modules under epigenetic control. Bioinformatics. 2014;30(16):2360–2366.
- Zhang J, Huang K. Pan-cancer analysis of frequent DNA co-methylation patterns reveals consistent epigenetic landscape changes in multiple cancers. BMC Genomics. 2017;18(Suppl 1):1045.
- Bandyopadhyay S, Mallik S. Integrating multiple data sources for combinatorial marker discovery: a study in tumorigenesis. IEEE/ACM Transactions on Computational Biology and Bioinformatics. Volume: 15, Issue: 2, page: 673–687, 2016
- Mallik S, Mukhopadhyay A, Maulik U, et al., Integrated analysis of gene expression and genome-wide DNA methylation for tumor prediction: an association rule mining-based approach. Computational Intelligence in Bioinformatics and Computational Biology (CIBCB), 2013 IEEE Symposium on; 2013:Singapore, Singapore, IEEE.
- Maulik U, Mallik S, Mukhopadhyay A, Bandyopadhyay, S. Analyzing large gene expression and methylation data profiles using StatBicRM: statistical biclustering-based rule mining. PLoS One. 2015;10(4):e0119448.
- Ma X, Liu Z, Zhang Z, et al. Multiple network algorithm for epigenetic modules via the integration of genome-wide DNA methylation and gene expression data. BMC Bioinformatics. 2017;18(1):72. .
- Hao X, Luo H, Krawczyk M, et al. DNA methylation markers for diagnosis and prognosis of common cancers. Proc Natl Acad Sci U S A. 2017;114(28):7414–7419. .
- Bhadra T, Mallik S, Bandyopadhyay S. Identification of multi-view gene modules using mutual information based hypograph mining. IEEE Trans Syst Man Cybern Syst. 2019;49(6):1119–1130.
- Mallik S, Zhao Z. Graph- and rule-based learning algorithms: a comprehensive review of their applications for cancer type classification and prognosis using genomic data. Brief Bioinform. 2019;21(2):368–394.
- Langfelder P, Horvath S. WGCNA: an R package for weighted correlation network analysis. BMC Bioinformatics. 2008;9(1):559.
- Jiang QH, Wang YD, Hao YY, et al. miR2Disease: a manually curated database for microRNA deregulation in human disease. Nucleic Acids Res. 2009;37:D98–D104.
- Ruepp A, Kowarsch A, Theis F. PhenomiR: microRNAs in human diseases and biological processes. Methods Mol Biol. 2012;822:249–260.
- Li Y, Qiu C, Tu J, et al. HMDD v2.0: a database for experimentally supported human microRNA and disease associations. Nucleic Acids Res. 2014;42(Databaseissue):D1070–4.
- Jiao X, Sherman BT, Huang da W, et al. DAVID-WS: a stateful web service to facilitate gene/protein list analysis. Bioinformatics. 2012;28(13):1805–1806. .
- Benjamini YYH. Controlling the false discovery rate: A practical and powerful approach to multiple testing. J R Stat Soc. 1995;57(1): 12. Series B.
- Beishline K, Azizkhan-Clifford J. Sp1 and the ‘hallmarks of cancer’. Febs J. 2015;282(2):224–258.
- Wagner MS, Wajner SM, Maia AL. The role of thyroid hormone in testicular development and function. J Endocrinol. 2008;199(3):351–365.
- Jia P, Zheng S, Long J, et al. dmGWAS: dense module searching for genome-wide association studies in protein-protein interaction networks. Bioinformatics. 2011;27(1):95–102.
- Jia P, Zhao Z. VarWalker: personalized mutation network analysis of putative cancer genes from next-generation sequencing data. PLoS Comput Biol. 2014;10(2):e1003460.
- Matys V, Kel-Margoulis OV, Fricke E, et al. TRANSFAC and its module TRANSCompel: transcriptional gene regulation in eukaryotes. Nucleic Acids Res. 2006;34(Databaseissue):D108–10. .
- V, Bell GW, Nam JW, et al. Predicting effective microRNA target sites in mammalian mRNAs. Elife. 2015;4:e05005.
- Betel D, Wilson M, Gabow A, et al. The microRNA.org resource: targets and expression. Nucleic Acids Res. 2008;36(Databaseissue):D149–53. .
- Kertesz M, Iovino N, Unnerstall U, et al. The role of site accessibility in microRNA target recognition. Nat Genet. 2007;39(10):1278–1284. .
- Hsu SD, Lin FM, Wu WY, et al. miRTarBase: a database curates experimentally validated microRNA-target interactions. Nucleic Acids Res. 2011;39(Database issue):D163–9. .
- Tusher VG, Tibshirani R, Chu G. Significance analysis of microarrays applied to the ionizing radiation response. Proc Natl Acad Sci U S A. 2001;98(9):5116–5121.
- Mallik S S., Mukhopadhyay A. A Survey and Comparative Study of Statistical Tests for Identifying Differential Expression from Microarray Data. IEEE/ACM Trans Comput Biol Bioinform. 2014;11(1):95–115.
- Yu H, Greenbaum D, Lu H X, et al. Genomic analysis of essentiality within protein networks. Trends Genet. 2004;20(6):227–231. .