
ABSTRACT
Cardiac remodelling is widely accepted as a common characteristic for many heart diseases, especially in heart failure (HF). Ischaemic cardiomyopathy (ICM) and dilated cardiomyopathy (DCM) are associated with cardiac remodelling. Both mRNA and microRNA are potential diagnostic markers and therapeutic targets of cardiac remodelling in HF. However, the mechanisms of microRNA-mRNA joint regulation in HF are still unclear. In this study, 3 gene expression profiles from patients with and without HF were analysed to harvest shared differentially expressed genes (microRNA and mRNA) with significant major biological function. Moreover, key genes highly related to ICM and DCM-induced HF were screened out through a Weighted Genes Co-Expression Network Analysis (WGCNA). Based on microRNA-mRNA analysis, several microRNAs and target genes were identified. Combined with pathway analysis, we found that miR-542-3p and its target gene CILP were likely involved in the regulation of TGF-β signalling pathway in ICM induced HF. Collectively, the microRNA–mRNA interaction network analysis revealed that miR-542-3p-CILP as mediator of TGF-β signalling pathway might be a new mechanism to mediate ICM induced HF. This study provides certain novel targets for diagnosis and therapeutic treatment of ICM- and DCM-induced HF.
Introduction
Heart failure (HF) is a complex clinical syndrome causing morbidity and mortality in patients all around the world. The long-term HF can result in structural and functional impairments including dysfunction of ventricle, reduction of ejection fraction, and deterioration of cardiac performance [Citation1]. Cardiac remodelling refers to the changes of heart in shape and size that occurs in response to cardiac damage or cardiac disease, and encompasses many changes associated with progressive myocardial fibrosis, caused by excessive accumulation of extracellular matrix (ECM) proteins in the interstitium and perivascular myocardium. Myocardial fibrosis is one of the significant markers of myocardial remodelling [Citation2]. Ischaemic cardiomyopathy (ICM) and dilated cardiomyopathy (DCM) are subjected to HF. Increasing evidence shown the crucial role of collagen accumulation, myocardial fibrosis, and myocyte lengthening in the development of cardiac remodelling in ICM [Citation3]. In addition, extensive research has revealed that collagen overproduction and myocyte lengthening are resulted from the reactive growth of myocyte cell and structural rearrangement of myocardium muscle, which can cause ventricular remodelling in DCM [Citation4]. ICM has a worse prognosis than DCM. However, the heterogeneous biological mechanisms underlying ICM- and DCM-induced HF are still unclear.
Extracellular matrix (ECM) and myofibrils undergo various changes like biochemical composition and molecular structure in HF. The previous documents have demonstrated that ECM excessive deposition is a critical inducement in the progression of cardiac fibrosis from cardiac stress overload [Citation5], which further leads to pathological myocardial remodelling and accelerates the progression to HF. Recently, several signalling pathways affecting gene transcription, protein translation, and metabolism have been reported, such as cAMP-AKAP signalling pathway [Citation6], Wnt signalling pathway [Citation7], TGF-β signalling pathway [Citation8,Citation9], PI3K signalling pathway [Citation10], and mTOR signalling pathway [Citation11], they are all involved in regulation of ECM remodelling and cardiac fibrosis. Especially, transforming growth factor-β1 (TGF-β1) can regulate TGF-β signalling pathway to promote cardiac remodelling and heart failure development, and cardiac fibrosis is characterized by TGF-β1-mediated α-smooth muscle actin (α-SMA) up-regulation. However, the underlying mechanism through TGF-β signalling pathway in ICM- and DCM-induced HF is still not fully understood.
MicroRNAs (miRNAs), small non-coding RNAs, work as critical regulators in the development of diverse growth progress involved in more than 30% of genes [Citation12] through inhibiting target mRNA translation or promoting mRNA cleavage. Recently, many miRNAs are verified differentially expressed in chronic HF [Citation13,Citation14], such as miR-29, miR-21, miR-133, miR-29, miR-30, miR-18, and miR-19. The miR-15 family [Citation15] was confirmed as a novel regulator of cardiac fibrosis through repressing TGF-β signalling pathway via targeting TGFBR1. However, the linkage between miRNAs and mediators of TGF-β signalling pathway in ICM- and DCM-induced HF is largely unknown.
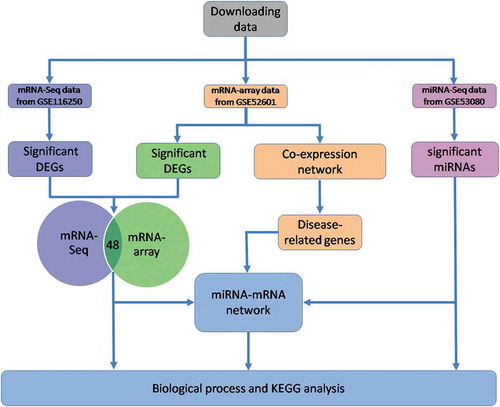
In this study, we analysed RNA-Seq profile and Microarray profile of mRNAs to screen out the shared significant genes as the targets in HF. The RNA-Seq profile of miRNAs in 12 patient samples (matched with microarray) was also used to obtain the significant genes. The miRNA-mRNA network was further constructed to identify hub genes and critical miRNAs in HF. All harvested significant genes were analysed in depth to search relevant signalling pathways associated with HF. In addition, Weighted Genes Co-Expression Network Analysis (WGCNA) based on 24 sample Microarray profiles was performed to obtain genes highly associated with HF (disease-related genes). The mRNAs and miRNAs of ICM are processed parallel with these of DCM. The schematic diagram of the data analysis is shown in . Therefore, this study will provide comprehensive and systematic biological information as well as reliable evidence to identify the new pathogenesis and potential therapeutic targets for HF caused by ICM and DCM.
Figure 1. The schematic diagram of the data analysis
Methods
Raw data and software packages
Raw miRNA-Seq, expression matrix of mRNA-Seq, and mRNA-array were downloaded from GEO (https://www.ncbi.nlm.nih.gov/geo/) database through GEO accession number from the published literatures [Citation1,Citation16] in PUBMED (https://www.ncbi.nlm.nih.gov/pubmed/). The expression matrix of mRNA-Seq is source from 12 left ventricular tissue samples (GSE116250) including 4 non-failing heart samples (NF = 4), 4 dilated cardiomyopathy samples (DCM = 4), and 4 ischaemic cardiomyopathy samples (ICM = 4) (Supplementary Table 1 Sheet1). The mRNA expression microarray (GSE52601) and miRNA-Seq (GSE53080) from 12 sample pairs are divided into three groups (NF = 4, DCM = 4, ICM = 4) (Supplementary Table 1 Sheet2-3). All software packages applied in data analysis were obtained in Bioconda [Citation17], such as FastQC (v0.11.8), Multiqc (v1.6), FASTX-toolkit (v0.014), Bowtie, miRDeep2 (v2.0.0). Visualization of the results was conducted by using packages in R/Bioconducter (v3.5.1).
mRNA-Seq analysis
The expression matrix of mRNA-Seq was imported into R and the RPKM(reads per kilobase of transcript per million reads mapped) data with package limma was processed for differential expression analysis. Expression in terms of RPKM was transformed log2 (RPKM+1). In order to remove low-expressed genes, expressed genes at least 4 samples were defined as genes with log2 (RPKM+1) ≥3. We set two groups for differential comparison, and each group included two classes (ICM-NF and DCM-NF). Differences with log2 FC>1 and P < 0.05 were significant. These significant genes will be further analysed.
Weighted genes co-expression network analysis (WGCNA) of mRNA-microarray data
As the arrays were transformed by variance-stabilizing transformation after quality filtering and normalization, the gene expressions of 24 samples in terms of CPM (counts per million) were loaded into R and calculated paired genetic correlations based on WGCNA (Weighted Genes Co-Expression Network Analysis) to identify the Pearson correlation co-efficient. We selected power β = 32 to construct TOM (topology overlap matrix) and used average linkage hierarchical clustering network to identify gene modules. The modules with correlation coefficient greater than 0.6 (differential coefficient less than 0.4) were combined. The gene module with the clinical phenotype data (Supplementary Table 1 Sheet4) was associated to get the relationship between the module and phenotype. Then, we calculated the correlation coefficient and defined the module of the highest correlation with disease as the key module. Thus, we identified these disease-related genes in the key module as crucial genes.
mRNA expression array analysis
The mRNA expression matrix normalized in terms of CPM was loaded into R and conducted with limma package. Differential expression analysis showed two differential expression matrices in total and each matrix included two classes of samples (ICM-NF and DCM-NF). We integrated profiles of mRNA-Seq and mRNA expression array, and selected genes with significantly differential expression (log2 FC>1, P < 0.05). Biological process analysis and KEGG analysis of these common genes were conducted in DAVID Bioinformatics Resources [Citation18] (http://david.abcc.ncifcrf.gov/).
miRNA-Seq analysis
FastQC and Multiqc were applied to report assess the quality of raw sequencing reads synthetically, and quality control was achieved using FASTX-toolkit filtering reads to exclude low quality score with reads less than 16 nt and more than 35 nt in length, and to eliminate adapter sequence according to previous protocol to ensure smooth progress of the follow-up analysis. The clean reads with the length of 16–35 nt were mapped against mature human miRNA sequence retrieved from miRBase (http://www.mirbase.org/), and annotated with miRNA annotation file. Raw counts were normalized in terms of CPM (counts per million) using the TMM method (trimmed mean of M-values) with package edgeR (Version 3.28.0) proposed by Robinson and Oshlack (2010), and then transformed log2 (CPM+1). Expressed genes were defined with log2 (CPM+1) ≥3 in at least 4 samples. Differential expression analysis was conducted with limma package.
mRNA-Seq and miRNA-Seq conjoint analysis
The significantly differential expression genes in above miRNA and mRNA expression profiles were integrated using miRWalk tool (http://mirwalk.umm.uni-heidelberg.de/), that a website integrates the matching results of four target gene prediction websites including miRanda, miRDB, TargetScan, and miRWalk to construct miRNA-mRNA network. The miRNA–mRNA interaction network was visualized using Cytoscape 3.2.1 displaying a visualization of nodes and edges with a two-dimensional network.
Biological process and pathway analysis
DAVID Bioinformatics Resources (http://david.abcc.ncifcrf.gov/), KEGG PATHWAY Database (https://www.genome.jp/kegg/pathway.html), clusterProfiler package (v3.14.3) in R, and mirPath v.3 (http://snf-515,788.vm.okeanos.grnet.gr/) were used to assess the biological meaning behind large lists of genes in order to obtain gene ontology and pathway information for significant down-regulated and up-regulated target genes in HF. The important functions and biological roles of target genes and their association with HF were analysed using MALACARD server (http://www.malacards.org/).
Results
Overview of differentially expressed genes for ICM- and DCM-induced HF in mRNA-Seq
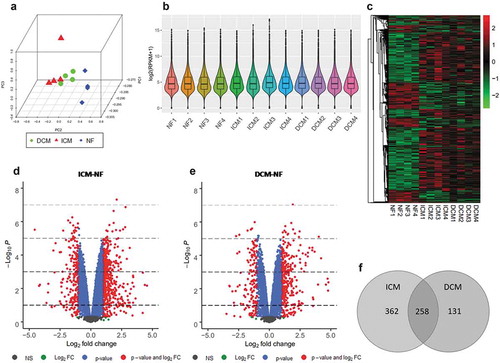
Principal component analysis of all three groups ()) reveals that samples in same group are prominently clustered. Distribution of gene expression in terms of log2 (RPKM+1) of each sample is shown as box and violin plot ()). Genes with log2 (RPKM+1) ≥3 with at least 4 samples were included in following analysis. Thus, we detected 10396 expressed genes in total, and volcano plots of two groups for differential comparison are shown in . Differentially expressed genes (DEGs) were identified separately in each differential comparison group by threshold (log2 FC>1, P < 0.05). The heat map matrix directly visualizes the significantly differential expression levels of DEGs in samples (). The significantly differentially expressed genes of ICM-NF include 436 up-regulated genes and 184 down-regulated genes. Moreover, 281 significantly up-regulated genes and 108 significantly down-regulated genes were found in DCM-NF. Both DEGs of the ICM-NF group and DCM-NF group were intersected to obtain 258 genes that were differentially expressed ()). These genes include NPPA, NPPB, and TUBA3D, and copious literatures have reported that these genes are closely related to ischaemic and dilated cardiomyopathy induced HF. All these data have been arranged in Supplementary Table 2 Sheet1-4.
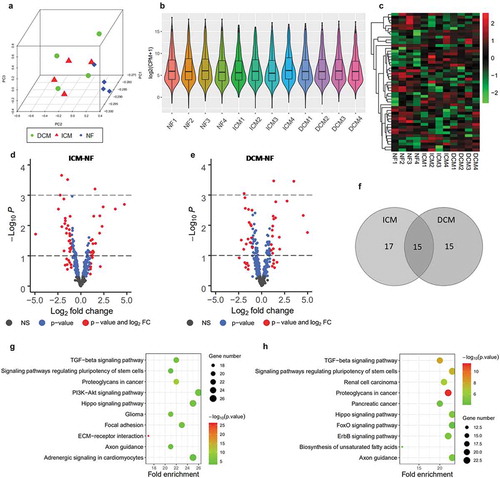
Figure 2. mRNA-Seq analysis for DEGs. (a) Principal component analysis of all three groups such as ICM (red), DCM (green), and NF (blue). (b) Box and violin plot depicts gene expression of each sample. (c) Heat map matrix shows the significantly differential expression levels of DEGs in samples. (d) Volcano plot of ICM-NF. (e) Volcano plot of DCM-NF. Plots in grey represent genes that are not significant. Plots in green represent genes with log2 FC>1. Plots in blue represent genes with P < 0.05, and plots in red represent genes with log2 FC>1 and P < 0.05. (f) Venn diagrams of significant DEGs detected in ICM-NF and DCM-NF
Disease-related genes for ICM- and DCM-induced HF in mRNA-microarray
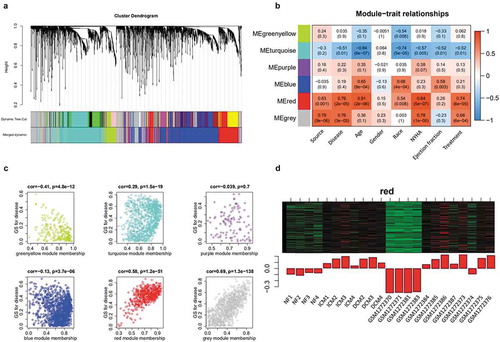
We conducted WGCNA of microarray matrix with 24 samples including 4089 significantly expressed genes (log2 FC>0.3), and found the Pearson correlation coefficient between gene expression samples. We checked and removed outliers through sample clustering (Supplementary Figure 1a), and 23 samples were remained for further analysis. We selected power β = 32 (Supplementary Figure 1c) to harvest TOM (topology overlap matrix) revealing the correlation of genes. The dynamic branching method was used to divide genes into 16 modules, and dynamic tree cut is shown in the cluster dendrogram plots ()). However, there were 6 modules retained due to the modules with differential coefficient less than 0.4 (Supplementary Figure 1b). In addition, we obtained the relationship between 6 modules and traits ()) after associating the gene modules with clinical phenotype data (Supplementary Table 1 Sheet4). Furthermore, we focus on the red module having the highest correlation P with disease ()) except the grey module representing the gene not divided into any module. The heat map of red module shows the expression of disease-related genes in each sample ()). These data suggested that the disease-related genes have been increased expression in ICM and DCM compared to NF. All these data including 24 samples with 4089 significantly expressed genes have been arranged in Supplementary Table 2 Sheet5.
Figure 3. Identification of disease-related genes using WGCNA analysis. (a) Cluster dendrogram plots. (b) The module-trait relationships plot describes the correlations between module genes and clinical phenotype. The positive correlation between module and trait (red); the negative correlation (blue); the no significant correlation (white); the higher the correlation (darker). NYHA: New York Heart Association. (c) Correlation dot plots depict the correlation coefficient and P between module and disease. The dot plot of red module clusters with a line revealing the high and positive correlation with disease. (d) Heat map and bar plot of red module. Each row of heat map represents a gene and each column represents a sample. Each column of bar plot delegates a sample corresponding to the column of heat map, the height of bars delegates the gene expression
In order to obtain more genetic information about ICM- and DCM-induced HF, we performed in-depth analysis of the obtained mRNA-array data. In the analysis of weighted gene co-expression network, we obtained six modules. The red module with the highest correlation to disease-related phenotypes was analysed, and 450 genes in this module (Supplementary Table 3 Sheet1) were associated with age and HF. Further analysis of these genes revealed that 410 genes were up-regulated and 40 genes were down-regulated in ICM group. In DCM group, 434 genes were up-regulated and 16 genes were down-regulated. In addition, there were several genes (NPPB, FOS, SMOC2, and LTBP2) that were elevated in both ICM and DCM groups. Several studies have reported that NPPB plays the crucial role in myocardial remodelling and myocardial fibrosis.
DEGs for ICM- and DCM-induced HF in mRNA-microarray
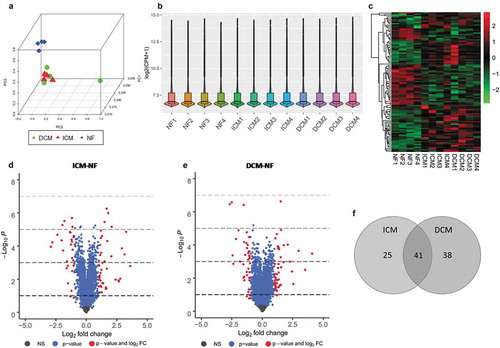
Principal component analysis ()) shows that the first three components of each sample in ICM and DCM groups have noticeable cluster away from NF. Distribution of gene expression in terms of log2 (CPM+1) of each sample is shown as box and violin plot ()). In the raw data, the low-expressing genes have been filtered out. We obtained 20921 expressed genes in total shown as volcano plots of two groups ). There are 66 and 79 significant DEGs (log2 FC>1, P < 0.05) were identified in ICM-NF and DCM-NF, respectively. Moreover, there are 41 and 44 significant up-regulated genes as well as 25 and 35 significant down-regulated genes in ICM-NF and DCM-NF, respectively. The heat map matrix directly visualizes the significantly differential expression levels of DEGs ()). We conducted further analysis to intersect the DEGs of both ICM-NF and DCM-NF groups. We obtained 41 genes that were differentially expressed in both ICM and DCM groups including NPPA, NPPB, FCN3, MYH6, TUBA3D, and TUBA3E ()). Previous studies have documented that these genes are closely related to ischaemic and dilated cardiomyopathy induced HF. All these data used in the plotting have been arranged in Supplementary Table 2 Sheet6-9.
Figure 4. Overview of microarray analysis for DEGs. (a) Principal component analysis of all three groups, ICM (red), DCM (green), and NF (blue). (b) Box and violin plot depicts gene expression of each sample. (c) Heat map matrix shows the significantly differential expression levels of DEGs in samples. Each row represents a gene and each column represents a sample. Low-expressed genes that below the median (green); high expressed genes that above the median (red). The colour saturation indicated the magnitude of deviation from the median. (d) Volcano plot of ICM-NF. (e) Volcano plot of DCM-NF. Plots in grey represent genes that are not significant. Plots in blue represent genes with P < 0.05, and plots in red represent genes with log2FC>1 and P < 0.05. (f) Venn diagrams of significant DEGs detected in ICM-NF and DCM-NF. Overlapping genes are differentially expressed in both ICM and DCM groups
We further identified significantly differential expressed key genes in red module through screening key genes with log2 FC>1 and P < 0.05 in ICM-NF and DCM-NF (). However, we only obtained 11 key genes in ICM-NF (Supplementary Table 3 Sheet2) and 17 in DCM-NF (Supplementary Table 3 Sheet3). Moreover, there are 6 significant key genes (THBS4, IER3, SMOC2, FOS, NPPB, and LTBP2) in both ICM-NF and DCM-NF.
Table 1. Significantly differential expressed key genes in red module
Key DEGs in ICM- and DCM-induced HF
In order to ensure that the DEGs are accurate and confidential, we conducted further analysis to integrate significantly differential expressed genes of mRNA-Seq and mRNA microarray ()). We confirmed 25 genes in both mRNA-seq and mRNA-microarray that were significantly differential expressed in ICM including 18 up-regulated genes and 7 down-regulated genes. Genes obviously related to heart disease were detected, such as NPPB increased 12.21-fold (P = 1.62 × 10⁻³), MYH11 elevated 2.23-fold (P = 1.21 × 10⁻²), and TUBA3D decreased 5.17-fold (P = 2.08 × 10⁻⁵) in ICM compared with NF. Similarly, 23 (16 up and 7 down) significantly differential expressed genes were found in DCM-NF. NPPB and NPPA were highly expressed with 17.03-fold (P = 3.38 × 10⁻⁴) and 11.47-fold (P = 3.15 × 10⁻³) higher. TUBA3E, TUBA3D were 5.66-fold (P = 2.64 × 10⁻⁷) and 6.36-fold (P = 3.44 × 10⁻⁷) lower than NF. All overlapping genes in ICM and DCM are shown in with log2 FC and P. Therefore, these intersecting genes will be used as reliable genes for the subsequent analysis. In addition, we further intersected these genes in ICM and DCM groups to obtain significantly differential expressed genes in both ICM and DCM including 9 up-regulated genes (AEBP1, LTBP2, LUM, MFAP4, MXRA5, NPPA, NPPB, SMOC2, and THBS4) and 2 down-regulated genes (TUBA3D and SERPINA3). These genes have been reported in many studies showing that they are closely related to ischaemic and dilated cardiomyopathy induced HF.
Table 2. Overlapping DEGs
Biological process and pathway analysis of key DEGs
We performed biological process analysis with DAVID Bioinformatics Resources, then conducted KEGG pathway enrichment analysis of the overlapping DEGs(ICM and DCM) using clusterProfiler package (v3.14.3) in R and identified enriched terms that are relevant to the pathological process of HF. These genes are annotated to several important biological processes ()) including extracellular matrix organization, collagen fibril organization, cardiac muscle cell development, cardiac cell development, and response to transforming growth factor beta. Extensive literature has reported that these biological processes have highly connection with ischaemic and dilated cardiomyopathy induced HF. We can find that MYH11, MFAP4, SMOC2, AEBP1, LUM, and CYP1B1 are related to extracellular matrix organization. MYH11, NPPA, and PI16 are annotated to cardiac muscle cell development. CILP, LTBP2, MXRA5, and CLDN5 are annotated to response to transforming growth factor beta. Moreover, there are six pathways enriched in our analysis ()), and we observed that vascular smooth muscle contraction (hsa04270) was enriched with three genes including MYH11, NPPA, and NPPB. Then, we conducted pathway analysis of overlapping DEGs with DAVID Bioinformatics Resources to obtain more information about related signalling pathways. However, the KEGG pathway analysis of overlapping DEGs reported that merely ‘ALK in cardiac myocytes’ pathway was enriched. By examining the literature, we know that this pathway is closely related to heart development and heart disease. All Biological process and KEGG annotation results have been arranged in Supplementary Table 4 Sheet1-2.
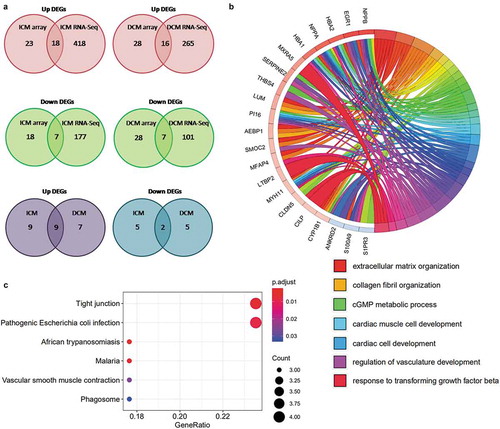
Figure 5. Identification and KEGG analysis of overlapping DEGs. (a) Venn diagrams of significant DEGs detected with microarray and RNA-Seq. Overlapping genes were considered as reliable DEGs and used in this analysis. (b) Circle graph of biological process analysis of overlapping DEGs. Different coloured blocks represent different biological processes. Several important biological processes are shown below the circle diagram. (c) Bubble plot of KEGG pathway enrichment analysis results of overlapping DEGs. All pathways are identified with P cut-off value of 0.05
miRNAs expression profiles in ICM- and DCM-induced HF
A total of 2639 miRNAs were detected in miRNA-Seq analysis. Principal component analysis ()) shows that samples cluster significantly for the most variably expressed genes in each group. Box and violin plot ()) reveals distribution of gene expression in each sample in terms of log2 (CPM+1). Genes with log2 (CPM+1) ≥3 with at least 4 samples were used in subsequent analysis. Therefore, 414 expressed miRNAs were retained (). The heat map matrix ()) depicts the significantly differential expression levels of miRNAs in samples. We got 12 and 14 significantly up-regulated miRNAs (log2 FC>1, P < 0.05). 20 and 16 significantly down-regulated miRNAs (log2 FC<-1, P < 0.05) in ICM-NF and DCM-NF, respectively. In addition, we found that 15 miRNAs were differentially expressed in both ICM-NF and DCM-NF groups ()). All data have been arranged in Supplementary Table 2 Sheet10-13.
Through KEGG pathway enrichment analysis using mirPath v.3, we obtained the enriched pathways that are relevant to the pathological process of heart failure including ECM–receptor interaction (hsa04512), TGF-beta signalling pathway (hsa04350), PI3K-Akt signalling pathway (hsa04151), and cGMP-PKG signalling pathway (hsa04022). All these pathways are identified with P cut-off value of 0.05. ECM-receptor interaction (P = 2.10 × 10⁻²⁶) and PI3K-Akt signalling pathway (P = 7.81 × 10⁻⁶) were most significant in ICM. cGMP-PKG signalling pathway (P = 3.55 × 10⁻⁴) was significant in DCM. TGF-beta signalling pathway was significant in both ICM (P = 7.81 × 10⁻⁶) and DCM (P = 8.25 × 10⁻⁹). We sorted all terms in ascending order of P in Supplementary Table 4 Sheet3-4, and displayed the enrichment results of the top 10 items with the smallest P in a bubble chart ().
Figure 6. Overview of miRNA-Seq analysis for significantly differential expressed miRNAs. (a) Principal component analysis of all three groups, ICM (red), DCM (green), and NF (blue). (b) Box and violin plot depicts miRNAs expression of each sample in terms of log2 (CPM+1). (c) Heat map matrix shows the significantly differential expression levels of miRNAs in samples. (d) Volcano plot of ICM-NF. (e) Volcano plot of DCM-NF. Plots in grey represent miRNAs that are not significant. Plots in blue represent miRNAs with P < 0.05, and plots in red represent miRNAs with log2 FC>1 and P < 0.05. (f) Venn diagrams of significantly differentially expressed miRNAs detected in ICM-NF and DCM-NF. (g) Pathway analysis of significantly differential expressed miRNAs in ICM-NF. (h) Pathway analysis of significantly differential expressed miRNAs in DCM-NF. Gene number depicts the quantity of miRNAs in each pathway
miRNA-mRNA interaction network
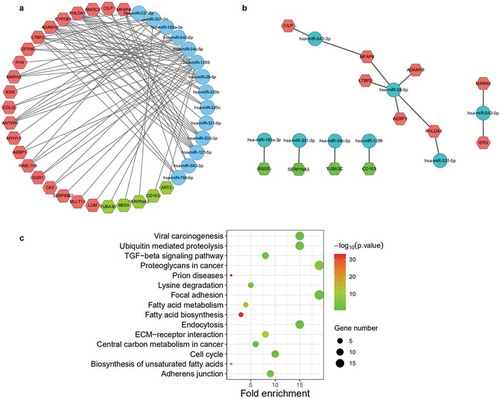
The miRWalk tool integrates the matching results from miRanda, miRDB, TargetScan and miRWalk. To ensure the accurate matching of miRNA-mRNA, miRWalk tool was used for the following analysis to detect the miRNAs binding to the 3′‐untranslated region (3′‐UTR) of mRNAs. There were 90 and 62 miRNA-mRNA pairs in ICM-NF and DCM-NF groups, respectively (), Supplementary Table 4 Sheet5). As miRNAs regulate target genes through inhibiting the expression of target mRNA, we selected 14 miRNA–mRNA pairs (10 in ICM HF and 4 in DCM HF) that showed negative correlations in fold change in above results (), ).
Table 3. Negatively correlated miRNA–mRNA
Furthermore, we also conducted KEGG pathway analysis of target mRNAs in the negatively correlated miRNA-mRNA network. The result of KEGG analysis using DAVID Bioinformatics Resources showed that merely one pathway (hsa2129379), molecules associated with elastic fibres, was enriched. We also noticed that TGF-β signalling pathway is highly related to elastic fibres. KEGG PATHWAY Database and MALACARD were used to identify target genes interrelated with TGF-β signalling pathway including CILP, LTBP2, and AEBP1. This result is highly consistent with our previous biological process analysis results that three genes (CILP, LTBP2, and MXRA5) were enriched in response to transforming growth factor beta. In addition, as MFAP4 may be involved in the regulation of vascular remodelling [Citation19], we also speculate that MFAP4 may be related to extracellular matrix remodelling in our analysis. In the next analysis, we carried on biological process and KEGG pathway analysis of miRNAs in the negatively correlated miRNA-mRNA network using mirPath v.3 website tool to find more reliable information. Simultaneously, we found that fibroblast growth factor receptor signalling pathway (P = 4.05 × 10⁻¹¹) and transforming growth factor beta receptor signalling pathway (P = 6.53 × 10⁻⁹) were detected in pathway analysis of miRNAs (Supplementary Table 4 Sheet6). Furthermore, we performed pathway analysis of miR-542-3p and miR-542-5p, the results showed that TGF-β signalling pathway (P = 3.90 × 10⁻³) and ECM–receptor interaction (P = 4.07 × 10⁻¹²) were enriched ()). Based on the results from pathway analysis and reported researches, we conclude that miR-542-3p and miR-542-5p are obviously related to TGF-β signalling pathway and ECM–receptor interaction. All KEGG pathway analysis results of miR-542-3p and miR-542-5p have been arranged in Supplementary Table 4 Sheet7.
Further, we identified the miRNA-target gene pairs reported jointly suing at least three in four prediction websites (miRanda, miRDB, TargetScan and miRWalk) as our following research object. Thus, only 4 pairs including has-miR-542-3p and CILP, has-miR-542-3p and MFAP4, has-miR-28-5p and ADAM19, and has-miR-28-5p and PHLDA1 in ICM HF (none in DCM HF) were determined as confidential miRNA-mRNA pairs. Moreover, we confirmed the four genes from the results of WGCNA and identified that CILP was detected in red module as disease-related key gene. Finally, we concluded that CILP and has-miR-542-3p might be the key mediators highly related to ICM induced HF.
Figure 7. Identification of miRNA-mRNA network. (a) All related miRNA-mRNA network. (b) Network of miRNA-mRNA that confirmed with negative correlations in fold change. miRNAs (blue), up-regulated target mRNAs (red), and down-regulated target mRNAs (green). (c) Pathway analysis of target genes of miR-542-3p and miR-542-5p. All pathways are identified with P cut-off value of 0.05. Gene number depicts the quantity of target genes of miRNAs enriched in each pathway
Discussion
We conducted a systematic and in-depth analysis of mRNA-seq, mRNA-microarray, and miRNA-seq data from patients with HF based on the previous studies [Citation1,Citation16]. The potential early diagnostic markers of ICM- and DCM-induced HF were found, and key signalling pathways and signalling molecules in the pathogenesis of HF with different causes were further identified.
The results of mRNA-seq data analysis showed that both ICM- and DCM-induced HF had the same DEGs, but also had their own DEGs. The same DEGs revealed that although HF was caused by different causes, there were some similarities in the occurrence or development of the disease, and these common DEGs certainly played a key role in the two kinds of cause-induced HF. Specifically, those DEGs may serve as specific biomarkers for HF induced by ICM and DCM. Further analysis of mRNA-microarray data also showed that there were common DEGs and specific DEGs in ICM and DCM groups.
The significant DEGs shared in files of mRNA-seq [Citation1] and mRNA-microarray [Citation16] are also defined as the target DEGs for our in-depth analysis. We detected 18 up-regulated genes and 7 down-regulated genes in ICM heart tissue. 16 up-regulated genes and 7 down-regulated genes were detected in DCM heart tissue. Among the up-regulated genes of ICM and DCM, 9 genes were consistent including previously reported NPPA, NPPB, AEBP1, LTBP2, LUM, MFAP4, MXRA5, and SMOC2. However, there are specific highly expressed genes in ICM, such as CILP and MYH11. The above genes have been reported in abundant literatures, and several studies have shown that these genes are closely related to the pathological process of heart failure [Citation20–23]. NPPA and NPPB were confirmed as anti-fibrotic factors [Citation20,Citation21] derived from cardiac myocyte involved in regulation of cardiac hypertrophy, ventricular remodelling, and heart failure. MXRA5 was identified as an anti-inflammatory and anti-fibrotic molecule regulated by TGF-β1 signalling pathway [Citation24]. AEBP1 known as aortic carboxypeptidase-like protein (ACLP) contributes to stimulate the transition from fibroblast to myofibroblast [Citation25]. MFAP4 encodes microfibrillar-associated protein 4, an extracellular matrix protein, and is mainly located in elastic fibres and highly expressed in blood vessels [Citation19]. LTBP2 encodes latent TGF-β binding protein, which was increasingly expressed in human failing hearts [Citation22]. SMOC2 encodes modular extracellular calcium-binding protein, has been proven as a novel regulator that impact growth factors [Citation26]. LUM encodes a small member of the leucine-rich proteoglycan (SLRP) family, which has been evaluated as a biomarker for peripheral occlusive arterial disease [Citation27]. In addition, a significant increase in the expression of LUM was detected in experimental and clinical HF [Citation23], and LUM expression was significantly increased in early and late ECM remodelling after myocardial ischaemia/reperfusion injury [Citation28]. These above highly expressed genes in both ICM and DCM play a crucial role in the pathogenesis and diagnosis of HF through different mechanisms. MYH11 was associated with human vascular smooth muscle cell differentiation, and mutations of MYH11 may result in an inherited arterial disease [Citation29]. CILP, cartilage intermediate layer protein, was involved in extracellular matrix synthesis and regulated by mechanical stress. Moreover, it was one of mediators for cardiac fibrosis, decreasing the expression of α-SMA by inhibiting TGF-β signalling pathway in cardiac fibroblasts [Citation30]. Recent research shows that CILP is a crucial anti-fibrotic ECM protein, which can alleviate fibrotic remodelling induced by pressure overload [Citation31].
Biological process analysis and KEGG pathway analysis revealed that DEGs in ICM and DCM group are mainly enriched in extracellular matrix and ALK signalling pathway in cardiac myocytes. ECM is a crucial network providing structural support, facilitating force transmission, and transporting signals to cardiomyocytes, vascular cells and interstitial cells. Cardiac fibrosis is derived from pressure overload and excessive accumulation of fibroblast, and can result in ventricular remodelling and dysfunction. Recent research demonstrated that ALK ameliorates heart hypertrophy, fibrosis, and dysfunction in a pressure-overload model via suppressing AngII-PKCβI-ERK1/2-regulated autophagy [Citation32], or through inactivating the Smad2/3 pathway [Citation33,Citation34].
Increasingly evidence proved that miRNAs are critical regulators in cardiac remodelling, and as potential drug targets for the treatment of heart failure [Citation35,Citation36,Citation37]. We analysed the miRNA-Seq profile from ICM and DCM patients, and identified the pathway enrichment analysis of differentially expressed miRNAs. ECM–receptor interaction, TGF-β signalling pathway, PI3K-Akt signalling pathway, and cGMP-PKG signalling pathway were enriched significantly. The ECM maintains the structure and function of cell and tissue [Citation38]. Specific interactions between cells and ECM are mediated by transmembrane molecules, especially cell-surface-associated components [Citation38]. These interactions lead to direct or indirect control of cellular activities, such as adhesion, migration, differentiation, proliferation, and apoptosis, and abnormalities in these processes can lead to remodelling of the myocardium, leading to heart failure [Citation39]. Previous research reported that TGF-β profibrotic signalling in left ventricle and kidney mediates tissue remodelling in salt-sensitive hypertension [Citation40]. Extensive studies have demonstrated that many regulators are involved in the cardiac remodelling through TGF-β signalling pathway [Citation8,Citation9,Citation41]. Cardiac fibrosis is an important marker of myocardial remodelling and the process of fibrosis is regulated by TGF-β signalling pathway. Khalil H et al [Citation8]. has implied that tissue-resident cardiac fibroblasts activated by fibroblast-specific TGF-β-Smad2/3 signalling is principal mediators of the cardiac fibrosis. Guo Y et al [Citation41]. has proposed that GSK-3β, β-catenin, and TGF-β1-SMAD-3 signalling network is a critical regulator of myocardial fibrosis in the diseased heart. The above studies show that TGF-β signalling pathway plays a key role in mediating myocardial remodelling leading to HF, which is consistent with our analysis. Moreover, several studies have confirmed that PI3K-Akt signalling pathway is pivotal for protecting heart from cardiac fibrosis [Citation10,Citation11,Citation42]. These results agreed with our study that PI3K-Akt signalling pathway (P = 7.81 × 10⁻⁶) was enriched in the pathway analysis of miRNAs from ICM patients. In addition, recent researches have demonstrated that the cGMP-PKG signalling pathway plays an important role in inhibiting cardiac hypertrophy [Citation43,Citation44]. Combined with our analysis that cGMP-PKG signalling pathway (P = 3.55 × 10⁻⁴) was enriched in DCM, it can be predicted that the mediators of the cGMP-PKG signalling pathway may become new markers and targets for the diagnosis and treatment of DCM-induced HF.
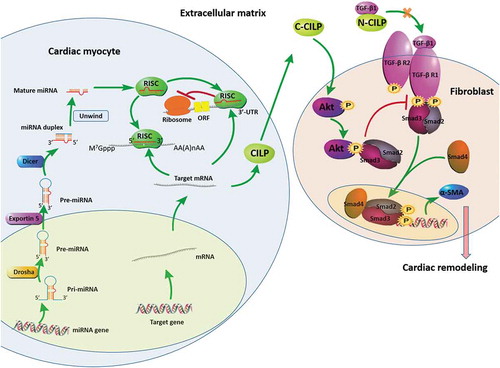
The network of miRNA-mRNA reveals 4 potential pairs negatively correlated in expression level including miR-542-3p and CILP, miR-542-3p and MFAP4, miR-28-5p and ADAM19, and miR-28-5p and PHLDA1. Finally, we ensured that miR-542-3p and CILP were highly related to ICM in HF, as we identified it in the red module genes. Zhang et al. [Citation31] has reported the possible mechanism for CILP-1 participation in regulating TGF-β signalling pathway in mice cardiac fibrosis. The C-terminal of CILP-1 (C-CILP-1) increases Akt phosphorylation and suppresses Smad3 signalling activation in TGF-β signalling pathway through promoting the interaction between Akt and Smad3 [Citation31]. The N-terminal of CILP-1 (N-CILP-1) inhibits TGF-β signalling pathway via combining with TGF-β1 [Citation31]. Recently, several studies demonstrated miR-542-3p as a mediator of TGF-β/Smad signalling pathway, participating in the development of hepatic fibrosis [Citation45] and tumour suppression [Citation46]. Yan D et al [Citation47]. has reported that miR-542-3p regulates the oxidation and inflammation in the pathological process of coronary heart disease through targeting the GABARAP signalling pathway in cardiomyocytes. Zhao Y et al [Citation48]. has suggested that miR-542-3p may be involved in cell proliferation in mice with chronic heart failure. In our results, both GO enrichment analysis and KEGG pathway enrichment analysis showed that both miR-542-3p and CILP are involved in the TGF-β signalling pathway. Therefore, we hypothesized that miR-542-3p and CILP may involve in the occurrence and development of HF induced by ICM through the TGF-β/Smad signalling pathways. For the detailed mechanism of this hypothesis, we proposed a protection mechanism of heart that the downregulation of miR-542-3p may promote the expression of CILP, and the latter contributes to protect the heart from cardiac remodelling through suppressing the expression of α-SMA via inhibiting the TGF-β/Smad2/3 signalling pathway (). However, the processes we put forward need to be confirmed in further experiments. We merely obtain a limited number of significant DEGs based on microarray, some potentially meaningful biomarkers may be missed. Although we have elaborated on the mechanisms by which miRNAs and genes that we have discovered are involved in regulating cardiac remodelling, further functional verification is still needed in the future.
Conclusions
In summary, our study conducted a series of analysis with sequencing profiles from ICM- and DCM-induced HF patients. The combined analysis of mRNA-seq and microarray further identified important common genes in the pathogenesis of HF due to ICM and DCM, and also showed specific genes for ICM- and DCM-induced HF. In addition, mRNA and disease phenotype analysis and miRNA–mRNA interaction network analysis were integrated to find and predict that the pair of miR-542-3p-CILP as mediators of TGF-β signalling pathway that might be a new mechanism to mediate ICM induced HF. This study will provide a comprehensive and systematic theoretical basis for the early diagnosis and therapeutic targets of ICM- and DCM-induced HF.
Figure 8. Molecular and subcellular events leading to cardiac remodelling. Drosha: RNase III enzymes; Exportin 5: nuclear export protein; Dicer: RNase III enzymes; RISC: RNA-induced silencing complexes; CILP: cartilage intermediate layer protein; C-CILP: the C-terminal of CILP; N-CILP: the N-terminal of CILP; α-SMA: α-smooth muscle actin. The downregulation of miR-542-3p promotes the expression of CILP. The C-terminal of CILP (C-CILP) increases Akt phosphorylation and promotes the interaction between Akt and Smad3. The N-terminal of CILP (N-CILP) combines with TGF-β1. These different ways jointly inhibit Smad3 signalling activation in TGF-β signalling pathway, suppress the expression of α-SMA, and protect the heart from cardiac remodelling
Supplemental Material
Download Zip (11.1 MB)Acknowledgments
The authors would like to thank Dr. Xiaoling Guo, Dr. Feng Xiao and Dr. Fujian Lu for revising the manuscript and thank Xiaoran Zhang for her suggestions with the bioinformatics analysis.
Disclosure statement
The authors declare no conflict of interest.
Supplementary materials
Supplemental data for this article can be accessed here.
Additional information
Funding
References
- Sweet ME, Cocciolo A, Slavov D, et al. Transcriptome analysis of human heart failure reveals dysregulated cell adhesion in dilated cardiomyopathy and activated immune pathways in ischemic heart failure. BMC Genomics. 2018;19(1):812.
- Swynghedauw B. Molecular mechanisms of myocardial remodeling. Physiol Rev. 1999;79(1):215–262.
- Beltrami CA, Finato N, Rocco M, et al. Structural basis of end-stage failure in ischemic cardiomyopathy in humans. Circulation. 1994;89:151–163.
- Beltrami CA, Finato N, Rocco M, et al. The cellular basis of dilated cardiomyopathy in humans. J Mol Cell Cardiol. 1995;27:291–305.
- Schirone L, Forte M, Palmerio S, et al. A review of the molecular mechanisms underlying the development and progression of cardiac remodeling. Oxid Med Cell Longev. 2017;2017:3920195.
- Delaunay M, Osman H, Kaiser S, et al. The role of cyclic AMP signaling in cardiac fibrosis. Cells. 2019;9(1):69.
- Malekar P, Hagenmueller M, Anyanwu A, et al. Wnt signaling is critical for maladaptive cardiac hypertrophy and accelerates myocardial remodeling. Hypertension. 2010;55(4):939–945.
- Khalil H, Kanisicak O, Prasad V, et al. Fibroblast-specific TGF-β-Smad2/3 signaling underlies cardiac fibrosis. J Clin Invest. 2017;127:3770–3783.
- Dobaczewski M, Chen W, Frangogiannis NG. Transforming growth factor (TGF)-β signaling in cardiac remodeling. J Mol Cell Cardiol. 2011;51:600–606.
- Zhang C-J, Huang Y, Lu J-D, et al. Upregulated microRNA-132 rescues cardiac fibrosis and restores cardiocyte proliferation in dilated cardiomyopathy through the phosphatase and tensin homolog-mediated PI3K/Akt signal transduction pathway. J Cell Biochem. 2018;120. DOI:10.1002/jcb.27081.
- Yang W, Wu Z, Yang K, et al. BMI1 promotes cardiac fibrosis in ischemia-induced heart failure via the PTEN-PI3K/Akt-mTOR signaling pathway. Am J Physiol Heart Circ Physiol. 2019;316(1):H61–H69.
- Huang Y. The novel regulatory role of lncRNA-miRNA-mRNA axis in cardiovascular diseases. J Cell Mol Med. 2018;22(12):5768–5775.
- Kumarswamy R, Non-coding TT. RNAs in cardiac remodeling and heart failure. Circ Res. 2013;113:676–689.
- Vegter EL, van der Meer P, de Windt LJ, et al. MicroRNAs in heart failure: from biomarker to target for therapy. Eur J Heart Fail. 2016;18:457–468.
- Tijsen AJ, van der Made I, van den Hoogenhof MM, et al. The microRNA-15 family inhibits the TGFβ-pathway in the heart. Cardiovasc Res. 2014;104(1):61–71.
- Akat KM, Moore-McGriff DV, Morozov P, et al. Comparative RNA-sequencing analysis of myocardial and circulating small RNAs in human heart failure and their utility as biomarkers. Proc Natl Acad Sci USA. 2014;111(30):11151–11156.
- Grüning B, Dale R, Sjödin A, et al. Bioconda: sustainable and comprehensive software distribution for the life sciences. Nat Methods. 2018;15(7):475–476.
- Huang DW, Sherman BT, Lempicki RA. Bioinformatics enrichment tools: paths toward the comprehensive functional analysis of large gene lists. Nucleic Acids Res. 2009;37(1):1–13.
- Wulf-Johansson H, Lock Johansson S, Schlosser A, et al. Localization of microfibrillar-associated protein 4 (MFAP4) in human tissues: clinical evaluation of serum MFAP4 and its association with various cardiovascular conditions. PLoS ONE. 2013;8:e82243.
- Franco V, Chen Y-F, Oparil S, et al. Atrial natriuretic peptide dose-dependently inhibits pressure overload-induced cardiac remodeling. Hypertension. 2004;44(5):746–750.
- Tamura N, Ogawa Y, Chusho H, et al. Cardiac fibrosis in mice lacking brain natriuretic peptide. Proc Natl Acad Sci USA. 2000;97(8):4239–4244.
- Bai Y, Zhang P, Zhang X, et al. LTBP-2 acts as a novel marker in human heart failure - a preliminary study. Biomarkers. 2012;17:407–415.
- Engebretsen KVT, Lunde IG, Strand ME, et al. Lumican is increased in experimental and clinical heart failure, and its production by cardiac fibroblasts is induced by mechanical and proinflammatory stimuli. Febs J. 2013;280:2382–2398.
- Poveda J, Sanz AB, Fernandez-Fernandez B, et al. MXRA5 is a TGF-β1-regulated human protein with anti-inflammatory and anti-fibrotic properties. J Cell Mol Med. 2017;21(1):154–164.
- Tumelty KE, Smith BD, Nugent MA, et al. Aortic carboxypeptidase-like protein (ACLP) enhances lung myofibroblast differentiation through transforming growth factor β receptor-dependent and -independent pathways. J Biol Chem. 2014;289(5):2526–2536.
- Rocnik EF, Liu P, Sato K, et al. The novel SPARC family member SMOC-2 potentiates angiogenic growth factor activity. J Biol Chem. 2006;281(32):22855–22864.
- Bubenek S, Nastase A, Niculescu AM, et al. Assessment of gene expression profiles in peripheral occlusive arterial disease. Can J Cardiol. 2012;28(6):712–720.
- Barallobre-Barreiro J, Didangelos A, Schoendube FA, et al. Proteomics analysis of cardiac extracellular matrix remodeling in a porcine model of ischemia/reperfusion injury. Circulation. 2012;125(6):789–802.
- Zhu L, Vranckx R, Khau Van Kien P, et al. Mutations in myosin heavy chain 11 cause a syndrome associating thoracic aortic aneurysm/aortic dissection and patent ductus arteriosus. Nat Genet. 2006;38(3):343–349.
- van Nieuwenhoven FA, Munts C, Op’t Veld RC, et al. Cartilage intermediate layer protein 1 (CILP1): A novel mediator of cardiac extracellular matrix remodelling. Sci Rep. 2017;7(1):16042.
- Zhang C-L, Zhao Q, Liang H, et al. Cartilage intermediate layer protein-1 alleviates pressure overload-induced cardiac fibrosis via interfering TGF-β1 signaling. J Mol Cell Cardiol. 2018;116:135–144.
- Weng L-Q, Zhang W-B, Ye Y, et al. Aliskiren ameliorates pressure overload-induced heart hypertrophy and fibrosis in mice. Acta Pharmacol Sin. 2014;35:1005–1014.
- Wang Q, Chen Y, Zhang D, et al. Activin receptor-like kinase 4 haplodeficiency mitigates arrhythmogenic atrial remodeling and vulnerability to atrial fibrillation in cardiac pathological hypertrophy. J Am Heart Assoc. 2018;7(16):e008842.
- Wu X-P, Wang H-J, Wang Y-L, et al. Serelaxin inhibits differentiation and fibrotic behaviors of cardiac fibroblasts by suppressing ALK-5/Smad2/3 signaling pathway. Exp Cell Res. 2018;362(1):17–27.
- Chen C, Ponnusamy M, Liu C, et al. MicroRNA as a therapeutic target in cardiac remodeling. Biomed Res Int. 2017;2017:1278436.
- Zhang X, Dong S, Jia Q, et al. The microRNA in ventricular remodeling: the miR-30 family. Biosci Rep. 2019;39. DOI:10.1042/BSR20190788.
- Li N, Zhou H, Tang Q. miR-133: A suppressor of cardiac remodeling? Front Pharmacol. 2018;9:903.
- Frangogiannis NG. The extracellular matrix in ischemic and nonischemic heart failure. Circ Res. 2019;125(1):117–146.
- Frangogiannis NG. The extracellular matrix in myocardial injury, repair, and remodeling. J Clin Invest. 2017;127(5):1600–1612.
- Zhang Y, Wei W, Shilova V, et al. Monoclonal antibody to marinobufagenin downregulates TGFβ profibrotic signaling in left ventricle and kidney and reduces tissue remodeling in salt-sensitive hypertension. J Am Heart Assoc. 2019;8:e012138.
- Guo Y, Gupte M, Umbarkar P, et al. Entanglement of GSK-3β, β-catenin and TGF-β1 signaling network to regulate myocardial fibrosis. J Mol Cell Cardiol. 2017;110:109–120.
- Ren D, Giri H, Li J, et al. The cardioprotective signaling activity of activated protein C in heart failure and ischemic heart diseases. Int J Mol Sci. 2019;20(7):1762.
- Andersen A, Povlsen JA, Johnsen J, et al. sGC-cGMP-PKG pathway stimulation protects the healthy but not the failing right ventricle of rats against ischemia and reperfusion injury. Int J Cardiol. 2016;223:674–680.
- Wang Y, Li ZC, Zhang P, et al. Nitric oxide-cGMP-PKG pathway acts on orai1 to inhibit the hypertrophy of human embryonic stem cell-derived cardiomyocytes. Stem Cells. 2015;33(10):2973–2984.
- Ji F, Wang K, Zhang Y, et al. MiR-542-3p controls hepatic stellate cell activation and fibrosis via targeting BMP-7. J Cell Biochem. 2019;120(3):4573–4581.
- Wu Y, You J, Li F, et al. MicroRNA-542-3p suppresses tumor cell proliferation via targeting Smad2 inhuman osteosarcoma. Oncol Lett. 2018;15:6895–6902.
- Yan D, Zhao -L-L, Yue B-W, et al. Granule of BU-XIN RUAN-MAI attenuates the patients’ angina pectoris of coronary heart disease via regulating miR-542-3p/GABARAP Signaling. Evid Based Complement Alternat Med. 2019;2019:1808419.
- Zhao Y, Li Y, Tong L, et al. Analysis of microRNA expression profiles induced by yiqifumai injection in rats with chronic heart failure. Front Physiol. 2018;9:48.
Appendix A
Supplementary Figure 1: Identification of disease-related genes by WGCNA.
Appendix B
Supplementary Table 1.xlsx
Supplementary Table 2.xlsx
Supplementary Table 3.xlsx
Supplementary Table 4.xlsx