
 ?Mathematical formulae have been encoded as MathML and are displayed in this HTML version using MathJax in order to improve their display. Uncheck the box to turn MathJax off. This feature requires Javascript. Click on a formula to zoom.
ABSTRACT
Phenotypic plasticity is a key component of the ability of organisms to respond to changing environmental conditions. In this study, we aimed to study the establishment of DNA methylation marks in response to an environmental stress in rainbow trout and to assess whether these marks depend on the genetic background. The environmental stress chosen here was temperature, a known induction factor of epigenetic marks in fish. To disentangle the role of epigenetic mechanisms such as DNA methylation in generating phenotypic variations, nine rainbow trout isogenic lines with no genetic variability within a line were used. For each line, half of the eggs were incubated at standard temperature (11°C) and the other half at high temperature (16°C), from eyed-stage to hatching. In order to gain a first insight into the establishment of DNA methylation marks in response to an early temperature regime (control 11°C vs. heated 16°C), we have studied the expression of 8 dnmt3 (DNA methyltransferase) genes, potentially involved in de novo methylation, and analysed global DNA methylation in the different rainbow trout isogenic lines using LUMA (LUminometric Methylation Assay). Finally, finer investigation of genome-wide methylation patterns was performed using EpiRADseq, a reduced-representation library approach based on the ddRADseq (Double Digest Restriction Associated DNA) protocol, for six rainbow trout isogenic lines. We have demonstrated that thermal history during embryonic development alters patterns of DNA methylation, but to a greater or lesser extent depending on the genetic background.
Introduction
Phenotypic plasticity, defined as the ability of a given genotype to vary its phenotype depending on the environment, is a key component of the ability of organisms to respond to changing environmental conditions [Citation1]. Epigenetic mechanisms [Citation2] are involved in the long-term persistence of physiological effects resulting from events that occurred earlier in the life of an animal. These epigenetic marks can be modified by environmental stimuli and hence regulate genome-wide gene expression and ultimately modulate phenotypes. The role of epigenetic processes such as DNA methylation in mediating environmentally induced phenotypic variation has been reviewed in Angers et al.’s study [Citation3]. To date, only a limited number of studies in fish could independently analyse genetic and epigenetic variations, using asexual fish vertebrate model systems such as the clonal fish Chrosomus eos-neogaeus (Cyprinidea) [Citation4] or the naturally self-fertilizing hermaphroditic mangrove killifish Kryptolebias marmoratus [Citation5,Citation6]. However, the aforementioned studies were limited to a single or a few genotypes.
In this study, we aimed to study the establishment of DNA methylation marks in response to an early (during embryonic development) environmental stress in rainbow trout and importantly to assess whether these marks depend on the genetic background.
A recent review highlighted the role of epigenetic marks in response to abiotic (hypoxia, temperature, salinity, nutrition, contaminants) or biotic (social interactions, pathogens) environmental factors in the modulation of physiological responses in teleost fish [Citation7]. In fish, early life stages (embryonic and larval stages that occur externally) are particularly sensitive to such events.
The environmental stress chosen here was temperature, highly relevant in the context of climate change as fish are poikilothermic. Indeed, global warming is expected to impact negatively cold-water fish aquaculture, such as Salmonids. Several studies, reviewed in Jonsson and Jonsson’s study [Citation8], have shown that temperature experienced during early development can impact phenotypes later in life in fish, such as thermal acclimation ability [Citation11], growth and muscle development [Citation12–18], sex differentiation [Citation19] or intermediary metabolism [Citation20–22]. Moreover, temperature is a known induction factor of epigenetic marks in fish. For example, in response to early exposure to certain temperature regimes, through differential methylation of specific promotors (aromatase and myogenin), epigenetic mechanisms are involved in sex determination in sea bass [Citation23] or muscle development in Senegalese sole [Citation24] and Atlantic salmon [Citation25]. Also, Metzger and Schulte [Citation26] have demonstrated that temperature experienced during development has prolonged effects on DNA methylation levels throughout the genome of threespine stickleback. However, rearing temperature had no effect on genome-wide DNA methylation patterns during post-embryonic development in turbot [Citation27].
To disentangle genetic and environmental sources of variation of epigenetic marks, rainbow trout isogenic lines, previously established at INRAE [Citation28], are a unique and highly relevant biological model. Indeed, within each line, all fish have the same genome, i.e., there is no genetic variability. This will allow the very fine analysis of epigenetic marks established in response to an environmental stress within a line (i.e., at constant genotype). A collection of 19 isogenic lines (i.e., 19 genotypes) is available, making it possible to study whether the establishment of these epigenetic marks depends on the genetic background. These lines have also recently been characterized for their response to temperature and the existence of a high between-line variability was shown [Citation29].
DNA methylation, the addition of methyl groups to cytosines, was chosen here as it is a well-characterized epigenetic mark and has predominantly been studied in fish. In an organism, DNA methyltransferases (dnmt) are the enzymes involved in DNA methylation and several types exist: dnmt1, which is involved in the maintenance of methylation profiles during cell divisions; and dnmt3a and dnmt3b, which are involved in de novo methylation. It has been shown that temperature during embryonic development can modulate dnmt3 expression in zebrafish [Citation30,Citation31]. Recently, expression patterns of DNA methylation genes (including dnmt1 and dnmt3 genes) were assessed during ontogenesis in rainbow trout [Citation32]. However, few studies have analysed the expression levels of dnmt genes in response to temperature in fish, especially in rainbow trout. Expression profiling of dnmt genes could help to understand the establishment of differential methylation profiles during an early temperature stress. Further, in order to gain a first insight into the impact of temperature during embryonic development on DNA methylation levels, Luminometric Methylation Assay (LUMA) analysis [Citation10] is a low-cost option that allows the acquisition of the global percentage of DNA methylation. For the finer investigation of genome-wide methylation patterns established in response to an early temperature stress, we have chosen EpiRADseq, a reduced-representation library approach that is scalable and provides higher resolution compared to a global approach such as LUMA. It is based on the ddRADseq (Double Digest Restriction Associated DNA) protocol, except that it utilizes a methylation-sensitive restriction enzyme [Citation33]. It has been developed on a single clone of water fleas (Daphnia ambigua), i.e., in absence of genetic diversity, but the protocol can be modified to account for it. Based on the differences in the frequencies of reads obtained per locus between two conditions (control vs. treatment), this approach allows the identification of differentially methylated loci in response to the treatment applied.
The present study reports the impact of early temperature regime (control 11°C vs. heated 16°C) on i) dnmt3 gene expression; ii) global DNA methylation assessed by LUMA; and iii) genome-wide patterns of DNA methylation assessed by EpiRADseq. The utilization of nine rainbow trout isogenic lines allowed us to study the interactions between genetics, epigenetics, and environment.
Materials and methods
Ethical statement
All the experiments were carried out at the INRAE experimental facilities (PEIMA, Sizun, France) authorized for animal experimentation under the French regulation C29-277-02. The investigation reported here does not need approval by a specific ethical committee since it implies only classical rearing practices and stops before the first feeding.
Biological material
Experimental fish were produced and reared at the INRAE experimental fish farm (PEIMA, Sizun, France). Rainbow trout homozygous isogenic lines, previously established and maintained at INRAE [Citation28] by single within-line pair mating, were used as breeders. The experimental design is illustrated in . Nine heterozygous isogenic lines were produced by mating several homozygous females from a single isogenic line (B57) with nine homozygous sex-reversed XX males from nine other isogenic lines (A02, A03, A22, A36, AB1, AP2, G17, N38, and R23). To avoid confusion with the INRAE homozygous isogenic lines, heterozygous lines will be named A02h, A03h, etc. Importantly, these lines have recently been characterized for their phenotypic response to acute temperature challenges [Citation29]: resistant lines (A03h, G17h, and R23h), intermediate lines (A02h, A22h, AB1h, and AP2h), and sensitive line (N38h). A fin clip from each doubled haploid (DH) parent was taken and kept in ethanol. In order to obtain large enough numbers, eggs were collected from 49 2-year-old females that had spawn on the same day and had similar egg weight (ranging from 0.031 to 0.038 g). To avoid unexpected maternal effects, eggs were mixed and then divided into nine batches (eight batches of 8,600 eggs and one of 6,060 eggs), each batch being fertilized by one of the 9 homozygous males. For line R23h, fewer eggs were used because fertilization was performed with cryopreserved sperm; this can explain the lower percentage of eyed eggs (37.6% compared to 59.1–76.1%). Fertilized eggs were kept at 11.4°C into vertical tray incubators. Sixteen days after fertilization, eyed eggs of each line were distributed into small incubators installed in two separate 200-litre tanks supplied with natural spring water at either 11.4°C (control) or heated to 16°C (treatment). Several studies have shown that the optimal temperature for rainbow trout egg incubation ranged between 8°C and 12°C [Citation34–36], in particular, to control mortalities and malformations. Some studies showed that high incubation temperatures (16°C) from fertilization to 50% hatch [Citation37] or first feeding [Citation34] was associated with important mortalities. A similar study on brown trout also showed an upper limit for embryo development between 14°C and 16°C [Citation38]. This is why we decided to incubate eggs at high temperature (16°C) from eyed-stage and not straight after fertilization. From now on, the control condition will be referred to as ‘11°C.’ For eight out of nine lines, three incubators containing 500 to 625 eyed eggs were used for each incubation temperature regime. For R23h, due to the lower survival at eyed-stage, only two incubators containing 557 eyed eggs were used for each incubation temperature regime. Temperature treatment lasted for 7 days. For our study, sampling was done as follows: 3 days after the beginning of the temperature treatment (19 days post-fertilization, dpf), three pools of five eggs per line and per incubation temperature were collected for RNA extraction; at the end of the temperature treatment (22 dpf), six pools of five eggs per line and per incubation temperature were collected, three pools for RNA extraction (except for line R23h) and three pools for DNA extraction. All samples were snap frozen in liquid nitrogen and kept at −80°C before processing.
Figure 1. Experimental design and samples collection. With the exception of A36h, all lines have been previously tested for their response to acute thermal challenges [Citation29] and their status is mentioned: R for resistant, I for intermediate and S for sensitive. dpf: days post-fertilization
![Figure 1. Experimental design and samples collection. With the exception of A36h, all lines have been previously tested for their response to acute thermal challenges [Citation29] and their status is mentioned: R for resistant, I for intermediate and S for sensitive. dpf: days post-fertilization](/cms/asset/28215649-b784-4d64-8320-6c7ece249406/kepi_a_1834924_f0001_oc.jpg)
Quantitative PCR (qPCR)
The expression of nine target genes was assessed by qPCR in nine isogenic lines at two sampling dates, 19 and 22 dpf (). In order to confirm that the early temperature treatment was successful, hsp47 (Heat Shock Protein 47) was chosen as it has been shown to be a good molecular biomarker for thermal stress in salmonids [Citation39]. Expression profiling of eight dnmt3 genes, which are potentially involved in de novo DNA methylation (dnmt3aa, dnmt3ab1, dnmt3ab2, dnmt3ba1, dnmt3ba2, dnmt3bba1, dnmt3bba2, dnmt3bbb), was also performed to try to understand the establishment of differential methylation profiles during an early temperature stress. Total RNA was isolated from 102 pools of fertilized eggs (eyed-stage; five eggs per pool) using TRIzol reagent (Invitrogen) (two incubation temperatures; three biological replicates per line and per temperature; eight isogenic lines at two sampling dates and one isogenic line (R23h) at one sampling date; ). RNA samples were then purified using RNeasy kit (Qiagen) and quantified by Nanodrop. RNA integrity was assessed using RNA Nano Chips (Agilent Technologies) in a 2100 Bioanalyzer instrument (Agilent Technologies).
Complementary DNA (cDNA) was synthesized from 1 µg total RNA using the SuperScript II (Invitrogen, ThermoFisher Scientific). cDNA samples were then quantified using RNA Pico Chips (Agilent Technologies) in a 2100 BioAnalyzer instrument (Agilent Technologies) and normalized to 20 pg/µl. Efficiencies were calculated using a 5-point standard curve from a 10-fold dilution series (1:1 to 1:10000) of a pool of all cDNA samples. Quantitative PCR was performed with AmpliTaq Gold® Polymerase (Power SYBR® Green PCR MasterMix, Life Technologies) in the Applied BiosystemsTM QuantStudioTM 12 K Flex Real-Time PCR System (ThermoFisher Scientific). The qPCR conditions used were 1 cycle at 95°C for 10 min then 40 cycles at 95°C for 30 s and 60°C for 1 min. At the end of each PCR run, a melting curve analysis was performed to ensure the specificity of the PCR product. Two technical replicates were used for each sample. No template control (NTC) was included on each plate to check the absence of contaminations. The most stable reference genes (ref) were selected using the BestKeeper software [Citation40]. Five reference genes were selected: elongation factor 1α (ef1α), ribosomal protein S20 (rps20), β-actin, RNA terminal phosphate cyclase like 1 (rcl1) and 60S acidic ribosomal protein (arp). Primer sequences are shown in . The analysis software REST 2009 [Relative Expression Software Tool; Citation41, Citation42] was used to calculate fold change in expression of each target gene (hsp47 or dnmt3) between Control (incubation at 11°C) and Treatment (incubation at 16°C) groups, using the following formula:
Table 1. Primers used for gene expression analysis of hsp47 and dnmt3 by qPCR. E: qPCR efficiency
where E is the qPCR efficiency (). This software automatically includes statistical analysis based on a two-sided pairwise fixed reallocation randomization test and bootstrapping methods including 2000 iterations which allows to get a good estimate of the p-value [Citation41]. These statistical analyses were performed line by line. Data are presented as the geometric average ± standard error (SE) of the fold change relative to control.
DNA extraction
DNA was extracted from the fin clips collected from the DH parents using the Wizard® Genomic DNA purification kit (Promega). DNA was also extracted from 54 pools of fertilized eggs (eyed-stage; five eggs per pool), collected at the end of the temperature treatment (22 dpf) (nine isogenic lines; two incubation temperatures; three biological replicates per line and per temperature; ), using the same kit but with modifications. Briefly for the pools of eggs, lysis was performed in 10 ml of Nuclei Lysis Solution and 292 µl of proteinase K (20 mg/µl), with overnight incubation at 55°C. RNA was digested by adding 100 µl of RNase Solution and incubating 1 H at 37°C. Protein precipitation was performed by adding 3.4 ml of protein precipitation solution and centrifugating 20 min at 13,000 g at room temperature. Genomic DNA was then concentrated and desalted by isopropanol precipitation (volume to volume) and washed with 70% ethanol. Genomic DNA was rehydrated in 200 µl of DNA rehydration solution, and 30 µl of genomic DNA was then purified with Agencourt AMPure XP paramagnetic beads (Beckman Coulter). Purified genomic DNA was finally quantified by NanoDrop and a Qubit 2.0 fluorometer (Invitrogen), and normalized to a concentration of 100 ng/µl.
Global DNA methylation analysis
Global DNA methylation levels were quantified using LUminometric Methylation Assay (LUMA), as previously described [Citation9,Citation43] on the 54 pools of eggs collected at 22 dpf (). Briefly, 500 ng of genomic DNA was cleaved using the isoschizomer HpaII (methylation sensitive) and MspI (non-methylation-sensitive) in two separate reactions and in the presence of EcoRI to standardize for DNA amounts (New England Biolabs). The protruding ends were then used as templates for pyrosequencing with the Pyromark Q24 device and Pyromark Gold Q96 reagents (Qiagen). The luminometric signals were quantified using the Pyromark Q24 software (Qiagen). The level of cytosine methylation was determined in duplicate reactions by comparing the ratio of HpaII to MspI cleavage, standardized using EcoRI cleavage. Statistical analyses were carried out using non-parametric tests suited for small samples (permutation tests for two/K independent samples with Monte-Carlo sampling; coin plug-in in RCommander) at a 95% level of significance. To test for the effect of incubation temperature (11°C vs. 16°C) on global DNA methylation, two-sample Fisher–Pitman permutation tests were performed on the whole dataset and line by line. To test for between-lines differences in global DNA methylation at each incubation temperature, K-sample Fisher–Pitman permutation tests were performed, followed by non-parametric testing of Tukey-type multiple comparisons using nparcomp software [Citation44] in R. Data are presented as mean percentages of global DNA methylation ± SE.
EpiRADseq analysis
Sequence library preparation
Genome-wide patterns of DNA methylation were analysed by EpiRADseq on the same DNA extracts used for LUMA, for six out of nine rainbow trout isogenic lines: resistant lines (A03h, G17h, and R23h), intermediate lines (AB1h and AP2h), and sensitive line (N38h). EpiRADseq is a reduced-representation library approach, based on ddRADseq protocol, that has been recently developed and tested on a single clone of water fleas [Citation33]. The protocol was here modified to account for genetic variability and allow both within and between-lines comparisons. Briefly, for 36 biological samples (6 isogenic lines x 2 incubation temperatures x 3 pools of 5 eggs), 200 ng of DNA from each sample was digested in parallel with restriction enzymes PstI (CATCAG recognition site) and MspI or HpAII (CCGG recognition site). As suggested by Schield et al. [Citation33], digestion by PstI/MspI (cuts at CCGG sites like HpaII, but is insensitive to methylation) was used to account for differences in genotypes (e.g., to identify EpiRADseq loci present in some lines but absent in others). In addition, the 7 DH parents used to produce the six heterozygous isogenic lines (six males and one B57 female) were digested with PstI/MspI in order to confirm the presence/absence of particular EpiRADseq loci in the different lines. Digested samples were purified using AMPure beads, quantified using a Qubit fluorometer and then the amount of DNA was standardized. Then, each digested DNA sample was ligated with a mixture of eight double-stranded sequencing adapters containing UMIs (Unique Molecular Identifiers) and a 5-bp barcode. UMIs are random sequences of eight bases used to tag each molecule (fragment) prior to library amplification, in order to identify PCR duplicates. Eight different 5-bp barcodes for each sample were used at the ligation stage to add base heterogeneity and hence improve Illumina fluorescence reading. Adapter assembling was based on Peterson et al. [Citation45], and using the ’ddRAD ligation molarity calculator’ excel spreadsheet. After adapter ligation, a two-step PCR strategy was used to construct the sequencing library, as described in Lluch et al.’s study [Citation46]. The 6-bp indexes, allowing for sample multiplexing, were added during the second PCR step with the second Illumina adapter. The final EpiRADseq library construction was as followed: P1-Illumina-adapter,UMI,barcode,PstI-cut-site-overhang,DNA,MspI/HpaII-cut-site-overhang,P2-Illumina-adapter-Index-included. All libraries were pooled in an equimolar fashion and the resulting pooled library was size-selected. The size selection for fragments within a range 340–400 bp was done using a Blue Pippin Prep (Sage Science) with a 2% agarose cartridge and purified and concentrated by 0.8X AMPure XP beads purification. All steps of library construction were controlled by a fragment profile analysis with a Fragment Analyzer (Agilent). The final library was quantified by qPCR and sequenced on an Illumina HiSeq 3000 in paired-end 2 × 150 bp.
EpiRADSeq loci definition (supplemental data epirad_script.zip)
As sequence libraries contained 8-bp UMIs, we used the ‘clone_filter’ program from the Stacks suite version 1.48 [Citation47] to remove PCR duplicates (i.e., 100% identical paired sequences, also known as ‘optical duplicates’). Then, because each sample had eight barcodes of five nucleotides before the PstI restriction site, we used the Stacks ‘process_radtags’ function on reads pairs to remove those barcodes, to check for the presence of restriction sites at the beginning of each read, and to apply quality filters (i.e., remove reads with uncalled bases and with an average quality score below 20 on a sliding window of 15% of the reads length). At the end of ‘process_radtags’ step, eight pairs of filtered reads files were obtained per sample (i.e., one for each barcode). These eight paired files were concatenated into a single pair (R1 and R2) of fastq file per sample. Sequences of each sample were then aligned to the reference genome Omyk_1.0 (Genbank accession number: GCA_002163495.1) using the BWA-MEM aligner version 0.7.15 [Citation48]. Alignments were filtered with samtools version 1.4 [Citation49], bedtools version 2.26 [Citation50], and an in-house script. Non properly paired alignment, supplementary alignment, alignment with soft-clipped positions at the restriction site extremities, and mapping with a mapping score below 20 were filtered out. EpiRADseq loci were defined with bedtools for each sample separately by merging strictly identical mapping intervals, calculating the coverage (i.e., the number of reads) of each defined locus and generating a .bed file. To construct a full catalogue of EpiRADseq loci, the loci separately defined for each sample were merged with bedtools when exhibiting strictly identical intervals. An in-house python script was used to generate the final count table for each defined EpiRADseq locus, i.e., the number of reads per sample.
The rainbow trout genome has undergone four whole-genome duplications as in all salmonids species, and it is known that large parts of the genome remain duplicated [Citation51]. To identify duplicated loci, we performed a variant calling analysis with Stacks version 1.48 [Citation47]. Briefly, loci were identified by sample using the mapping coordinates (pstacks program), each allele must have a minimum coverage of three reads. A full catalogue including the loci from all the samples was then constructed (cstacks), individual loci were mapped back to the catalogue (sstacks), and finally, each sample was genotyped for each locus (populations). Since DH parents are expected to be homozygous, all loci that appeared heterozygous in at least two DH parents were considered as duplicated and removed from further analyses.
In order to further characterize the EpiRADseq loci, their location in a genomic feature was determined based on the current rainbow trout genome annotation release 100 (Omyk_1.0). Several genomic features were considered for this analysis, namely intergenic regions, regions 1 kb upstream or 1 kb downstream of annotated genic regions, exons, introns, or pseudogenes.
Differential methylation analysis
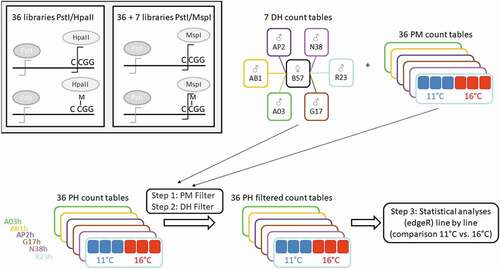
In order to define a set of usable EpiRADseq loci for each of the six isogenic lines, the output count table (number of reads per locus and per sample) for the six PstI/HpaII libraries of a given line (two incubation temperatures x three biological replicates) was filtered to keep loci with positive counts in at least three of the six corresponding PstI/MspI libraries (filter called ‘PM Filter’). Then, only loci with positive counts in at least one of the two doubled haploid parents used to produce the given isogenic line were kept (filter called ‘DH Filter’). These two steps of filtering ensured the removal of potentially artefactual loci and resulted in six sets of EpiRADseq loci, one for each isogenic line (). The comparison of these six sets of loci was carried out using jvenn [Citation52] in order to calculate the total number of EpiRADseq loci, the number of shared loci (i.e., present in the six isogenic lines), as well as the number of line-specific loci. Also, the genomic distribution of EpiRADseq loci per Mb windows was assessed using the ‘geom_bin2d’ function of ggplot2 package in R v.3.5.1. Finally, in order to identify differentially methylated loci between the two incubation temperatures (11°C vs. 16°C), the analysis was performed on each single line using the set of PH EpiRADseq filtered loci count tables (). Statistical analyses were performed with edgeR version 3.26.5 [Citation53] in R v.3.6.1. EpiRADseq loci were filtered out to keep loci with CPM (counts per million) >1 in at least three of the six samples considered for each line, followed by TMM normalization [Citation54]. We chose to implement quasi-likelihood (QL) F-test as it provides a more robust and reliable error rate control when the number of replicates is small [Citation55]. The QL dispersion estimation and testing procedure were done using the functions glmQLFit() (with the ROBUST = TRUE option) and glmQLFTest(). All PH EpiRADseq loci with a Benjamini–Hochberg corrected FDR value <0.05 were considered to be differentially methylated between the two temperature conditions. The numbers of unique and shared differentially methylated loci between the two temperature conditions (11°C vs. 16°C) for six rainbow trout isogenic lines were drawn using UpSetR package [Citation56].
Figure 2. Analysis strategy of EpiRADseq data. DH and PM count tables are the results of PstI/MspI sequence libraries, PH count tables are the results of the PstI/HpaII sequence libraries. Filters were applied per line on PstI/HpaII EpiRADseq loci count tables. PM filter: loci with positive counts for at least 3 out of 6 PstI/MspI libraries were kept. DH filter: loci with positive counts in at least one of the two doubled haploid parents PM libraries
Functional analysis of the differentially methylated EpiRADseq loci
The current annotation (release 100) of the rainbow trout assembly (Omyk_1.0) describes over 55 k genes. However, only 11,234 (20.17%) of these genes are associated with a gene symbol. More surprisingly, of the 42 k protein-coding genes associated with characterized proteins, only 5,619 (13.11%) have a gene symbol. Unfortunately, functional analyses heavily rely on gene symbols. We compared the protein-coding trout genes and proteins (BLASTX and BLASTP) to the newest catalogue of salmon and zebrafish proteins (respectively 17,668 and 46,038 proteins with gene symbols, from NCBI annotation release 100 and 106) to enrich the number of gene symbols associated with the rainbow trout genes. Briefly, we defined three classes based on similarity and reciprocal coverage: class I (similarity ≥80%, coverage ≥80%), class II (similarity ≥80%, coverage ≥50%), and class III (similarity ≥60%, coverage ≥50%). If the best match for a trout gene was from class I or II, we added the corresponding gene symbol as a putative gene symbol. We also added as synonyms the gene symbols of other close blast matches (same blast class than the best match). These BLAST results allowed us to add 24,823 gene symbols (19,589 from class I matches and 5,234 from class II matches) to the 5,619 gene symbol of the NCBI annotation for protein-coding genes. We also used the recently released rainbow trout annotation on Ensembl (v100.1 from April 2020) and used the Ensembl gene symbols of the genes showing more than 50% of reciprocal coverage with NCBI genes. With the 21,379 Ensembl genes associated with NCBI genes, we have added 797 gene symbols (242 and 555 for coding and non-coding genes). Ultimately, 36,353 trout genes were associated with gene symbols accounting for more than 65% of the total trout genes up from the original 20% (Supplementary Table S1).
We have then extracted the gene symbols and putative gene symbols from the genes found in the differentially methylated loci using the intersect tool from Bedtools suite (v2.27.1) [Citation50]. Then, we used the ZFIN website to select the best gene symbol for each gene. Briefly, we selected the gene symbols with the highest number of associated ZFIN phenotypes and highest number of GO terms, as they were the most likely to give results for the functional analysis.
The gene symbols obtained from the previous step were used as an input for the downstream functional analysis steps. Because of the limited number of genes available (see Results section), it was not possible to perform an enrichment analysis. Therefore, in order to gain a first insight into the biological functions involved in the response to temperature, a descriptive classification approach was chosen instead on the whole dataset, i.e., the functional analysis was not performed line by line. First, the gene symbols were checked and their names were modified whenever needed using the information available from GeneCards (https://www.genecards.org/). Then, they were converted into the corresponding KEGG Orthology (KO) codes using the ‘db2db’ tool (https://biodbnet-abcc.ncifcrf.gov/db/db2db.php) from the bioDBnet suite, using the then up to date underlying databases (Supplementary Table S2). Subsequently, the retrieved KO codes were analysed using the ‘Reconstruct Pathway’ tool (https://www.genome.jp/kegg/tool/map_pathway.html) from the KEGG Mapper suite. The obtained KEGG pathways were manually edited in order to keep only the first two hierarchy levels, and the first-level hierarchy ‘Human diseases’ was discarded. Eventually, the gene counts corresponding to each second-level hierarchy were entered in an excel spreadsheet in order to obtain the final bar plot.
Results
Effect of incubation temperature on the expression of candidate genes (hsp47 and dnmt3)
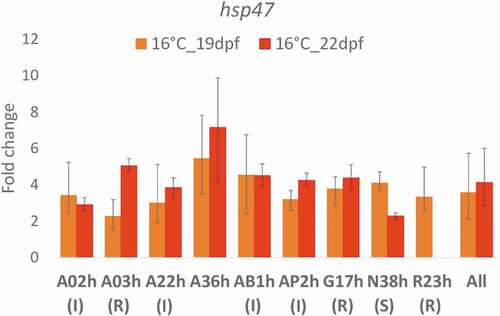
At eyed-stage, the transcription of hsp47, a thermal stress biomarker, overall was upregulated at 16°C (fold change relative to the control 11°C: FC = 3.6, p < 0.001 at 19 dpf; FC = 4.1, p < 0.001 at 22 dpf). Analyses line by line showed an increase of the expression of this gene in all lines at 16°C, with fold changes ranging between 2.2 (A03h) and 5.4 (A36h) at 19 dpf; between 2.3 (N38h) and 7.1 (A36h) at 22 dpf, hence confirming that the early temperature stress was efficient regardless of the genetic background (). Spearman’s rank correlation tests revealed no correlation between the FC of hsp47 at 16°C and the rank (1 for sensitive; 2 for intermediate and 3 for resistant) of the known phenotypic response of the lines at 19 dpf (r = −0.391, p = 0.338); but a significant correlation at 22 dpf (r = 0.777, p = 0.040) indicating that induction of hsp47 expression was higher in resistant lines compared to intermediate and sensitive lines. Also, the resistant line A03h and sensitive line N38h seemed to exhibit very different patterns of hsp47 expression at the two sampling dates ().
Figure 3. Comparison of hsp47 gene transcription at 16°C in nine rainbow trout isogenic lines, as expressed as fold change relative to control 11°C and expressed as mean ± SE. Status of the lines: R for resistant, I for intermediate and S for sensitive. 19 dpf (days post-fertilization): three days after the beginning of the temperature treatment; 22 dpf: at the end of the temperature treatment. Data are not available for line R23h at 22 dpf due to technical problems during RNA extraction, meaning that the samples were lost
When comparing dnmt3 gene expression between the two incubation temperatures (11°C vs. 16°C) within each line, five lines (A03h, AP2h, G17h, N38h, and R23h) exhibited up- or downregulation of some of the dnmt3 genes (, Supplementary Figure S1). Results also differed between the two sampling dates, with some genes up/downregulated at a single sampling date or genes shifting direction between sampling dates (downregulated at 19 dpf but upregulated at 22 dpf; e.g., genes dnmt3ab1 and dnmt3ba2 for line N38h) (, Supplementary Figure S1).
Table 2. Gene expression of eight dnmt3 genes at 16°C, expressed as fold change (FC) relative to the control 11°C, performed line by line
Effect of incubation temperature on global DNA methylation analysis
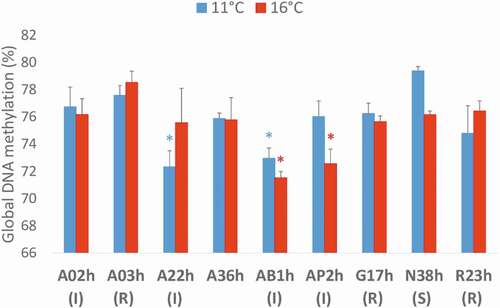
At eyed-stage just before hatching (22 dpf), analysis of global DNA methylation with LUMA (LUminometric Methylation Assay) revealed no overall effect of incubation temperature (z = 0.56222, p = 0.578) but significant differences between lines at 11°C (χ2 = 16.603, p = 0.007) and 16°C (χ2 = 14.828, p = 0.028) (). Lines A22h and AB1h exhibited significantly lower DNA methylation levels compared to the other lines at 11°C; AB1h and AP2h at 16°C. There was also a tendency of lower DNA methylation level at 11°C compared to 16°C for line A22h and at 16°C compared to 11°C for lines AB1h, AP2h, and N38h, although not significant due to the low number (3) of biological replicates in each temperature condition. Spearman’s rank correlation tests revealed no correlation between global DNA methylation levels and the rank (1 for sensitive; 2 for intermediate, and 3 for resistant) of the known phenotypic response of the lines (r = −0.091, p = 0.830 at 11°C; r = 0.469, p = 0.240 at 16°C).
Figure 4. Global DNA methylation assessed at eyed-stage (22 dpf) by LUMA (LUminometric Methylation Assay) in nine rainbow trout isogenic lines at two incubation temperatures, 11°C vs. 16°C, expressed as mean ± SE. Status of the lines: R for resistant, I for intermediate and S for sensitive. Two-sample Fisher–Pitman permutation tests performed line by line revealed no effect of incubation temperature on global DNA methylation levels. For each incubation temperature, K-sample Fisher–Pitman permutation tests were performed, followed by non-parametric testing of Tukey-type multiple comparisons: * indicate the lines with significantly (p < 0.05) lower global DNA methylation level compared to the other lines
Effect of incubation temperature on genome-wide patterns of DNA methylation
A total of 565,954,096 reads were generated. Using Stacks v1.48, ‘clone_filter’ identified 9.7% of reads as PCR duplicates and removed them. A further 8% of reads did not pass the quality filters of ‘process_radtags’ and were removed from the analysis. After removal of PCR duplicates and quality filtering, a total of 467,437,915 reads were used for the analysis. Reads aligned very well to the rainbow trout reference genome (98% of reads mapped on average). After alignment filtering (removal of alignments that are supplementary, not representing properly paired reads for which one of the restriction sites has been soft-clipped, or with mapping quality below 20), 64% of reads on average were kept.
Overall, 284,825 EpiRADseq loci were defined on the whole dataset. Variant calling analysis with Stacks identified 2,671 potentially duplicated loci that were removed from downstream analyses. After two steps of filtering (), the total number of EpiRADseq loci kept was 99,712, ranging between 72,263 (line R23h) to 83,494 (line A03h) depending on the line (). Among the 99,712 EpiRADseq loci kept for further analysis, 96,522 were located on the 29 chromosomes and 3,190 on the unassembled scaffolds. The number of EpiRADseq loci per chromosome was highly correlated with the chromosome size (Spearman’s rank correlation r = 0.967; p < 0.001). By plotting the number of loci per Mb windows, distribution of EpiRADseq loci throughout the genome seemed relatively homogeneous, with a tendency of the lower number of loci towards the ends of the chromosomes (Supplementary Figure S2). Among the 99,712 EpiRADseq loci kept, 63,359 (63.5%) were common to the 6 isogenic lines and 12,036 (12.1%) were line-specific (). Based on the current annotation of rainbow trout genome, 38.1% of EpiRADseq loci mapped to intergenic regions, 44.2% within introns, 12.5% within exons, 1.8% upstream genes, and 1.9% downstream genes ().
Table 3. Number of filtered EpiRADseq loci per line
Figure 5. Number of EpiRADseq loci shared between two and six rainbow trout isogenic lines, and number of line-specific EpiRADseq loci
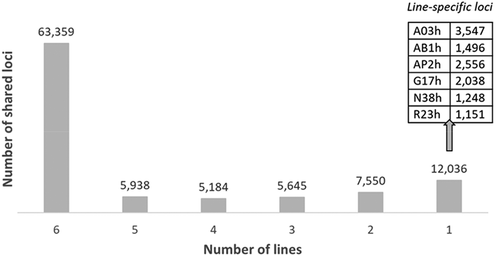
Figure 6. Percentages of EpiRADseq loci that mapped to various categories of annotated genomic regions of the rainbow trout genome (Omyk_1.0). Upstream: within 1 kb upstream of annotated genic regions. Downstream: within 1 kb downstream of annotated genic regions
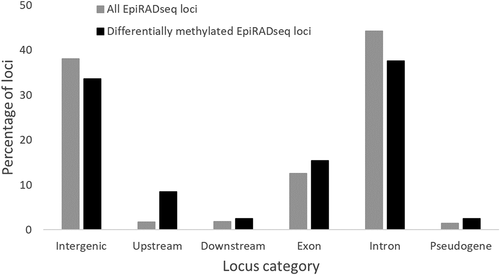
Differential methylation analysis between the two incubation temperatures (11°C vs 16°C) was performed for each line separately and using only the 99,712 EpiRADseq loci identified in the PstI/MspI libraries, but by using the PstI/HpaII counts at these loci (). After filtering loci with low abundances of reads (counts per million >1 in at least three of the six samples), between 65.7% and 71.5% of the loci were kept (). The number of differentially methylated EpiRADseq loci between the two temperature conditions (11°C vs. 16°C, adjusted p-value < 0.05) ranged from 19 (N38h) to 155 (AB1h) (). These differentially methylated loci were spread across the genome, located on 13 different chromosomes for N38h, 16 for A03h, 27 for AP2h and G17h, 28 for R23h and 29 for AB1h without defining hot spots. Interestingly, the vast majority of differentially methylated loci (375) were detected in only one of the six lines, while 34 loci were detected in at least 2 lines (24 in 2 lines, 6 in 3 lines, 2 in 4 lines, and only 2 loci detected in 5 lines) (). Analysis of the location of differentially methylated EpiRADseq loci revealed that 33.6% mapped to intergenic regions, 37.6% within introns, 15.4% within exons, 8.4% upstream genes, and 2.5% downstream genes (). The proportions of these EpiRADseq loci among the annotation feature categories were significantly different from the ones obtained with all EpiRADseq loci (; χ2 = 110.1; p < 0.001), notably with a shift in the proportion of loci located upstream genes (8.4% vs. 1.8%), suggesting that the distribution of differentially methylated EpiRADseq loci might not be random.
Figure 7. Number of unique and shared differentially methylated loci between the two temperature conditions (11°C vs. 16°C) for six rainbow trout isogenic lines, using UpSetR package [Citation56]. Down: number of loci that were less methylated at 16°C compared to 11°C; Up: number of loci that were more methylated at 16°C compared to 11°C
![Figure 7. Number of unique and shared differentially methylated loci between the two temperature conditions (11°C vs. 16°C) for six rainbow trout isogenic lines, using UpSetR package [Citation56]. Down: number of loci that were less methylated at 16°C compared to 11°C; Up: number of loci that were more methylated at 16°C compared to 11°C](/cms/asset/fb1bad15-f0d2-4c2c-bc89-f324cf5abc89/kepi_a_1834924_f0007_b.gif)
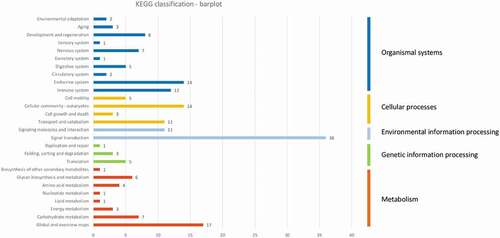
Out of the 385 differentially methylated loci identified among the 6 rainbow trout isogenic lines and located on the 29 rainbow trout chromosomes, 251 loci overlapped with one or several genes. A total of 268 genes overlapped with these loci and 204 of them were associated with gene symbols (Supplementary Table S3). The KEGG Ontology (KO) codes were retrieved for 138 of these gene symbols (Supplementary Table S3) and were used as an input for a pathway classification functional analysis using KEGG. By a general point of view, it was possible to observe that the most represented second-level KEGG pathways were ‘signal transduction’ (36 genes), ‘global and overview maps’ (presenting global and overall pictures of metabolism, 17 genes), ‘cellular community’ (14 genes), and ‘endocrine and immune systems’ (14 and 12 genes, respectively) (). The list of gene symbols in each KEGG pathway is provided in Supplementary Table S3, as well as the information for each of the six isogenic lines.
Figure 8. Descriptive KEGG pathway classification bar plot obtained using the genes found in the 385 differentially methylated EpiRADseq loci. The horizontal bars represent the absolute number of genes found in second-level KEGG pathways, grouped in first-level KEGG pathways using a colour code. The vertical bars on the right indicate the names of first-level pathways
Discussion
Fish inbred/isogenic lines constitute powerful biological models to investigate the role of DNA methylation in mediating environmentally induced phenotypic variation
Model systems like naturally clonal vertebrates [Citation57] or experimental isogenic lines like in this study, where genetic and epigenetic variation can be studied independently, constitute very powerful tools to investigate the role of epigenetic mechanisms in generating phenotypic variation. Indeed, within each line, all fish have the same genome, i.e., there is no genetic variability. Here, we aimed to investigate how different genotypes can modulate, through epigenetic mechanisms, to a greater or lesser extent, their phenotype in response to environmental stimuli. Specifically, we have looked at the impact of early temperature regime (control 11°C vs. heated 16°C) on the expression of dnmt3 genes and global DNA methylation in nine rainbow trout isogenic lines, as well as finer genome-wide patterns of DNA methylation in six of the lines. This allowed us to compare DNA methylation patterns within a line (i.e., at constant genotype) between two early temperature regimes. Also, performing these analyses on six to nine rainbow trout isogenic lines made it possible to study whether the establishment of these methylation marks depends on the genetic background.
There has been empirical evidence of the important role of epigenetic processes in generating ecologically relevant phenotypic variation, using naturally inbred lines of plants such as Arabidopsis [e.g., Citation58], clonal invertebrates such as Daphnia [e.g., Citation33] or clonal replicates of corals via fragmentation of coral colonies [Citation59]. To date, however, there has been only a limited number of studies in fish because it is difficult to disentangle the different effects due to genetic variation among individuals. In this context, the use of asexual fish vertebrate models, such as the clonal fish Chrosomus eos-neogaeus (Cyprinidea), that reproduces asexually through gynogenesis, has been pioneering as it allowed to have biological replicates without genetic variation [reviewed in Angers et al.’s study Citation4]. Several studies using this biological model in natural populations have revealed that i) levels of DNA methylation variation were higher than genetic variation [Citation60]; ii) both environmentally induced and stochastic modifications of DNA methylation were sources of epigenetic variation [Citation61,Citation62]; iii) the relative abundance of environmentally induced and randomly established epigenetic marks was correlated to the predictability of environmental conditions, both in natural sites and common garden experiments [Citation61]. Another interesting biological model is the naturally self-fertilizing hermaphroditic mangrove killifish Kryptolebias marmoratus. Two recent studies have used two highly inbred lines of mangrove killifish to study the relative contributions to DNA methylation plasticity of the genetic background and environment, i.e., temperature during embryonic development [Citation6] or environmental enrichment [Citation5]. Both studies have identified significant methylation differences among genotypes and environments but showed that the effect of the genotypes on DNA methylation plasticity is greater than that caused by the environment.
The aforementioned studies on clonal or inbred fish have demonstrated the role of DNA methylation in mediating environmentally induced phenotypic variation. However, they were restricted to a single genotype [Citation60] or a few ones (2 in Citation5 and Citation6, or 5 in Citation61). Therefore, our investigation using nine different rainbow trout isogenic lines is powerful to study whether the establishment of the methylation marks in response to an environmental stimulus depends on the genetic background. Also, working with experimental populations in controlled rearing conditions allowed us to investigate clearly the role of a single environmental stimulus (temperature here) on genome-wide patterns of DNA methylation.
Upregulation of hsp47 validates exposure to a thermal stress
We have shown here that hsp47 (Heat Shock Protein 47) gene expression was upregulated in response to high incubation temperature (16°C) applied during embryonic development (from eyed-stage to just before hatching) whatever the genetic background at the two sampling points. This is in agreement with previous articles which reported that hsp47 was induced by an increase in temperature in various experimental situations [Citation39,Citation63–65]. This demonstrates that eggs were actually exposed to a thermal stress. Interestingly, our results suggested that induction of hsp47 expression was higher in resistant lines compared to intermediate and sensitive lines at 22 dpf. This should be confirmed by analysing more samples per line, more lines with contrasted phenotypic response to temperature and more time points in order to study the dynamics of hsp47 induction.
Modulation of dnmt3 gene expression by high incubation temperature
Expression of all dnmt3 genes has been detected which is in agreement with the expression pattern of these genes during ontogenesis in rainbow trout, from oocyte to hatching [Citation32].
We have investigated whether incubation temperature modulated dnmt3 gene expression. When comparing dnmt3 gene expression between the two incubation temperatures line by line, results differed between the two sampling dates, with some genes up/downregulated at a single sampling date or genes shifting direction between sampling dates (downregulated at 19 dpf but upregulated at 22 dpf) (, Supplementary Figure S1). This would suggest that the expression patterns of dnmt3 genes are temporally dynamic. Overall, the expression of dnmt3 genes was only moderately modulated by temperature. To our knowledge, our study is the first to look at the modulation of dnmt3 gene expression by temperature in rainbow trout. Extending the analysis to other fish species can allow gaining interesting insights. Campos et al. [Citation24] showed the impact of rearing temperature on dnmt gene expression in Senegalese sole larvae undergoing metamorphosis, with a downregulation of dnmt1 and dnm3b genes at 21°C compared to 15°C but no impact on dnmt3a gene expression. Two other studies have been performed in zebrafish which showed that dnmt3 (two dnmt3a and four dnmt3b) gene expression was modified after exposure to a thermal stress [Citation30,Citation31]. It is, however, difficult to compare with our work since exposure timing, duration, and sampling stages are different. Nevertheless, they revealed dynamic and differential changes between dnmt3 genes after exposure to a thermal stress. Specifically, Campos et al. [Citation30] showed that expression of dnmt3b paralogues was more dynamic than dnmt3a paralogues and that dnmt3a and dnmt3b paralogues exhibited a different response to temperature. This fits with results obtained in Senegalese sole [Citation24], and we could therefore expect different patterns and dynamics of gene expression in response to a temperature between dnmt3a and dnm3b paralogues. Some of our results indeed pointed towards a partially different response to high incubation temperature of dnmt3a and dnm3b paralogues: dnmt3aa was the only dnmt3 gene not being impacted by incubation temperature whatever the line or the sampling date. However, our experimental design with only three biological replicates per condition lacked statistical power to be able to conclude about a differential modulation of dnmt3a vs. dnmt3b paralogues by temperature. It would be interesting in the future to finely study the dynamics of dnmt3 gene expression in response to temperature, with more biological replicates per sampling point and more time points. It would also be interesting to decipher the specific roles of the different dnmt3a and dnmt3b paralogues in establishing de novo methylation patterns in response to environmental stimuli.
Another interesting question is whether modulation of dnmt3 gene expression by high temperature depends on the genetic background and whether this relates to the known phenotypic response of the lines to acute temperature challenges. In our study, four intermediate lines (A02h, A22h, A36h, and AB1h) did not show any modulation of dnmt3 gene expression at any of the sampling dates; the three resistant lines (A03h, G17h, and R23h) showed some modulation only at 19 dpf; two lines (intermediate AP2h and sensitive N38h) showed some modulation at the two sampling dates. This would suggest that expression of dnmt3 genes in response to an environmental stimulus (here temperature during embryonic development) may indeed depend on the genetic background. Recently, Burherhout et al. [Citation25] have showed in Atlantic salmon that both genetic background and embryonic temperature seemed to influence to some extent dnmt (dnmt1, dnmt3a, and dnmt3b) gene expression. However, only two different genetic backgrounds were compared and expression patterns of a limited number of dnmt genes were assessed, preventing to draw general conclusions. Our experimental design investigating the impact of high incubation temperature on eight dnmt3 (three dnmt3a and five dnmt3b paralogues) gene expression in nine rainbow trout isogenic lines (i.e., nine different genotypes) is therefore quite unique, despite the low statistical power due to the low number of biological replicates. Once again, in order to investigate more finely the potential role of the genetic background on the modulation of dnmt3 gene expression by temperature and the link with the known contrasted phenotypic response of the lines, more samples should be analysed (e.g., more biological replicates per isogenic line, individual eggs instead of pooled samples, more isogenic lines, or more time points).
Impact of high incubation temperature on global and genome-wide patterns of DNA methylation
We have chosen to analyse the impact of high incubation temperature on global and genome-wide patterns of DNA methylation on the same DNA extracts at a single sampling date, 22 dpf, i.e., at the end of the thermal treatment. When designing the experiment, we hypothesized that the impact of high temperature on DNA methylation would be strongest at the end of the thermal treatment.
Analysis of global DNA methylation with LUMA (LUminometric Methylation Assay) revealed no overall effect of incubation temperature (11°C vs 16°C) at eyed-stage. In a recent study performed on rainbow trout juveniles, Defo et al. [Citation66] also found no impact of high temperature (23°C compared to 15°C during 28 d) on global DNA methylation assessed by LUMA in brain and liver tissues. The fact that there is no overall effect of temperature on global DNA methylation levels does not mean that the treatment did not have any impact on DNA methylation patterns. This is in line with several recent studies in zebrafish that have reported no changes in global DNA methylation levels but differences in DNA methylation levels of specific gene promoters in response to high temperature [Citation31] or environmental contaminants [e.g., Citation67, Citation68].
However, we revealed between-lines differences in global DNA methylation, with lines A22h and AB1h exhibiting lower DNA methylation levels compared to the other lines at 11°C; and AB1h and AP2h at 16°C (). Sampling of eyed-eggs was done on the same day (i.e., at the same number of degree days) for all the lines. Hence, we cannot rule out that the between-lines differences in global DNA methylation levels could be due to the fact that the lines were not at the exact same developmental stage because of differences in developmental rates. To limit this, all females spawned on the same day. Differences in their genomes could also lead to different numbers of CpG between the lines. It would be interesting to further investigate this point using whole-genome resequencing data of the different isogenic lines. Interestingly, there was also a tendency of lower DNA methylation level at 16°C compared to 11°C for lines AB1h, AP2h (two intermediate lines), and N38h (sensitive line), although not significant due to the low number (3) of biological replicates in each temperature condition. This could suggest that different genetic backgrounds might react differently to temperature, and modulate differently their epigenome.
Our study, which investigated the establishment of genome-wide patterns of DNA methylation in six rainbow trout isogenic lines in response to an early temperature treatment by EpiRADseq, is novel. Indeed, to our knowledge, very few papers have looked at the role of DNA methylation in mediating plastic responses to environmental temperature changes. In a recent study, Metzger and Schulte [Citation26] have reared threespine stickleback at three temperatures (cold 12°C, control 18°C, or warm 24°C) during their embryonic development then at 18°C after hatching. After 9 months of development, adult stickleback from the control group was acclimated to three different temperatures (5°C, 18°C, or 25°C). By comparing DNA methylation patterns in muscle between the experimental groups, they showed that both developmental temperature and adult acclimation temperature altered DNA methylation patterns. Importantly, there was a common core response of the methylome to thermal change with 50 differentially methylated regions common to all experimental groups. Therefore, they concluded that epigenetic mechanisms (DNA methylation) are a component of both persistent and plastic responses to environmental change. It is important to note that experimental fish were composed of six families but that the effect of the genetic background was not taken into account. The strength of our experimental design is that it can account for this effect on the establishment of DNA methylation marks in response to temperature during embryonic development. Also, as most isogenic lines were previously tested for their response to acute thermal challenges [Citation29], we could analyse the variations of DNA methylation patterns in light of the known phenotypic response (resistance or sensitivity) of the lines to acute temperature challenges.
Our study identified 19 to 155 differentially methylated loci depending on the line between the control (11°C) and high temperature (16°C) groups, thus demonstrating that the thermal history during embryonic development can alter patterns of DNA methylation. It would be interesting to test the impact of a longer exposure or exposure to higher temperatures during embryonic development on the establishment of DNA methylation patterns. Also here, the analysis was performed at the end of the thermal treatment. As a future development, it would be interesting to analyse DNA methylation patterns a few months after the end of the thermal treatment, in order to investigate the persistence in time of the observed changes and the impact on the response to acute temperature challenges. For comparison purposes, Metzger and Schulte [Citation26] identified 480 differentially methylated cytosines in 10-month-old sticklebacks that developed at 24°C then were reared at 18°C after hatching, compared to the control group (18°C).
Effect of genetic background in the patterns of DNA methylation established in response to high incubation temperature
Another interesting result is that the great majority of the observed changes in methylation seemed to be dependent on the genetic background. This was exemplified by between-lines differences in the number of differentially methylated loci, ranging from 19 (N38h) to 155 (AB1h) (). As for the LUMA results, we cannot rule out that these between-lines differences could be due to the fact that the lines were not at the exact same developmental stage because of differences in developmental rates. No clear link could be established between the observed plasticity of DNA methylation and the known phenotypic response of the lines to acute temperature challenge. Indeed, N38h is the most sensitive line to temperature challenge, A03h, G17h, and R23h being resistant, AB1h and AP2h being intermediate [Citation29]. The fact that N38h, the most sensitive line, exhibited the lowest number (19) of differentially methylated loci could suggest that DNA methylation plasticity plays a role in the phenotypic response to temperature. However, the most resistant line A03h only showed a marginally higher number of differentially methylated loci (29) compared to N38h, while the other two resistant lines G17h and R23h as well as the two intermediate lines exhibited a much higher number of differentially methylated loci (). Once again, it would be interesting to analyse DNA methylation patterns at the juvenile stage (on 4–5 -month-old fish), i.e., at the time acute thermal challenges are usually performed, in order to investigate more finely the role of DNA methylation in the contrasted phenotypic response to the temperature of the different isogenic lines.
Furthermore, the vast majority of differentially methylated loci (375 out of 409, or 91.7%) were unique to one of the six lines, while 34 loci were shared between at least two lines (). These results were consistent with recent studies performed on two inbred lines of mangrove killifish [Citation5,Citation6]. Interestingly, Berbel-Filho et al. [Citation5] also classified their differentially methylated cytosines or regions into the three classes of epigenetic variation defined by Richards [Citation69], based on the degree of autonomy from the underlying genotype: obligatory epialleles (completely dependent), facilitated (partially dependent) or pure epialleles (independent). They found only a few differentially methylated cytosines that could be considered facilitated or pure epialleles, suggesting a strong influence of the genotype on DNA methylation variation in response to environmental change. Similarly to Berbel-Filho et al. [Citation5], we have classified the 34 differentially methylated loci shared between at least 2 lines as facilitated (i.e., displaying different directions of variation across the lines) for 8 of them or pure (i.e., displaying the same direction of variation) for 26 of them (Supplementary Table S4).
Functional analysis of the differentially methylated EpiRADseq loci: potential KEGG pathways involved in the response to high incubation temperature
Due to the limited number of genes found in the differentially methylated loci, functional analysis was restricted to a descriptive analysis and was not performed line by line. Indeed, the 385 differentially methylated loci located on the 29 rainbow trout chromosomes overlapped with 268 genes. In order to investigate the functions of these genes, pathway classification functional analysis was performed using KEGG. It might be more insightful to perform functional analysis line by line as several lines could respond differently to temperature; however, this was prevented by the limited number of impacted genes (13 to 102 depending on the line; Supplementary Table S3). This global analysis revealed that the most represented second-level pathways were ‘environmental information processing’ (signal transduction), ‘metabolism’ (global and overview maps), ‘cellular processes’ (cellular community), and ‘organismal systems’ (endocrine and immune systems) (). As there is no previous study on the response of the methylome to high temperature during embryonic development in rainbow trout, it seemed relevant to compare the identified pathways with those highlighted by transcriptomic studies. Indeed, a limitation of this study is that we have focused on changes in DNA methylation patterns without investigating concomitantly the changes in gene expression on the same samples. The higher proportion of differentially methylated loci identified upstream genes (8.4% compared to 1.8%; ) suggests that these changes in DNA methylation might occur in promoters and hence regulate expression of these genes. This would have given interesting insights into the correlated responses of the transcriptome and methylome. To date, several studies have revealed transcriptomic changes in response to thermal stress in several tissues of rainbow trout. In these studies, the thermal stress was not applied during embryonic development but on juvenile or adult fish. It also varied greatly both in duration (from 30 min to 4 weeks) and temperature range (from 18°C to 26°C compared to control temperature of 10°C to 18°C). The different experimental designs between these transcriptomic studies and our study, in terms of timing and duration of the thermal stress applied, as well as in the type of samples (embryos vs tissues) analysed, make these comparisons tentative. However, KEGG pathway analysis and/or GO enrichment of transcriptomic data (microarray or RNAseq) revealed several pathways influenced by heat stress in rainbow trout: stress response with heat shock proteins in all studies, immune response [Citation63,Citation64,Citation66,Citation70–72], apoptosis [Citation64,Citation66,Citation71], metabolism [Citation64,Citation66,Citation72,Citation73], cell structure [Citation63,Citation64,Citation71], cell transport [Citation64], protein processing [Citation70–72], or post-transcriptional regulation of spliceosome [Citation70]. Endocrine, metabolic, and immunological pathways were also shown to be regulated by high temperature in another salmonid species, maraena whitefish [Citation74]. Therefore, it is possible to say that our results suggesting the potential modulation of genes belonging to metabolism, endocrine and immune system pathways were consistent with transcriptomic studies.
Disclosure of interest
The authors report no conflict of interest.
Supplemental Material
Download Zip (6.4 MB)Acknowledgments
This study was carried out within AQUAEXCEL2020 funded by European Union’s Horizon 2020 research and innovation programme under grant agreement No 652831 and received support from INRAE Animal Genetics division. We are grateful to the Genotoul bioinformatics platform Toulouse Occitanie (Bioinfo Genotoul, doi: 10.15454/1.5572369328961167E12) for providing computing and storage resources. We are grateful to Jonathan d’Ambrosio for sharing his R script to draw Supplementary Figure S2 and to Florence Jaffrezic and Christelle Hennequet-Antier for useful discussions concerning edgeR. We thank Lucie Marandel for sharing her dnmt3 primers before acceptance of her publication.
Supplementary material
Supplemental data for this article can be accessed here.
Additional information
Funding
References
- Pigliucci M. How organisms respond to environmental changes: from phenotypes to molecules (and vice versa). Trends Ecol Evol. 1996;11:168–173.
- Goldberg AD, Allis CD, Bernstein E. Epigenetics: a landscape takes shape. Cell. 2007;128:635–638.
- Angers B, Castonguay E, Massicotte R. Environmentally induced phenotypes and DNA methylation: how to deal with unpredictable conditions until the next generation and after. Mol Ecol. 2010;19:1283–1295.
- Angers B, Perez M, Menicucci T, et al. Sources of epigenetic variation and their applications in natural populations. Evol Appl Eva. 2020;12946.
- Berbel-Filho WM, Rodríguez-Barreto D, Berry N, et al. Contrasting DNA methylation responses of inbred fish lines to different rearing environments. Epigenetics. 2019;14:939–948.
- Ellison A, Rodríguez López CM, Moran P, et al. Epigenetic regulation of sex ratios may explain natural variation in self-fertilization rates. Proc R Soc B Biol Sci. 2015;282:20151900.
- Best C, Ikert H, Kostyniuk DJ, et al. Epigenetics in teleost fish: from molecular mechanisms to physiological phenotypes. Comp Biochem Physiol Part B Biochem Mol Biol. 2018;224:210–244.
- Jonsson B, Jonsson N. Phenotypic plasticity and epigenetics of fish: embryo temperature affects later-developing life-history traits. Aquat Biol. 2019;28:21–32.
- Karimi M, Johansson S, Ekström TJ. Using LUMA: a Luminometric-based assay for global DNA-methylation. Epigenetics. 2006;1:45–48.
- Karimi M, Johansson S, Stach D, et al. LUMA (LUminometric Methylation Assay)–a high throughput method to the analysis of genomic DNA methylation. Exp Cell Res. 2006;312:1989–1995.
- Scott GR, Johnston IA. Temperature during embryonic development has persistent effects on thermal acclimation capacity in zebrafish. Proc Natl Acad Sci U S A. 2012;109:14247–14252.
- Albokhadaim I, Hammond CL, Ashton C, et al. Larval programming of post-hatch muscle growth and activity in Atlantic salmon (Salmo salar). J Exp Biol. 2007;210:1735–1741.
- Garcia de la Serrana D, Vieira VLA, Andree KB, et al. Development temperature has persistent effects on muscle growth responses in gilthead sea bream. PLoS One. 2012;7:e51884.
- Johnston IA. Environment and plasticity of myogenesis in teleost fish. J Exp Biol. 2006;209:2249–2264.
- Johnston IA, Lee H-T, Macqueen DJ, et al. Embryonic temperature affects muscle fibre recruitment in adult zebrafish: genome-wide changes in gene and microRNA expression associated with the transition from hyperplastic to hypertrophic growth phenotypes. J Exp Biol. 2009;212:1781–1793.
- Macqueen DJ, Robb DHF, Olsen T, et al. Temperature until the “eyed stage” of embryogenesis programmes the growth trajectory and muscle phenotype of adult Atlantic salmon. Biol Lett. 2008;4:294–298.
- Schnurr ME, Yin Y, Scott GR. Temperature during embryonic development has persistent effects on metabolic enzymes in the muscle of zebrafish. J Exp Biol. 2014;217:1370–1380.
- Steinbacher P, Marschallinger J, Obermayer A, et al. Temperature-dependent modification of muscle precursor cell behaviour is an underlying reason for lasting effects on muscle cellularity and body growth of teleost fish. J Exp Biol. 2011;214:1791–1801.
- Valdivia K, Jouanno E, Volff J-N, et al. High temperature increases the masculinization rate of the all-female (XX) Rainbow Trout “Mal” population. PLoS One. 2014;9:e113355.
- Couto A, Enes P, Peres H, et al. Effect of water temperature and dietary starch on growth and metabolic utilization of diets in gilthead sea bream (Sparus aurata) juveniles. Comp Biochem Physiol Part A. 2008;151:45–50.
- Qiang J, He J, Yang H, et al. Temperature modulates hepatic carbohydrate metabolic enzyme activity and gene expression in juvenile GIFT tilapia (Oreochromis niloticus) fed a carbohydrate-enriched diet. J Therm Biol. 2014;40:25–31.
- Seibert H. Effects of temperature on glucose release and glycogen metabolism in isolated hepatocytes from rainbow trout (Salmo gairdneri). Comp Biochem Physiol. 1985;81B:877–883.
- Navarro-Martín L, Viñas J, Ribas L, et al. DNA methylation of the gonadal aromatase (cyp19a) promoter is involved in temperature-dependent sex ratio shifts in the European Sea Bass. PLoS Genet. 2011;7:e1002447.
- Campos C, Valente LMP, Conceição LEC, et al. Temperature affects methylation of the myogenin putative promoter, its expression and muscle cellularity in Senegalese sole larvae. Epigenetics. 2013;8:389–397.
- Burgerhout E, Mommens M, Johnsen H, et al. Genetic background and embryonic temperature affect DNA methylation and expression of myogenin and muscle development in Atlantic salmon (Salmo salar). PLoS One. 2017;12:e0179918.
- Metzger DCH, Schulte PM. Persistent and plastic effects of temperature on DNA methylation across the genome of threespine stickleback (Gasterosteus aculeatus). Proc R Soc B Biol Sci. 2017;284:20171667.
- Suarez-Bregua P, Pérez-Figueroa A, Hernández-Urcera J, et al. Temperature-independent genome-wide DNA methylation profile in turbot post-embryonic development. J Therm Biol. 2020;88:102483.
- Quillet E, Dorson M, Le Guillou S, et al. Wide range of susceptibility to rhabdoviruses in homozygous clones of rainbow trout. Fish Shellfish Immunol. 2007;22:510–519.
- Dupont-Nivet M, Crusot M, Rigaudeau D, et al., 2015. Genetics of thermotolerance in rainbow trout, Oncorhynchus mykiss. In 12th International Symposium for Genetics in Aquaculture. Spain:Santiago de Compostela, 22-27th June 2015.
- Campos C, Valente LMP, Fernandes JMO. Molecular evolution of zebrafish dnmt3 genes and thermal plasticity of their expression during embryonic development. Gene. 2012;500:93–100.
- Dorts J, Falisse E, Schoofs E, et al. DNA methyltransferases and stress-related genes expression in zebrafish larvae after exposure to heat and copper during reprogramming of DNA methylation. Sci Rep. 2016;6:34254.
- Liu J, Hu H, Panserat S, et al. Evolutionary history of DNA methylation related genes in chordates: new insights from multiple whole genome duplications. Sci Rep. 2020;10:970.
- Schield DR, Walsh MR, Card DC, et al. EpiRADseq: scalable analysis of genomewide patterns of methylation using next-generation sequencing. Methods Ecol Evol. 2016;7:60–69.
- Baeverfjord G. Optimal incubation temperatures for rainbow trout (Oncorhynchus mykiss) eggs. Beyond Monocult Abstr Aquac Eur. 2003;33:119–120. Trondheim.
- Billard R. Reproduction in rainbow trout: sex differentiation, dynamics of gametogenesis, biology and preservation of gametes. Aquaculture. 1992;100:263–298.
- Weber GM, Martin K, Kretzer J, et al. Effects of incubation temperatures on embryonic and larval survival in rainbow trout, Oncorhynchus mykiss. J Appl Aquac. 2016;28:285–297.
- Velsen FPJ. Temperature and incubation in Pacific salmon and rainbow trout: compilation of data on median hatching time, mortality and embryonic staging. Can Data Rep Fish Aquat Sci. 1987;626:67.
- Ojanguren AF, Braña F. Thermal dependence of embryonic growth and development in brown trout. J Fish Biol. 2003;62:580–590.
- Akbarzadeh A, Günther OP, Houde AL, et al. Developing specific molecular biomarkers for thermal stress in salmonids. BMC Genomics. 2018;19:749.
- Pfaffl MW, Tichopad A, Prgomet C, et al. Determination of stable housekeeping genes, differentially regulated target genes and sample integrity: bestKeeper–Excel-based tool using pair-wise correlations. Biotechnol Lett. 2004;26:509–515.
- Pfaffl MW. A new mathematical model for relative quantification in real-time RT-PCR. Nucleic Acids Res. 2001;29:e45.
- Pfaffl MW, Horgan GW, Dempfle L. Relative expression software tool (REST) for group-wise comparison and statistical analysis of relative expression results in real-time PCR. Nucleic Acids Res. 2002;30:e36.
- Robles M, Couturier-Tarrade A, Derisoud E, et al. Effects of dietary arginine supplementation in pregnant mares on maternal metabolism, placental structure and function and foal growth. Sci Rep. 2019;9:6461.
- Konietschke F, Placzek M, Schaarschmidt F, et al. nparcomp : an R software package for nonparametric multiple comparisons and simultaneous confidence intervals. J Stat Softw. 2015;64.
- Peterson BK, Weber JN, Kay EH, et al. Double digest RADseq: an inexpensive method for De Novo SNP discovery and genotyping in model and non-model species. PLoS One. 2012;7:e37135.
- Lluch J, Servant F, Païssé S, et al. The characterization of novel tissue microbiota using an optimized 16S metagenomic sequencing pipeline. PLoS One. 2015;10:e0142334.
- Catchen J, Hohenlohe PA, Bassham S, et al. Stacks: an analysis tool set for population genomics. Mol Ecol. 2013;22:3124–3140.
- Li H. Aligning sequence reads, clone sequences and assembly contigs with BWA-MEM arXiv:1303. 3997v2 [q-bio.GN]. arXiv:1303.3997 [q-bio.GN]. 2013.
- Li H, Handsaker B, Wysoker A, et al. The sequence Alignment/Map format and SAMtools. Bioinformatics. 2009;25:2078–2079.
- Quinlan AR, Hall IM. BEDTools: A flexible suite of utilities for comparing genomic features. Bioinformatics. 2010;26:841–842.
- Berthelot C, Brunet F, Chalopin D, et al. The rainbow trout genome provides novel insights into evolution after whole-genome duplication in vertebrates. Nat Commun. 2014;5:3657.
- Bardou P, Mariette J, Escudié F, et al. jvenn: an interactive Venn diagram viewer. BMC Bioinformatics. 2014;15:293.
- Robinson MD, McCarthy DJ, Smyth GK. edgeR: a bioconductor package for differential expression analysis of digital gene expression data. Bioinformatics. 2010;26:139–140.
- Robinson MD, Oshlack A. A scaling normalization method for differential expression analysis of RNA-seq data. Genome Biol. 2010;11:R25.
- Lun ATL, Chen Y, Smyth GK. It’s DE-licious: a recipe for differential expression analyses of RNA-seq experiments using Quasi-likelihood methods in edgeR. In: Mathé E, Davis S, editors. Statistical genomics. Methods in molecular biology. Vol. 1418.New York, NY:Humana Press; 2016. p. 391–416.
- Conway JR, Lex A, Gehlenborg N. UpSetR: an R package for the visualization of intersecting sets and their properties. Bioinformatics. 2017;33:2938–2940.
- Laskowski KL, Doran C, Bierbach D, et al. Naturally clonal vertebrates are an untapped resource in ecology and evolution research. Nat Ecol Evol. 2019;3:161–169.
- Bossdorf O, Arcuri D, Richards CL, et al. Experimental alteration of DNA methylation affects the phenotypic plasticity of ecologically relevant traits in Arabidopsis thaliana. Evol Ecol. 2010;24:541–553.
- Dixon G, Liao Y, Bay LK, et al. Role of gene body methylation in acclimatization and adaptation in a basal metazoan. Proc Natl Acad Sci U S A. 2018;115:13342–13346.
- Massicotte R, Whitelaw E, Angers B. DNA methylation: A source of random variation in natural populations. Epigenetics. 2011;6:421–427.
- Leung C, Breton S, Angers B. Facing environmental predictability with different sources of epigenetic variation. Ecol Evol. 2016;6:5234–5245.
- Massicotte R, Angers B. General-purpose genotype or how epigenetics extend the flexibility of a genotype. Genet Res Int. 2012. Article ID 317175.
- Rebl A, Verleih M, Köbis JM, et al. Transcriptome profiling of gill tissue in regionally bred and globally farmed Rainbow Trout strains reveals different strategies for coping with thermal stress. Mar Biotechnol. 2013;15:445–460.
- Verleih M, Borchel A, Krasnov A, et al. Impact of thermal stress on kidney-specific gene expression in farmed regional and imported Rainbow Trout. Mar Biotechnol. 2015;17:576–592.
- Wang Y, Liu Z, Li Z, et al. Effects of heat stress on respiratory burst, oxidative damage and SERPINH1 (HSP47) mRNA expression in rainbow trout Oncorhynchus mykiss. Fish Physiol Biochem. 2016;42:701–710.
- Defo MA, Gendron AD, Head J, et al. Cumulative effects of cadmium and natural stressors (temperature and parasite infection) on molecular and biochemical responses of juvenile rainbow trout. Aquat Toxicol. 2019;217:105347.
- Aluru N, Kuo E, Helfrich LW, et al. Developmental exposure to 2,3,7,8-tetrachlorodibenzo-p-dioxin alters DNA methyltransferase (dnmt) expression in zebrafish (Danio rerio). Toxicol Appl Pharmacol. 2015;284:142–151.
- Bouwmeester MC, Ruiter S, Lommelaars T, et al. Zebrafish embryos as a screen for DNA methylation modifications after compound exposure. Toxicol Appl Pharmacol. 2016;291:84–96.
- Richards EJ. Inherited epigenetic variation — revisiting soft inheritance. Nat Rev Genet. 2006;7:395–401.
- Huang J, Li Y, Liu Z, et al. Transcriptomic responses to heat stress in rainbow trout Oncorhynchus mykiss head kidney. Fish Shellfish Immunol. 2018;82:32–40.
- Lewis JM, Hori TS, Rise ML, et al. Transcriptome responses to heat stress in the nucleated red blood cells of the rainbow trout (Oncorhynchus mykiss). Physiol Genomics. 2010;42:361–373.
- Li Y, Huang J, Liu Z, et al. Transcriptome analysis provides insights into hepatic responses to moderate heat stress in the rainbow trout (Oncorhynchus mykiss). Gene. 2017;619:1–9.
- Vornanen M, Hassinen M, Koskinen H, et al. Steady-state effects of temperature acclimation on the transcriptome of the rainbow trout heart. Am J Physiol Regul Integr Comp Physiol. 2005;289:1177–1184.
- Rebl A, Verleih M, Nipkow M, et al. Gradual and acute temperature rise induces crossing endocrine, metabolic, and immunological pathways in Maraena Whitefish (Coregonus maraena). Front Genet. 2018;9:241.
- Ojima N, Yamashita M, Watabe S. Quantitative mRNA expression profiling of heat-shock protein families in rainbow trout cells. Biochem Biophys Res Commun. 2005;329:51–57.
- Makesh M, Sudheesh PS, Cain KD. Systemic and mucosal immune response of rainbow trout to immunization with an attenuated Flavobacterium psychrophilum vaccine strain by different routes. Fish Shellfish Immunol. 2015;44:156–163.
- Pasquier J, Cabau C, Nguyen T, et al. Gene evolution and gene expression after whole genome duplication in fish: the PhyloFish database. BMC Genomics. 2016;17:368.
- Johnson MC, Sangrador-Vegas A, Smith TJ, et al. Molecular cloning and expression analysis of rainbow trout (Oncorhynchus mykiss) matrix metalloproteinase-9. Fish Shellfish Immunol. 2004;17:499–503.