
ABSTRACT
Here we report epigenomic and transcriptomic changes in a prototypical J774 macrophage after engulfing talc or titanium dioxide particles in presence of estrogen. Macrophages are the first immune cells to engage and clear particles of various nature. A novel paradigm is emerging, that exposure to so-called ‘inert’ particulates that are considered innocuous is not really free of consequences. We hypothesized that especially the insoluble, non-digestible particles that do not release a known hazardous chemical can be underappreciated agents acting to affect the regulation inside macrophages upon phagocytosis. We performed gene chip microarray profiling and found that talc alone, and especially with oestrogen, has induced a substantially more prominent gene expression change than titanium dioxide; the affected genes were involved in pathways of cell proliferation, immune response and regulation, and, unexpectedly, enzymes and proteins of epigenetic regulation. We therefore tested the DNA methylation profiles of these cells via epigenome-wide bisulphite sequencing and found vast epigenetic changes in hundreds of loci, remarkably after a very short exposure to particles; ELISA assay for methylcytosine levels determined the particles induced an overall decrease in DNA methylation. We found a few loci where both the transcriptional changes and epigenetic changes occurred in the pathways involving immune and inflammatory signalling. Some transcriptomic and epigenomic changes were shared between talc and titanium dioxide, however, it is especially interesting that each of the two particles of similar size and insoluble nature has also induced a specific pattern of gene expression and DNA methylation changes which we report here.
Introduction
Epigenetic regulation plays an important role in maturation and functioning of phagocytes [Citation1]; however, short-term epigenetic changes that occur during phagocytosis have not been studied. The data that engulfment of certain bacteria lead to epigenetic changes in the macrophages (MФ) [Citation2] led us to hypothesize that phagocytosis of any particle can be associated with DNA methylation changes.
MФs engulf particles quickly and to the extent that they can become overloaded; this especially occurs when particles are non-digestible [Citation3–5]. Uptake and especially persistence of non-digested particles may contribute to disease by activating or inhibiting mechanisms in the MФs. We sought to test this paradigm using two types of insoluble particles, generally considered ‘immunologically inert’ and vastly used in cosmetics and food products: talc (T) and titanium dioxide (TiO2); they are recently becoming recognized as not entirely innocuous. Previously we show that talc particles, especially in the context of increased oestrogen (E) levels, impair the tumoricidal function of MФ allowing more ovarian cancer cells in a co-culture [Citation6]; the study aims to provide a feasible mechanistic explanation to the intriguing epidemiological data linking talcum powder with ovarian cancer [Citation7]. In another model, we linked the exposure to titanium dioxide (TiO2) particles and airway inflammation, again seen more so at high oestrogen levels [Citation8,Citation9]. While in both models the MФ is a key and primary cell engaging the particles, the mechanisms affected by T or TiO2 in the MФ remained unknown.
Here we performed epigenomic and transcriptomic analysis of prototypical macrophages (J774) after incubation with talc or TiO2 particles with or without oestrogen to determine expression and methylation signatures resulting from these exposures and to detect potential biological pathways that could explain the pro-cancer and pro-inflammatory changes in the MФs.
Materials and methods
We used phagocytic murine cells line J774 (ATCC; Manassas, VA): these ‘chromosomally female’ cells have been widely used as a macrophage/phagocyte model cell line [Citation10,Citation11] including studies of particle phagocytosis (e.g [Citation12].), and of the effects of female hormones on macrophage responses [Citation13] including our own prior studies [Citation6,Citation9]. The cells were maintained in 100-mm Petri dishes in DMEM (for J774) free of phenol red, supplemented with 10% FBS, 2 mM L-glutamine, penicillin (100 U/mL), streptomycin (100 µg/mL) and 10 mM HEPES. Prior to experiments, the cells were serum-starved for 48 hrs. in Macrophage-SFM (serum-free medium) (Gibco/Life Sciences). Adherent cells in tissue culture plates (Corning) were then treated to 2 µg/mL of 17-β oestradiol (E2) (cell culture grade, Sigma Aldrich) or ethanol used as vehicle control; the following day they were treated to talc and TiO2 particles as follows.
Talc (Mg3Si4O10(OH)2, CAS Registry Number: 14,807–96-6, USP grade, particle diameter < 10 µm, was obtained via JT Baker (Batch No: 0000184513); the specimen is certified by the manufacturer as asbestos-free and we have not tested the material for contamination. The particles were suspended in PBS and filtered through 30 µm nylon mesh filters (no visible loss of material has occurred). We did not use any commercial talc products.
Titanium dioxide (TiO2), CAS Registry Number 13,463–67-7, control particles (with mean particle size of ∼1 µm) were a gift from Dr. L. Kobzik (Harvard School of Public Health, Boston, MA); these were used previously in our studies [Citation6,Citation8,Citation9].
Freshly sonicated (via Qsonica Q55 probe sonicator, setting of 10, 10 seconds with 10-s intervals, 3 times, on ice) particle suspensions were added at 10 µg/well with a fresh dose of oestradiol at the same time. 24 hours later the cells were processed for total RNA isolation via Qiagen RNEasy protocol with in situ lysis using the RLT buffer, or, in separate wells, for total DNA isolation via Qiagen DNEasy kit. Total RNA and DNA quality and quantity were assessed spectrophotometrically using NanoPhotometer N120 (Implen).
These protocols were tested previously and did not affect the viability of the cells [Citation6].
Microarray. Gene chip microarray expression profiling was performed at Brown University Genomics Core using GeneChip™ Mouse Gene 2.0 ST Arrays (Affymetrix).
Global DNA methylation (5-mc) of DNA isolated from J774 cells cultured under the indicated conditions was evaluated using 5-mc ELISA Easy Kit (Epigentek, Farmingdale, NY) following the manufacturer’s instruction. Briefly, 100 ng/well of sample DNA along with controls for a standard curve were bound to the assay plate, and then detection solution was added to the wells. Colorimetric analysis was done by measuring absorbance at 450 nm. The percentage of methylated DNA (5-mc) in total DNA was calculated using the following formula:
5-mc% = [(Sample OD – NC OD)/Slope x S] x 100%. NC; negative control, S is the amount of input sample DNA in ng.
Reduced-representation bisulphite sequencing (RRBS) [Citation14,Citation15] is the optimal method for genome-scale analysis of DNA methylation: it provides an efficient way to generate absolute quantification of methylation of more than 1 million CpG sites at single base-pair resolution with enrichment in loci more likely to be linked to transcriptional deregulation [Citation16,Citation17]. In brief, this method combines DNA digestion with a methylation-insensitive restriction enzyme and size selection to isolate a reproducible subset of the genome. This ‘reduced representation’ is sequenced using next-generation platforms, after an optimized bisulphite-treatment (to identify methylation marks) and Illumina library preparation. RRBS assay was performed by the Weill-Cornell Epigenomics Core.
Data analysis
Standard methods for data other than genomic and epigenomic profiling. Data are presented as Mean ± SEM. Data plotting and statistical analysis were performed using Excel 2007 (Microsoft) and Prism 7.02 (GraphPad Software); statistical significance was accepted when p < 0.05. To estimate significance of differences between groups we used the non-parametric Mann–Whitney U test, one-way or two-way ANOVA with Tukey, Fisher or Holme-Sidak tests, or Kruskal–Wallis ANOVA with Dunn’s or Dunnett’s test as dictated by the number of groups, data normality and experimental question.
Microarray data
Raw data were normalized with quantile background adjustment using RMA Express (v1.20) and extracted as natural scale values into a single tab-delimited data matrix. Statistical analyses were conducted using TIGR MeV 4.5.1 or 4.9.0. All datasets were filtered above the value of 20 to exclude the noise from unexpressed genes. We used Support Trees (ST) clustering analysis, Significance Analysis for Microarray (SAM), 2-factor Analysis of Variance (ANOVA) and Linear Models for Microarray Data (LIMMA) methods.
Parameters. ST: Bootstrapping over 100 iterations, Euclidean Distance metric, Average Linkage clustering. SAM: 2-class unpaired SAM was performed separately for talc+oestrogen vs. vehicle or for titanium+oestrogen vs. vehicle, ignoring other samples; using only unique permutations, S0 selected using Tusher et al. method, no q-values, imputation engine: K nearest neighbours; FDR ~1.3; average linkage clustering with Pearson l. ANOVA: 2- factor ANOVA was performed with p-values based on F distribution, critical p-value cut-offs 0.01 or 0.001, just alpha (no correction). LIMMA: Multi-class (6-class) analysis with p-value cut-offs p < 0.05, p < 0.01, p < 0.01. Default settings.
For heatmaps, green indicates lower expression and red – higher expression, colour brightness is proportionate to the value of each gene.
The raw data were deposited via NCBI Gene Expression Omnibus (GEO), accession no. GSE135238 [Citation18].
Epigenome-wide methylation data
Initial QC of raw reads was run using ‘FASTQC’ [Citation19]. Reads were trimmed using ‘Trim Galore‘ [Citation20] using the following settings: quality 20, adapter AGATCGGAAGAGC, stringency 1, length 50. ‘Bismark’ was used to prepare the reference genome (Ensembl Release 89 of GRCm38) and to align trimmed reads using the bowtie2 parameter [Citation21]. Bismark methylation extractor was used to extract methylation information using the following parameters: bedGraph, comprehensive, ignore 3-s, merge_non_CpG.
The edgeR package was used to find differentially methylated loci [Citation22]. The glMFit function was used to fit a negative binomial-generalized log-linear model. The experimental design matrix was constructed using modelMatrixMeth with a factorial experimental design (~hormone* treatment). The glmLRT function was used to find differentially methylated loci (DML) for comparisons of interest, which were made by constructing contrast vectors. Individual CpG sites were considered differentially methylated if the nominal p-value was < 0.02 and if the CpG was within 5 kilobases upstream or downstream of a transcription start site. Interaction term contrasts were only explored for loci where the inclusion of the interaction terms better fit the data (e.g., p-values were < 0.02 for glmLRT with both interaction coefficients).
The raw data were deposited via NCBI Gene Expression Omnibus (GEO), accession no. GSE150322 [Citation23].
Results
Transcriptomics
Support trees
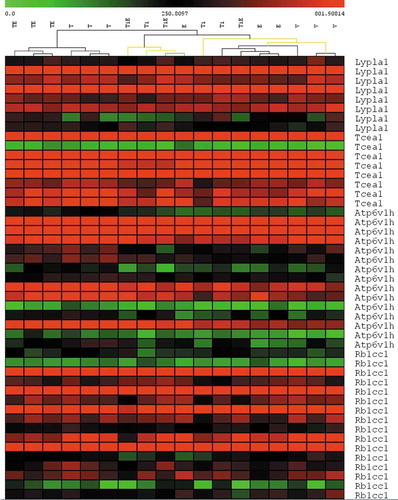
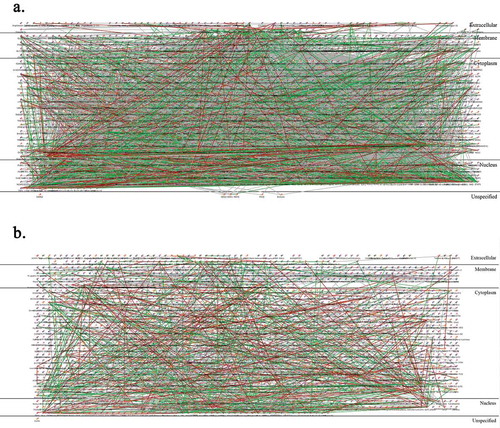
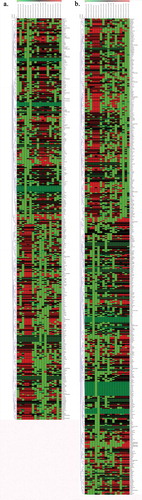
ST clustering analysis entails unsupervised clustering of samples to reflect the similarity between samples in the dataset. ST clustering () shows that all 3 talc+oestrogen (TE) samples were most dissimilar with vehicle (Veh, V) control samples. Talc alone (T) samples were clustering close to TE samples, and were second most dissimilar with Veh. This indicates that talc alone, and especially talc with oestrogen, has induced the most changes in the dataset compared to vehicle control.
Figure 1. ST clustering of microarray data (crop). Colour is proportional to gene value (green = low, red = high). Each row represents a separate probeset and each column represents a sample. (TE = Talc + Oestrogen, T = Talc, TiE = Titanium Dioxide + Oestrogen, Ti = Titanium Dioxide, E = Oestrogen and V = Vehicle Control)
SAM
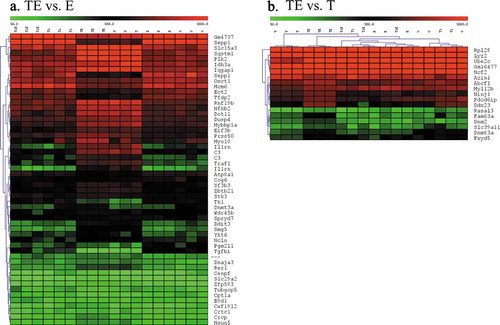
Significance Analysis of Microarrays (SAM) is one of the more stringent statistical analyses that identifies highly significant genes in microarray data comparisons. shows that approximately 10 times more genes were significantly different after talc and oestrogen exposure (A) vs. titanium dioxide and oestrogen (B) when either was compared to vehicle control. displays the specific input of talc (A) and oestrogen (B); the result indicates that talc had a substantially stronger influence than oestrogen.
Figure 2. Heatmaps of hierarchical clusters after SAM analysis showing the number of significantly different probesets when comparing (a) TE vs. Vehicle, or (b) TiE vs. Vehicle. FDR: = 1.35. (n) = 3 per group. Colour is proportionate to expression (RMA) value (green = low, red = high). Rows have been normalized. TiE = Titanium Dioxide + Oestrogen, Ti = Titanium Dioxide; TE = Talc + Oestrogen, T = Talc, E = Oestrogen and V = Vehicle Control. (N) = 3)
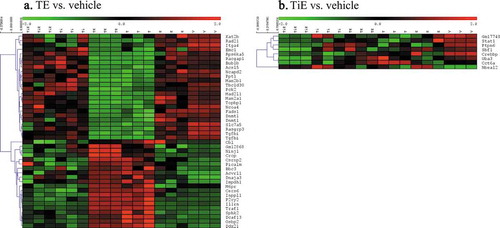
Figure 3. Heatmaps of hierarchical clusters after SAM analysis showing the number of significantly different probesets when comparing (a) TE vs. E, or (b) TE vs. T. FDR: = 0.8. (n) = 3 per group. Colour is proportionate to expression (RMA) value (green = low, red = high). (TiE = Titanium Dioxide + Oestrogen, Ti = Titanium Dioxide; TE = Talc + Oestrogen, T = Talc, E = Oestrogen and V = Vehicle Control. (N) = 3)
2-factor ANOVA
To study further the effect of talc and oestrogen individually and combined we conducted a 2-factor Analysis of Variance (ANOVA). This analysis measures the interaction effect the two factors had on gene expression. demonstrates the amount of probesets significantly changed by two factors, talc and oestrogen, and their interaction. Talc-significant probesets were substantially greater than oestrogen significant. Their interaction shows slightly more significant probesets than oestrogen alone. In combination the results suggest that the input of talc was much more substantial than the effect of oestrogen, consistent with SAM results. ANOVA results also demonstrate the TiO2 induced substantially lesser effect than talc.
Figure 4. Two-factor ANOVA Analysis. (a). Number of significant probesets affected by talc alone, oestrogen alone and both (interaction). (b). Same, for TiO2. Cut-offs p < 0.01 (left bar) or p < 0.001 (right bar)
LIMMA
Grouped analysis using Linear Models for Microarray Data (LIMMA) enables the differential expression analysis of multiple groups and factors. Each experimental condition (e.g. talc alone, TiO2 alone, oestrogen alone, talc+oestrogen, TiO2+ oestrogen and vehicle) were compared to each other. The following trends can be observed in : 1) Macrophages exposed to talc alone or in combination with oestrogen show significantly more differently expressed probesets than macrophages exposed to titanium dioxide alone or in combination with oestrogen when compared to vehicle control or oestrogen alone. 2) Comparisons between the two types of particles (with or without oestrogen) also show a great amount of significantly expressed probesets, suggesting the nature of the particle does affect the outcome.
Figure 5. LIMMA Analysis. Group comparisons. Left blank bars have a p < 0.01 cut-off and right black bars have a p < 0.05 cut-off. (TE = Talc + Oestrogen, T = Talc, TiE = Titanium Dioxide + Oestrogen, Ti = Titanium Dioxide, E = Oestrogen and Veh = Vehicle Control)
Comparison to PCR array
We previously performed a PCR array testing of a small set of relevant genes using the same exposure, and identified a cluster of genes upregulated by talc or downregulated by talc [Citation6]. We wanted to see whether the broader microarray approach reproduces the initial finding. Therefore, we hand-picked the values for probesets corresponding to the genes tested via PCR array in [Citation6] and produced a heatmap seen in . We conclude that the gene expression results were generally consistent between the two methods.
Figure 6. (a) Comparison of microarray data to previously published [Citation6] Cancer PathwayFinder RT2 Profiler PCR array data. (b) Inhibitory Effect of talc alone and in combination with oestrogen on macrophages after 24 h exposure when compared to other samples. (c) Stimulatory effect of talc alone and in combination with oestrogen. (TiE = Titanium Dioxide + Oestrogen, Ti = Titanium Dioxide, TE = Talc + Oestrogen, T = Talc, E = Oestrogen and V = Vehicle Control). (n) = 3/group. Colour is proportional to gene value (green = low, red = high)
![Figure 6. (a) Comparison of microarray data to previously published [Citation6] Cancer PathwayFinder RT2 Profiler PCR array data. (b) Inhibitory Effect of talc alone and in combination with oestrogen on macrophages after 24 h exposure when compared to other samples. (c) Stimulatory effect of talc alone and in combination with oestrogen. (TiE = Titanium Dioxide + Oestrogen, Ti = Titanium Dioxide, TE = Talc + Oestrogen, T = Talc, E = Oestrogen and V = Vehicle Control). (n) = 3/group. Colour is proportional to gene value (green = low, red = high)](/cms/asset/24a02f03-a256-4f5b-a83f-381e0b1185cd/kepi_a_1834925_f0006_oc.jpg)
Pathway analysis
We used the LIMMA p < 0.01 TE vs. V list of 3684 probesets to determine pathways where the genes with altered expression are involved. This list produced 1619 unique network objects in GeneGo Metacore pathway analysis tool. The analysis indicated that top 50 pathways could be grouped into the following processes: 1) Cell division/proliferation, 2) Macrophage phagocytosis/particle phagocytosis, 3) Immune response signalling pathways (OX40/OX40L, IL-1, IL-4, IL-6, IL-11, NF-kappaB, TNFR2, TLRs, TGFb and others), 4) MHC class 1 presentation, 5) Oxidative stress/ROS induced signalling, 6) Oestrogen/ESR1 signalling, 7) Apoptosis, 8) Epigenetic control of gene transcription. represents a Direct Interactions network, showing that the genes we identified as significantly affected were involved in interrelated pathways; the number of connections was substantially higher than in a control random list of gene names which indirectly confirms that the results are biologically meaningful.
Figure 7. Metacore GeneGo Pathway analysis: Direct interactions network. (a). 1619 unique gene names from the list of significantly different probesets between TE and Vehicle via LIMMA at p < 0.01 stringency. (b) Control random list of 1620 gene names. Titanium dioxide particles did not induce enough changes to build a network
Epigenetic involvement was a particularly interesting finding; as evident from number of epigenetically acting factors have changed expression, among them DNA methyltransferase 1 (DNMT1) was most substantially downregulated by both particles, but to a greater extent by talc ().
Figure 8. Pathway analysis. A predesigned map entitled ‘Epigenetic control of transcription’ in Metacore GeneGo with highlighted genes (depicted with red bar sets where bar height is proportionate to RMA expression value) determined to be significantly different between TE and Vehicle via LIMMA. (1 = TiE, 2 = Ti, 3 = TE, 4 = T, 5 = E, 6 = V; (n) = 3)
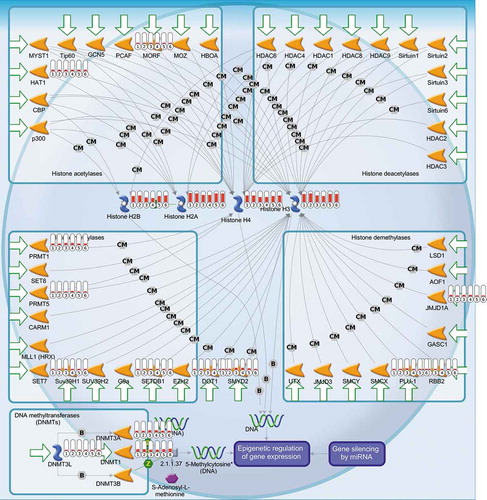
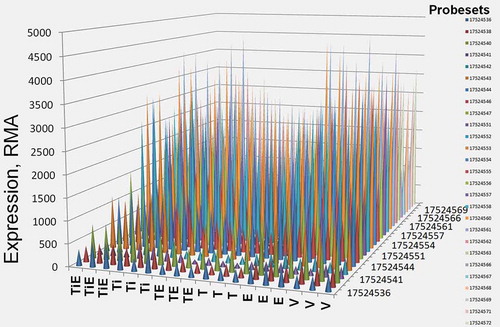
Figure 9. DNMT1 expression. Normalized and background adjusted RMA expression values for the 27 probesets interrogating DNMT1 gene shown across individual samples
mC ELISA
Because ‘epigenetic control of gene transcription’ was one of the involved pathways (), we tested the levels of overall DNA methylation (percentage of methylated cytosines) after talc and TiO2. As shown in , average 5-mc % in the control cells (3.27 ± 0.10%, Mean ±SEM, n = 3) was significantly higher than in talc (2.44 ± 0.25%, n = 3, p < 0.05) or in titanium (1.75 ± 0.10%, n = 3, p < 0.01) treated cells. Co-treatment with oestrogen significantly reduced the 5-mc % in the talc-treated cells (1.45 ± 0.22%, n = 3, p < 0.05), but neither in the control (2.94 ± 0.27%, n = 3) nor in the titanium-treated cells (1.91 ± 0.36%, n = 3).
Figure 10. 5-mC ELISA. DNA samples were evaluated for global DNA methylation (5-mC) by ELISA. Values represent mean ± SEM (N = 3) from duplicated samples for each treatment at varying conditions. *, p < 0.05, **, p < 0.01. (a) One representative experiment of 3 is shown. (b) Pooled data from 3 experiments
We therefore performed a detailed analysis of DNA methylation changes via RRBS.
Epigenomics
Analysis of RRBS data indicates that both talc and TiO2 exposures were associated with vast changes in the DNA methylation profiles; this was true at a various stringencies and seen via different statistical methods (), here we report a representative set of results via the model we selected as described in Methods and using p < 0.02 as a cut-off threshold. We selected only the loci 5000 bp up- or downstream of the transcription start site to identify the effects that most likely are associated with transcriptional regulation. Raw data are available via NCBI GEO [GSE150322]; the analysis algorithm is available via Github.
Figure 11. RRBS data analysis. Number of DMLs resultant from different comparisons. DMLs between (a) talc effect for oestrogen and no oestrogen, and (b) between TiO2 effect for oestrogen and no oestrogen: P value threshold <0.05. (c) TE vs. E at P value threshold <0.02 and (d) TiE vs. E: P value threshold <0.02 and filtered to only include loci <5000 bp from a nearest transcript. (n) = 3 each group
First, we aimed to determine how many differentially methylated loci (DML) occur after exposure to either particle at stringency p < 0.05. We found 1243 DMLs for talc interaction and 883 DMLs for TiO2 interaction (). Then we determined the DMLs occurred in presence of oestrogen vs. oestrogen alone using p < 0.02 stringency after filtering the data to include loci 5000 bp up- or downstream of the transcription start site. We found 402 DMLs in TE vs. E alone comparison, and 477 DMLs in TiE vs. E alone comparison (). Among these, 91 loci were the same for both particles and the others were unique to each. We then compared a list of DMLs induced by talc in the oestrogen milieu (TE vs E) to the list of DMLs induced by talc in absence of oestrogen (T vs. Veh.) using a ‘contrast’ approach and found 447 DMLs; a similar comparison for TiO2 resulted in 533 DMLs.
Figure 12. Hierarchical clustering of DML values. (a). TE vs E. (b) TiE vs E). Colour is proportionate to row-normalized CpG methylation values (green = low, red = high). Rows have been normalized. (Veh = Vehicle Control, E = Oestrogen, T = Talc, TE = Talc + Oestrogen, Ti = Titanium Dioxide, TiE = Titanium Dioxide + Oestrogen)
Next, we looked for overlapping gene names in the list of TE vs E DMLs and the list of differentially expressed targets from the microarray results (output of LIMMA p < 0.05, n = 9211 probesets) and found only 50 overlapping gene names. Similarly, comparison of T vs Vehicle DMLs had only 39 overlapping gene names and they were largely not the same as in the previous comparison. We conclude that the epigenome-wide DNA methylation changes we detected are largely not associated with a resultant transcription change.
Pathway analysis
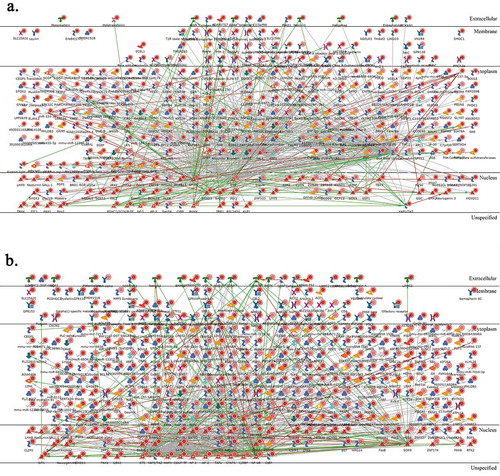
Pathway analysis of TE vs. E comparison allowed 337 unique annotated gene names; in a ‘direct interactions’ network they have shown a good extent of interacting with 577 edges () involving, among others: WNT/beta-catenin, NF-kappa B, and ETS1 transcription pathways and TAL1 protein interactions as well as SMAD3 pathway. In contrast, TiE vs. E comparison allowed 381 unique annotated gene names but resulted in a less involved ‘direct interactions’ network with only 493 edges (), the bigger hubs here also included ETS1 and NF-kappa B but, uniquely, SOX9 and HNF3-beta. Hence, we conclude that there were some shared and some unique loci of DNA methylation change induced by talc and titanium. The characteristic signatures of exposure can be found in and supplementary tables.
Figure 13. Pathway analysis. Metacore ‘Direct interactions’ networks for TE vs. E comparison (a) and TiE vs. E comparison (b)
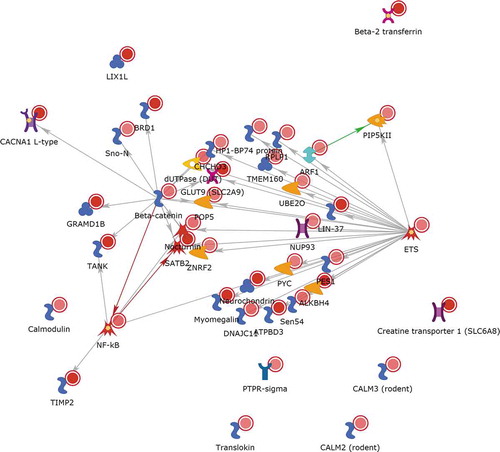
shows a ‘direct interactions’ network for the 50 (38 annotated) gene names seen in both the list of DMLs in a TE vs. E comparison and the list of differentially expressed genes in the same comparison, i.e., those where epigenetic change is accompanied by transcriptional change. It appears most genes in this list interact with each other, mainly because of their link to NF-kappa B and another transcription factor ETS. The other approaches to link epigenomic and transcriptomic effects were less informative.
Figure 14. A Metacore ‘direct interactions’ network using the list of 50 gene names where both differential methylation and differential expression was induced by talc in the presence of oestrogen
In summary, we report that a 24 h in vitro exposure of J774 MФs to talc particles alone, and especially to a combination of talc with oestrogen leads to substantial genome-wide gene expression changes that occur to a much lesser extent after exposure to TiO2 particles with or without oestrogen. Among the pathways affected, epigenetically acting enzymes were involved, especially striking was the inhibition of DNMT1 expression. We therefore sought, and found, substantial epigenome-wide DNA methylation changes after exposure to both talc and TiO2 (in the context of oestrogen or alone) seen as a decline of overall DNA methylation and as specific bidirectional changes in methylation in hundreds of loci. We found a few loci where both the transcriptional changes and epigenetic changes occurred at the same time in the pathways involving immune and inflammatory signalling. We note, that while some transcriptomic and epigenomic changes were shared between T and TiO2, it is especially interesting that each of the two particles of very similar size and insoluble, monocomponent, and non-digestible nature has also induced a specific pattern of gene expression and DNA methylation changes.
Discussion
Epigenetic regulation plays a very important and substantial role in macrophage functions [Citation1]; aberrations in the epigenome can lead to compromised immune responses [Citation24]. Phagocytosis is a complex process involving activation of a broad spectrum of cellular mechanisms including gene expression changes [Citation25]; these changes are linked to epigenetic mechanisms including DNA methylation. While some changes are ubiquitous to the various processes of phagocytosis, others can be characteristic to a phagocytized object.
Here, we used two types of insoluble particles, generally considered ‘inert’ and often used as control particulates in studies of other, more ‘toxic’ environmental particles. Talc and TiO2 are broadly used in cosmetics, medical and food products. However, these particulates are not entirely innocuous; hence, while one particle in this study serves as a control for the other, both represent biological phenomena that we hypothesized may involve epigenetic deregulation.
Talc (hydrous magnesium silicate) is a mined product considered ‘inert’ and used in cosmetics including ‘baby powder’. The International Agency for Research on Cancer (IARC) has recently concluded that even talc not contaminated by asbestiform fibres (a carcinogenic contaminant seen in talc in the past) is possibly carcinogenic to humans (class 2b) [Citation26]. Epidemiology data suggest an increase in ovarian cancer risk for women who used cosmetic talc powder in the genital area [Citation27,Citation28]. Particles the size of talc, if they are present in the vagina, can traverse to the upper female genital tract and have been detected in and around tumour-associated immune cells, particularly inside the cytoplasm of macrophages in specimens from ovarian cancer patients with the history of perineal talc use [Citation29]. The talc association was more apparent in premenopausal women and those postmenopausal women who were taking oestrogen replacement therapy [Citation27] suggesting higher oestrogen may fuel the pathogenesis. The most current meta-analysis confirms the association [Citation7], however the potential mechanism has remained elusive. We recently show that J774 (or IC21) macrophages exposed to talc particles are less capable to curb the growth of OC cells in vitro [Citation6], hence, we postulated the increased cancer risk may be mediated by inhibitory effect of talc on the MФ.
Titanium dioxide is an insoluble particulate that is seen mostly as fine-size particles (but also is increasingly used in nano-size) as a component of white pigment broadly applicable from white paint to toothpaste and other cosmetic and food products [Citation30,Citation31] and while human exposure to it has become almost ubiquitous, it is also not as entirely innocuous as considered. TiO2 contributes to inflammation [Citation8,Citation9,Citation32], cancer [Citation33,Citation34] and asthma [Citation8,Citation35], and as pointed out by IARC no biomarkers of exposure have been identified in spite of various health risks [Citation34]. Similar to talc, TiO2 is not digestible and has also been shown to accumulate inside macrophages [Citation36]. We previously show that TiO2 exposure during pregnancy is inflammatory to the airways of pregnant mice and is linked to increased asthma risk in their neonates [Citation8] which led us to hypothesize that TiO2 may also have epigenetic effects. We have also previously linked oestrogen to how macrophages interact with TiO2 [Citation9].
Besides the chemical composition, one potential difference worth noting is that it is impossible to guarantee that all particles are identical in size because particles derived from naturally mined products will have an especially broad size distribution differing from batch to batch and even in the same bottle (bottom layer vs. top). However, as evident from micrographs in [Citation6] the average size of both particles is approximately the same ranging from 1 µm to 10 µm.
Of note, while oestrogen is considered to exert its action to promote tumour growth and progression directly through oestrogen receptors in cancer cells, our data show that oestrogen also has synergic effect with talc/TiO2 to induce genetic and epigenetic changes in the murine MФ cell line J774. The finding helps explain our data [Citation6] on compromised tumoricidal activity of the immunocompetent cells and consequently on how oestrogen helps promote progression of the cancer cells indirectly. Notably, the doses of particles and oestrogen used here were selected so that they do not interfere with cell viability, as determined previously [Citation6].
Our transcriptional profiling builds on prior exploratory PCR array results that identified inhibition of ‘useful’ genes involved in anti-tumorigenic activity and upregulation of extraneous procarcinogenic factors by talc [Citation6]. The ST2.0 array data reported here validate and expand the prior findings. Here we show that talc particles had substantially stronger transcriptomic effects than TiO2, a combination of talc + oestrogen had marginally more effect than talc alone, and that talc is more ‘important’ than oestrogen. With lower stringency however TiO2 exposure has also led to transcriptional responses, consistent with the expectation that the act of phagocytosis itself involves gene expression changes.
Pathway analysis has identified that the pathways affected by talc included cell proliferation, immune responses and signalling, immunosurveillance, apoptosis. These results help explain our prior finding of reduced tumoricidal activity of J774 cells after talc exposure [Citation6]. While we did not observe increase in necrotic or apoptotic staining in prior experiments using this exposure protocol [Citation6], we note that expression of relevant genes has been affected. We were intrigued to see that one of the pathways heavily involved was the epigenetic ‘machinery’; we were interested especially in DNA methylation because the expression profiles of DNA methyltransferase 1 (DNMT1) have shown a particularly consistent and prominent inhibition by talc and, to a lesser extent, by TiO2, () hence we tested the overall DNA methylation levels using mC ELISA. The results indicated that both types of particles induced a substantial decline in overall mC levels () and prompted for a more detailed analysis of the affected loci via RRBS.
Epigenomic analysis revealed that both types of particles, with or without oestrogen, induced a substantial DNA methylation change. The epigenomic signatures of the exposures can be found in the supplementary files. At lower stringency (p < 0.05) talc induced a higher number of DMLs than titanium, however, the number of DMLs was approximately similar at higher stringency (p < 0.02) and when filtered ± 5000 bp of the nearest transcript (). It is notable that these changes have occurred over a fairly short exposure time (24 hours). Others have reported that DNA methylation changes can occur over relatively short time [Citation37–39] but not quite that short. Specifically, there has been more interest in the long-term, lifetime exposure effects when it comes to particulate matter [Citation40]. We believe we are the first to show that a single short-term exposure of MФs in vitro to particles can be linked to epigenome-wide DNA methylation changes. This is consistent with our in vivo studies showing that a single maternal exposure to particles can lead to increased inflammatory (asthma) risk in the neonates [Citation8,Citation9] that can be transgenerationally transmitted to 3 generations of progeny potentially via an epigenetic mechanism [Citation41].
Our epigenomic data analysis aimed to identify loci that are more likely to be involved into transcriptional deregulation. For this we filtered the DMLs to only include those that are within 5000 bp of a known transcript. We then compared this list of DMLs to the lists of differentially expressed genes from the transcriptomic assay and found ~50 such loci which represents approximately 10% of all DMLs. For the TE vs. E analysis, these 50 genes have mostly directly interacted around two transcription factors (NF-kappa B and ESR) that were found on this list () indicating possible involvement of inflammatory/immune deregulation. As evident from the supplementary tables these loci were largely not the same comparing talc+oestrogen effect and talc alone effect. We conclude that the data do not suggest a strong potential for mechanistic involvement of the DMLs we identified with the transcriptional changes we observe at the moment. This is consistent with findings by others that in antigen-presenting cells gene activation precedes DNA demethylation and not the other way around [Citation42]. In general, it is not uncommon in studies linking DNA methylation and gene expression changes to observe that only either phenomenon occurs to a subset of genes while another subset shares both types of alterations, e.g [Citation41]. In part, this likely occurs because DNA methylation is not the only mechanism of gene transcription control. It is also possible that a longer incubation period could allow revealing more transcriptional changes in the loci with altered DNA methylation; however, this was beyond the scope of our study. As a result of our work, however, we postulate that the ‘reshuffle’ of epigenetic machinery induced by the particles may be responsible for downstream malfunctioning of the exposed MФs we found: the reduced tumoricidal function induced by talc [Citation6] and the enhanced pro-inflammatory responses induced by TiO2 [Citation8,Citation9]. Overall, our study has led to this ‘two-hit’ hypothesis that merits further testing.
Supplemental Material
Download MS Excel (1.4 MB)Disclosure statement
The authors declare no conflict of interest.
Supplementary material
Supplemental data for this article can be accessed here.
Additional information
Funding
References
- Chen S, Yang J, Wei Y, et al. Epigenetic regulation of macrophages: from homeostasis maintenance to host defense. Cell Mol Immunol. 2020;17(1):36–49. PMC6952359.
- Marr AK, MacIsaac JL, Jiang R, et al. Leishmania donovani infection causes distinct epigenetic DNA methylation changes in host macrophages. PLoS Pathog. 2014;10(10):e1004419. PMC4192605.
- Kawasaki H. A mechanistic review of particle overload by titanium dioxide. Inhal Toxicol. 2017;29(12–14):530–540. PMID: 29458306.
- Warheit DB, Overby LH, George G, et al. Pulmonary macrophages are attracted to inhaled particles through complement activation. Exp Lung Res. 1988;14(1):51–66. PMID: 2830106.
- Gilberti RM, Knecht DA. Macrophages phagocytose nonopsonized silica particles using a unique microtubule-dependent pathway. Mol Biol Cell. 2015;26(3):518–529. PMC4310742.
- Mandarino A, Gregory DJ, McGuire CC, et al. The effect of talc particles on phagocytes in co-culture with ovarian cancer cells. Environ Res. 2020;180:108676. PMID: 31785414.
- Berge W, Mundt K, Luu H, et al. Genital use of talc and risk of ovarian cancer: a meta-analysis. Eur J Cancer Prev. 2018 May;27(3):248–257. PMID: 28079603.
- Fedulov AV, Leme A, Yang Z, et al. Pulmonary exposure to particles during pregnancy causes increased neonatal asthma susceptibility. Am J Respir Cell Mol Biol. 2008;38(1):57–67. PMC2176127.
- Zhang Y, Mikhaylova L, Kobzik L, et al. Estrogen-mediated impairment of macrophageal uptake of environmental TiO2 particles to explain inflammatory effect of TiO2 on airways during pregnancy. J Immunotoxicol. 2015;12(1):81–91. PMID: 24825546.
- Ralph P, Prichard J, Cohn M. Reticulum cell sarcoma: an effector cell in antibody-dependent cell- mediated immunity. J Immunol. 1975;114:898–905. PMID: 1089721.
- Ralph P, Nakoinz I. Phagocytosis and cytolysis by a macrophage tumour and its cloned cell line. Nature. 1975;257:393–394. PMID: 1101071.
- Józefowski S, Arredouani M, Sulahian T, et al. Disparate regulation and function of the class A scavenger receptors SR-AI/II and MARCO. J Immunol. 2005;175(12):8032–8041. PMID: 16339540.
- Hayashi T, Yamada K, Esaki T, et al. Physiological concentrations of 17beta-estradiol inhibit the synthesis of nitric oxide synthase in macrophages via a receptor-mediated system. J Cardiovasc Pharmacol. 1998;31(2):292–298. PMID: 9475272.
- Meer A, Gnirke A, Bell GW, et al. Reduced representation bisulfite sequencing for comparative high-resolution DNA methylation analysis. Nucleic Acids Res. 2005;33(18):5868–5877. PMC1258174.
- Gu H, Smith ZD, Bock C, et al. Preparation of reduced representation bisulfite sequencing libraries for genome-scale DNA methylation profiling. Nat Protoc. 2011;6(4):468–481. PMID: 21412275.
- Fouse SD, Nagarajan RO, Costello JF. Genome-scale DNA methylation analysis. Epigenomics. 2010;2(1):105–117. PMC2907108.
- Garrett-Bakelman FE, Sheridan CK, Kacmarczyk TJ, et al. Enhanced reduced representation bisulfite sequencing for assessment of DNA methylation at base pair resolution. J Vis Exp. 2015;96:e52246. PMC4354670
- Mejías Rivera L, Fedulov AV The effect of talc on J774 cells. Gene expression omnibus (GEO) database entry. Record# GSE135238.
- Andrews S FastQC: a quality control tool for high throughput sequence data. Available from: http://www.bioinformatics.babraham.ac.uk/projects/fastqc
- Krueger F. Trim galore. Available from: http://www.bioinformatics.babraham.ac.uk/projects/trim_galore.
- Krueger F, Andrews SR. Bismark: a flexible aligner and methylation caller for Bisulfite-Seq applications. Bioinformatics. 2011;27(11):1571–1572. PMC3102221.
- Chen Y, Pal B, Visvader JE, et al. Differential methylation analysis of reduced representation bisulfite sequencing experiments using edgeR. F1000Res. 2017;6(2055):PMC5747346.
- Emi T, Mejias-Rivera L, Wallace J, et al. Epigenomic effect of talc particles on macrophages. Gene Expression Omnibus (GEO) database entry. Record# GSE150322.
- Gimenez JLG, Carbonell NE, Mateo CR, et al. Epigenetics as the driving force in long-term immunosuppression. J Clin Epigenet. 2016;2:2.
- Gordon S. Phagocytosis: an immunobiologic process. Immunity. 2016;44(3):463–475. PMID: 26982354.
- Baan R, Straif K, Grosse Y, et al.; WHO International Agency for Research on Cancer Monograph Working Group. Carcinogenicity of carbon black, titanium dioxide, and talc. Lancet Oncol. 2006 Apr;7(4):295–296. No abstract available. Erratum in: Lancet Oncol. 2006 May;7(5):365.PMID: 16598890. doi:https://doi.org/10.1016/S1470-2045(06)70651-9.
- Cramer DW, Vitonis AF, Terry KL, et al. The association between talc use and ovarian cancer: a retrospective case-control study in two US states. Epidemiology. 2016 May;27(3):334–346. PMC4820665.
- Langseth H, Hankinson SE, Siemiatycki J, et al. Perineal use of talc and risk of ovarian cancer. J Epidemiol Community Health. 2008 Apr;62(4):358–360. PMID: 18339830.
- Cramer DW, Welch WR, Berkowitz RS, et al. Presence of talc in pelvic lymph nodes of a woman with ovarian cancer and long-term genital exposure to cosmetic talc. Obstet Gynecol. 2007;110(2 Pt 2):498–501.
- Titanium dioxide in food — should you be concerned? Available from: https://www.healthline.com/nutrition/titanium-dioxide-in-food#uses
- Titanium dioxide. Available from: https://www.chemicalsafetyfacts.org/titanium-dioxide/
- Nogueira CM, de Azevedo WM, Dagli ML, et al. Titanium dioxide induced inflammation in the small intestine. World J Gastroenterol. 2012;18(34):4729–4735. PMC3442211.
- IARC monographs on the evaluation of carcinogenic risks to humans. Vol. 93. Lyon, France: Carbon Black, Titanium Dioxide, and Talc; 2010. Available from: https://www.ncbi.nlm.nih.gov/books/NBK326521/
- Titanium Dioxide (TiO2). by Eileen D. Kuempel and Avima Ruder. Citation for most recent IARC review. IARC Monograph 93 (in press). TR42-4. Available from: https://monographs.iarc.fr/wp-content/uploads/2018/06/TR42-4.pdf.
- Kim BG, Lee PH, Lee SH, et al. Effect of TiO₂ nanoparticles on inflammasome-mediated airway inflammation and responsiveness. Allergy Asthma Immunol Res. 2017;9(3):257–264. PMC5352577.
- Refaat T, West D, El Achy S, et al. Distribution of iron oxide core-titanium dioxide shell nanoparticles in VX2 tumor bearing rabbits introduced by two different delivery modalities. Nanomaterials (Basel). 2016;6(8):143. PMC5224625.
- Sandoval-Sierra JV, Salgado García FI, Brooks JH, et al. Effect of short-term prescription opioids on DNA methylation of the OPRM1 promoter. Clin Epigenetics. 2020;12(1):76. PMC7268244.
- Byun HM, Nordio F, Coull BA, et al. Temporal stability of epigenetic markers: sequence characteristics and predictors of short-term DNA methylation variations. PLoS One. 2012;7(6):e39220. PMC3379987.
- Hartley I, Elkhoury FF, Heon Shin J, et al. Long-lasting changes in DNA methylation following short-term hypoxic exposure in primary hippocampal neuronal cultures. PLoS One. 2013;8(10):e77859. PMC3808424.
- Ferrari L, Carugno M, Bollati V. Particulate matter exposure shapes DNA methylation through the lifespan. Clin Epigenetics. 2019;11(1):129. PMC6717322.
- Gregory DJ, Kobzik L, Yang Z, et al. Transgenerational transmission of asthma risk after exposure to environmental particles during pregnancy. Am J Physiol Lung Cell Mol Physiol. 2017;313(2):L395–L405. PMC5582941.
- Pacis A, Mailhot-Léonard F, Tailleux L, et al. Gene activation precedes DNA demethylation in response to infection in human dendritic cells. Proc Natl Acad Sci U S A. 2019;116(14):6938–6943. PMC6452747.