
ABSTRACT
Genomic imprinting is a rare form of gene expression in mammals in which a small number of genes are expressed in a parent-of-origin-specific manner. The aetiology of human imprinting disorders is diverse and includes chromosomal abnormalities, mutations, and epigenetic dysregulation of imprinted genes. The most common human imprinting disorder is Beckwith-Wiedemann syndrome (BWS), frequently caused by uniparental isodisomy and DNA methylation alterations. Because these lesions cannot be easily engineered, induced pluripotent stem cells (iPSC) are a compelling alternative. Here, we describe the first iPSC model derived from patients with BWS. Due to the mosaic nature of BWS patients, both BWS and non-BWS iPSC lines were derived from the same patient’s fibroblasts. Importantly, we determine that DNA methylation and gene expression patterns of the imprinted region in the iPSC lines reflect the parental cells and are stable over time. Additionally, we demonstrate that differential expression in insulin signalling, cell proliferation, and cell cycle pathways was seen in hepatocyte lineages derived from BWS lines compared to controls. Thus, this cell based-model can be used to investigate the role of imprinting in the pathogenesis of BWS in disease-relevant cell types.
Introduction
Genomic imprinting, the regulation of genes in a parent-of-origin-specific manner, plays an essential role in normal mammalian development. Imprinted genes are typically clustered and regulated by imprinting control regions (ICRs) or differentially methylated regions (DMRs), which are methylated in a parental allele-specific manner. Human disorders displaying aberrant growth, metabolic, and/or neurological phenotypes may be associated with genetic and/or epigenetic alterations at imprinted loci [Citation1]. Beckwith-Wiedemann syndrome (BWS) is the most common imprinting disorder, affecting at least 1/10,340 individuals [Citation2]. Clinical presentation involves multiple organ overgrowth including the tongue (macroglossia), the pancreas (hyperinsulinism), and the liver and kidneys. In some cases, organ overgrowth manifests as embryonal tumours, most commonly hepatoblastoma and Wilms tumour [Citation3].
BWS is due to genetic and/or epigenetic changes of two conserved clusters of imprinted genes on chromosome 11p15.5. This region contains the imprinted genes H19, a maternally-expressed long non-coding RNA, and IGF2, a paternally-expressed foetal growth factor. H19 and IGF2 are coordinately regulated by an ICR located between the two genes, designated as H19/IGF2:IG DMR or IC1 [Citation4]. IC1 is DNA methylated on the paternal allele and is unmethylated on the maternal allele, where it serves as a CTCF-dependent insulator that engages with tissue-specific enhancers. The adjacent imprinted cluster regulated by the maternally DNA methylated CDKN1C/KCNQ1 ICR (KCNQ1OT1:TSS DMR or IC2), includes the maternally expressed gene CDKN1C, a cell cycle inhibitor. Paternal uniparental isodisomy for part of chromosome 11 (pUPD11) occurs in about 20% of BWS cases, resulting in gain of methylation at IC1, loss of methylation at IC2, and subsequent dysregulation of the imprinted genes associated with BWS [Citation5]. pUPD11 occurs when, post-zygotically, part of maternal chromosome 11 is lost in a single cell and the normal chromosome complement is preserved through a rescue by the corresponding paternal region [Citation6]. This rescue event causes both chromosome 11s to have the paternal epigenotype and the clinical features of BWS.
Mouse models have provided insights into imprinting mechanisms. However, BWS modelling in mouse has limitations [Citation4]. Mice with mutations at the endogenous IC1 (designated as ICR in mouse) or IC2 (designated as KvDMR1 in mouse) did not fully exhibit the corresponding BWS phenotypes. For example, Cdkn1c mutation or loss of methylation at the maternal KvDMR1 demonstrated lethality in mice [Citation7–9], although BWS is fully viable in humans. The foetal overgrowth in the Cdkn1c mutant was reversed in late gestation [Citation8], failing to demonstrate the BWS phenotype. In mice with mutations in the H19/Igf2 ICR, there were limitations in examining the human BWS mutations partially due to the divergent ICR sequences between mouse and human [Citation10,Citation11]. Consistently, the human IC1 sequence knocked-in to the orthologous mouse locus only partially recapitulates imprinting in mouse [Citation12,Citation13]. Thus, human models are necessary to investigate the BWS mechanisms that contribute to observed overgrowth and cancer predisposition.
Common origins of BWS, such as pUPD11, cannot be easily engineered in human cell lines. In most cases of BWS, including pUPD11, the genetic or epigenetic changes arise post-zygotically resulting in cellular mosaicism [Citation6]. Thus, human cell-based models consisting of pure populations of genetically matched diseased or unaffected cells provide an excellent means to investigate epigenetic and/or transcriptional mechanisms underlying BWS. To this end, induced pluripotent stem cells (iPSCs) are a valuable technology to study human disease showing clinical features in tissues that are not readily accessible [Citation14]. Rare and common diseases are increasingly being modelled using iPSC lines, including other imprinting disorders such as Angelman syndrome and Prader-Willi syndrome [Citation15–19].
Here, we present the derivation of the first BWS iPSC lines from pUPD11 patient samples. We show that pUPD11 and non-pUPD11 iPSC lines can be derived from mosaic samples. Additionally, to evaluate the alterations in gene expression in a clinically relevant tissue type, these lines were differentiated into hepatocyte lineages.
Results
Derivation of isogenic pUPD11 and non-pUPD11 iPSCs from mosaic pUPD11 fibroblasts
Skin samples from two male patients were collected during surgical procedures and used to grow fibroblast cell lines for reprogramming. pUPD11 breakpoints as well as extent of mosaicism of pUPD11 for all patients were determined using genome-wide single-nucleotide polymorphism (SNP) microarray analysis ( and S1). To demonstrate that two populations of cells, designated isogenic pUPD11 and non-pUPD11 iPSCs, can be derived from mosaic fibroblast cell lines, we reprogrammed fibroblasts from these patients using two distinct reprogramming strategies. As a sex- and cell-type- matched control, we reprogrammed one male fibroblast cell line (IMR91). The iPSC colonies were picked, expanded for at least three passages and counted ( and S2, Table S1). All fibroblast samples and iPSC lines had a normal karyotype (data not shown). Further characterization showed that the iPSCs expressed similar levels of stemness cell surface markers (see Supplemental Methods) and all three germ layer lineage markers upon differentiation into embryoid bodies (EBs) as measured by quantitative real-time PCR (qRT-PCR) (Figures S3A and S4A-E), regardless of the reprogramming strategy or the extent of pUPD11 in the parental fibroblasts. To determine which iPSC lines had pUPD11 versus biparental chromosome 11, we used microsatellite fragment analyses or restriction fragment length polymorphisms (Figure S5). Notably, the percent of pUPD11 iPSC lines derived relative to the total number of lines was reflective of the percent pUPD11 in the initial fibroblast samples (). No pUPD11 iPSC lines could be obtained from a third patient with a low level of pUPD11 in their fibroblasts (84 clones were picked, 38 clones were established, and all clones were non-pUPD11). These results demonstrate that pUPD11 and non-pUPD11 iPSC lines can be derived from a mosaic patient fibroblast sample.
Figure 1. Summary of reprogramming in this study
pUPD11 iPSCs display the expected DNA methylation pattern at IC1 and IC2
DNA methylation status at IC1 and IC2 is the most widely used molecular marker to diagnose BWS [Citation5]. Thus, it is essential that iPSC lines designed to model BWS display the expected methylation status at both ICRs (). To determine if iPSC lines maintain the DNA methylation status of the parental fibroblasts, IC1 and IC2 methylation levels were measured. For IC1 methylation analyses, we performed pyrosequencing for patient 1. Due to the presence of SNPs in the pyrosequencing primer binding site for patient 2’s cell lines, combined bisulphite restriction analysis (COBRA) was used to evaluate methylation. IC2 methylation for all lines was analysed using COBRA. Because pUPD11 iPSC lines have two copies of paternal IC1, they exhibited ~100% methylation as expected, and non-pUPD11 iPSC lines displayed the expected ~50% methylation resulting from the unmethylated maternal and methylated paternal alleles ( and S6). To validate the COBRA results, IC1 methylation in the patient 2 fibroblasts and select non-pUPD11 and pUPD11 iPSC lines were determined using bisulphite treatment followed by direct sequencing. The sequencing results replicated the COBRA results (Figure S6). Several studies have reported stochastic aberrant DNA methylation at IC1 in mouse and human pluripotent stem cells [Citation20–23]. Yet, different parental cell sources, culture conditions, and passaging techniques used in the reprogramming experiments make it difficult to link a particular factor to the origin of such anomalies [Citation20]. To investigate whether this phenomenon also occurs in our cell lines, select patient non-pUPD11 and pUPD11 iPSC lines were cultured over prolonged periods. All iPSC lines maintained stable methylation patterns in later passages ( and data not shown), demonstrating that the reprogramming and/or culture conditions for iPSC lines did not perturb methylation. Finally, we evaluated methylation at IC2. Because the paternally inherited IC2 is normally unmethylated, all pUPD11 iPSC lines showed no detectable methylation at IC2 ( and data not shown), whereas non-pUPD11 iPSC lines showed normal methylation. Therefore, IC1 and IC2 methylation status is appropriate for the parent-of-origin and maintained after the derivation and culture of iPSC lines.
Figure 2. Methylation at BWS-related imprinting control regions in iPSC clones
Because DNA methylation exhibited the expected patterns in the non-pUPD11 and pUPD11 iPSC lines, we evaluated expression of imprinted genes in the pUPD11 region. Given the timing of H19 and Igf2 expression in development [Citation24,Citation25], expression levels were analysed in undifferentiated and differentiated iPSC lines. To examine H19 and IGF2 expression in differentiated cells, the iPSC lines were cultured as embryoid bodies (EBs) (Figure S3A). As expected, low level expression was observed in undifferentiated iPSCs (Figure S3B). The pUPD11 EBs displayed no expression of H19, whereas non-pUPD11 EBs expressed H19. Furthermore, pUPD11 EBs expressed higher levels of IGF2 compared to the non-pUPD11 EBs (Figure S3B). These results demonstrate that H19 and IGF2 gene expression appropriately reflected the non-pUPD11 versus pUPD11 status of the iPSC lines.
Differentiated iPSCs demonstrate pathway dysregulation
To elucidate the pathways involved in overgrowth and cancer formation in BWS, the iPSC lines were differentiated into hepatocyte lineages, a lineage affected by overgrowth leading to hepatomegaly and cancer in the form of hepatoblastoma in BWS. Hepatocyte lineage differentiation was performed as previously described [Citation26–30]. Only iPSC lines expressing >90% stemness markers, SSEA3/4 and Tra-1-60/81, were used for differentiation and only iPSC lines co-expressing >90% CXCR4 and c-kit definitive endoderm markers at day 7 were continued for hepatic specification and maturation (Figure S4A-E and Table S2). AFP and ATT were monitored during differentiation (Table S2). We then performed RNA sequencing (RNA-Seq) on the control, pUPD11 and non-pUPD11 hepatocytes to characterize their expression profiles. Samples were collected on days 20 (D20) and 24 (D24) post-differentiation and the latter cells were purified by fluorescence-activated cell sorting (FACS) for cell surface expression of ASGR1, a hepatocyte maturation marker for hepatocyte differentiation [Citation31] (Figures S4F-J and S7). To determine the extent of differentiation of these hepatocyte populations, expression levels for six liver gene markers (ALB, ASGR1, CPS1, HGD, HNF1A, HNF4A) [Citation32] were assessed (Figure S7). Expression levels were higher in the D24 sorted cells (Figure S7), indicating successful differentiation and purification of mature liver-like hepatocytes from the pUPD11, non-pUPD11 iPSC, and control lines.
To evaluate the maintenance of imprinting in these D24 hepatocytes, we assessed the expression of genes regulated by the two imprinted domains on chromosome 11p15.5 in the RNA-Seq data. Expression levels of IGF2 and KCNQ1OT1 were significantly increased and CDKN1C, KCNQ1, and H19 expression was significantly decreased in pUPD11 lines compared to non-pUPD11 lines and control lines, suggesting that imprinting was maintained post-reprogramming and differentiation in our model system (Figure S8).
With the integrity and maintenance of imprinting established in undifferentiated and differentiated lines, we examined the overall transcriptional profile of the D24 sorted hepatocytes. PCA plots with colouring by patient source revealed distinct clustering of the control, Patient1, and Patient2 clones (Figure S9). Statistically, DESeq2 [Citation33] revealed 362 genes were upregulated and 170 downregulated when comparing pUPD11 and non-pUPD11-derived iPSC lines to control lines (Table S3). Furthermore, 322 genes were upregulated and 153 downregulated when comparing pUPD11 clones to that of both non-pUPD11 and control lines (Table S3). Of these, 106 genes overlap between the group comparisons (), indicating not only a unique transcriptional profile of pUPD11 cells, but also a BWS-specific profile. This analysis was supported by Gene Set Enrichment Analysis (GSEA) [Citation34,Citation35]. This analysis was similarly performed to compare all BWS clones (all pUPD11 and non-pUPD11 clones derived from Patient1 and Patient2) to control clones as well as pUPD11 clones (from both patients) compared to grouped non-pUPD11 (from both patients) together with the control clones. Gene sets related to growth including PI3K/AKT/mTOR signalling, GO:0032869 response to insulin stimulus, and GO:0008283 cell proliferation were positively correlated with BWS (pUPD11 and non-pUPD11 compared to controls) transcription profile in the first analysis, as well as with pUPD11 compared to the non-UPD11 and control transcription in the second analysis (Figure S10A-B). Expression of genes within the GO:008283 notation relating to cell proliferation was statistically significant in its enrichment (Table S4). While other correlations did not rise to statistical significance (Table S4), genes from these pathways that demonstrate a stronger relationship with expression from a particular biological group are summarized in . These results indicate a transcriptional profile specific to pUPD11 cells, as well as a distinct transcriptional profile common to all cells derived from BWS patients including both the pUPD11 and the non-pUPD11 cells ().
Figure 3. RNA-Seq expression profiles in control lines, non-UPD11, and pUPD11 patient cell lines. (a) Venn diagram demonstrating the statistically significant differentially expressed genes (DGE) identified by DESeq2 when comparing all non-pUPD11 and pUPD11 patient-derived lines to control hepatocytes (blue oval) and those identified when comparing the pUPD11 iPSC lines from both patients to the non-pUPD11 lines from both patients grouped with the control lines (red oval). (b) Heatmap of transformed expression data for growth and liver cancer genes differentially expressed across groups identified through GSEA
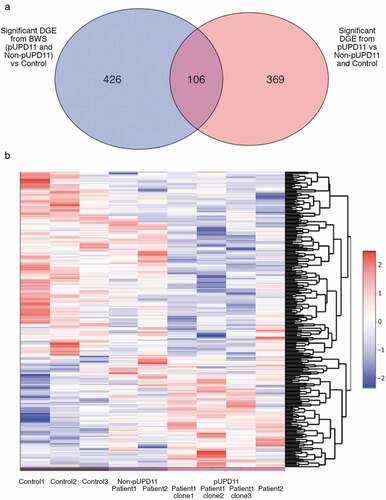
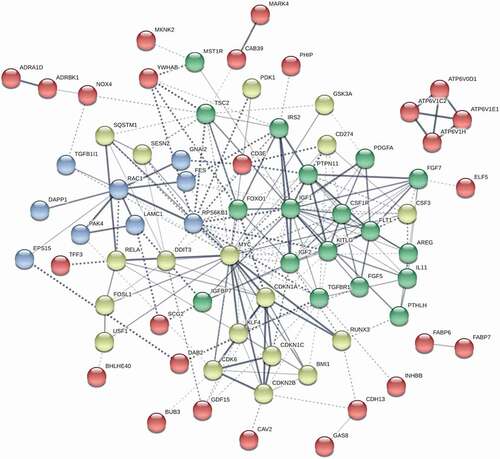
We performed a similar analysis to test for differential enrichment of liver cancer expression profiles comparing both pUPD11 and non-pUPD11 to control and pUPD11 to grouped non-pUPD11 and control clones (Table S4, Figure S10C-D). Genes demonstrating differential expression from this GSEA are included in the heatmap. We next sought to understand the relationship among these differentially expressed growth genes as a contributory factor in BWS overgrowth and cancer predisposition. To achieve this, we used STRING [Citation36] to analyse the interactions, co-expression, and co-regulation between PI3K/AKT/mTOR, insulin, and cell proliferation signalling genes that were up- or down-regulated in the pUPD11 clones compared to non-UPD11 clones and controls (). Clusters of nodes highlighted in green are largely components of insulin signalling and connect to IGF2 (). Blue and yellow cluster members function in cell proliferation, with the yellow cluster specifically regulating cell cycle progression including CDKN1C (). Genes represented by red nodes do not cluster specifically with any of the other groups and tend to have weaker connections with central factors, as represented by the lighter grey colour and dotted rather than solid line (). While IGF2 and CDKN1C are part of the pUPD11 region, many of the factors represented in this network are located on other chromosomes, such as the central genes FOXO1 on chromosome 8 and MYC on chromosome 13, demonstrating a complex, interconnected regulatory mechanism associated with BWS acting on these pathways from pUPD11 BWS cells to create the overgrowth phenotype as well as potential cancer predisposition.
Figure 4. Network of interactome among differentially expressed genes in BWS iPSC lines differentiated into hepatocyte lineages. pUPD11 lines were compared to non-UPD11 and control lines. Genes were identified by GSEA enrichment. Green clusters of nodes are largely components of insulin signalling and connect to IGF2. Cell proliferation pathways are indicated by blue and yellow clusters, with the yellow cluster specifically regulating cell cycle progression including CDKN1C. Edges between gene nodes indicate confidence in the interaction by the intensity of the line. Kmeans clustering was set to 8 and disconnected nodes were hidden
Discussion
Here, we report the establishment of a human iPSC model system for BWS. We derived both pUPD11 and non-pUPD11 iPSC lines from two BWS patient fibroblast samples that had distinct pUPD11 regions and differing levels of mosaicism for pUPD11. For each reprogramming experiment, the non-pUPD11 iPSC-derived lines serve as isogenic internal controls for the pUPD11-derived iPSC lines, having the same genetic background except for the pUPD11 regions. The use of isogenically matched iPSC lines to study human diseases is a valuable resource as it diminishes the potential genetic variability between individuals. To our knowledge, this is the first human iPSC model of BWS providing a valuable tool to study the mechanisms of IC1 and IC2 imprinting in BWS.
Importantly, we show that the proportion of the pUPD11 iPSC lines obtained relative to the total number of iPSC lines reflected the percent of pUPD11 cells in the patient samples. Thus, we demonstrated that both cell types can be derived from a mosaic patient sample. In addition, the results may suggest that during reprogramming, the pUPD11 cells may not have growth advantages, even though the paternally-expressed growth-promoting gene, IGF2, is overexpressed and the maternally-expressed growth-suppressing genes, CDKN1C and H19, are repressed in these cells. Lack of a growth advantage is likely due to relatively low expression of the genes during iPSC reprogramming, as H19 and IGF2 expression was low in the undifferentiated iPSC lines and increased in the differentiated lines.
We successfully differentiated both pUPD11 and non-pUPD11 iPSC into hepatocyte lineages, providing a new research tool for modelling BWS in cell types not easily accessible in BWS patients. Once differentiated, we assessed the transcription profile of these cells by RNA-Seq. Interestingly, statistical comparison of BWS clones or pUPD11 clones compared to the other samples produced approximately 500 and 400 differentially expressed genes, respectively, but only about 100 of these genes overlapped (, Table S3). These data, and most specifically these 100 commonly differentially expressed genes, suggest that the non-pUPD11 lines transcriptional profile may be the result of epigenetic memory from the previous influence of the adjacent pUPD11 cells in the BWS patient. This study was limited in looking at the transcriptome data from only the available lines so further investigation of the regulation of these genes may provide additional insight into the nature of epigenetic memory.
Differential enrichment of PI3K/AKT/mTOR, insulin, and cell proliferation signalling factors was identified through GSEA ( and S10, Table S4). Genes identified by liver cancer profiles were also differentially expressed in the BWS hepatocytes (, Table S4). As BWS is an overgrowth and cancer predisposition syndrome, we hypothesized that growth dysregulation underlies this cancer profile and, therefore, focused our attention on the growth genes in pUPD11 lines for network analysis (). We observed gene clusters related to IGF2 insulin signalling and CDKN1C cell cycle regulation as a result of the pUPD11 phenotype (). We also observed a number of genes up- or down-regulated that are not located within the pUPD11 region. In the middle of the STRING diagram, transcription factors FOXO1 and MYC create connectivity between the blue cell proliferation, yellow cell cycle, and green insulin signalling clusters (). Both of these genes were under-represented in our pUPD11 samples. While MYC is most often considered for its oncogenic properties, it has also been observed to increase cellular sensitivity to apoptotic signals [Citation37]. FOXO1 acts as a tumour suppressor and FOXO transcription factors have been found to negatively regulate MYC signalling [Citation38, Citation39, Citation40]. Further investigation into the regulation and function of these factors in overgrowth and tumorigenesis in BWS are certainly warranted by these findings.
In conclusion, we have demonstrated that the BWS human iPSC model system derived in the current study exhibits the anticipated epigenetic and transcriptional characteristics of pUPD11. Importantly, DNA methylation was stably maintained at the ICRs within the pUPD11 region in the iPSC lines over prolonged culture. This is critical as we demonstrated further differentiation of these cell lines into clinically relevant cell types, hepatocyte lineages to study mechanisms underlying BWS. Investigation of these differentiated cells demonstrated complex interactions among genes in insulin, cell cycle, and cell proliferation pathways suggestive of a possible mechanistic underpinning of the complex overgrowth and cancer predisposition phenotype in BWS. Thus, these cell lines serve as a model to further investigate BWS.
Experimental procedures
Patient clinical features and genetic testing
Clinical information, clinical testing results, and fibroblast samples were collected from the Children’s Hospital of Philadelphia BWS registry/repository (IRB #13-010658). Both patients presented with hyperinsulinism, macrosomia, macroglossia, omphalocele, organomegaly, and lateralized overgrowth. Genome-wide single nucleotide polymorphism (SNP) microarray analysis was carried out using the Illumina CRC BeadChip as previously described [Citation41].
iPSC generation, culture, and differentiation
Patient 1 fibroblasts were reprogrammed using the inducible stem cell cassette (STEMCCA) and reverse tetracycline-controlled transactivator (rtTA) virus [Citation42] as previously described [Citation43,Citation44]. Patient 2 fibroblasts and IMR91 fibroblasts (Coriell Institute for Medical Research Cell Repository) were reprogrammed using episomal plasmids, as previously described [Citation45,Citation46]. The iPSC lines were maintained and differentiated into hepatocyte lineages as previously described [Citation26–30] with antibodies for sorting listed in Table S5. The CHOPWT14 line derived as previously described was also used as a control line [Citation47]. For details on fibroblast collection and culture, methods of reprogramming and iPSCs culture, see Supplemental Experimental Procedures.
EB generation
The iPSC lines were differentiated to EBs as previously described and detailed in Supplemental Experimental Procedures [Citation43].
Gene expression analysis
For qRT-PCR, total expression levels of pluripotency markers, EB markers, H19, and IGF2 were measured relative to the geometric mean of expression levels of GAPDH and PPIG. For detailed RNA isolation and cDNA synthesis, see Supplemental Experimental Procedures and Table S6.
DNA genotyping and methylation analysis
gDNA isolation, genotyping, bisulphite treatment, and methylation analyses are described in detail in Supplemental Experimental Procedures and Tables S7 and S8.
Statistical analysis
Statistical significance (p-value <0.05) was determined by two-tailed Student’s t tests (GraphPadPrism).
Methods are described in Supplemental Experimental Procedures
Author contributations
S.K.H. and J.L.T. designed the study, performed and analyzed experiments, and wrote the manuscript. S.C. performed experiments and wrote the manuscript. N.S.S.N. analyzed data and wrote the manuscript. D.L.F., C.J., A.G. performed experiments and analyzed data. M.C.A. analyzed data and provided technical support. M.S.B. designed the study, analyzed experiments, and wrote the manuscript. J.M.K. designed the study, phenotyped the patients, collected patient samples, performed and analyzed experiments, and wrote the manuscript.
Supplemental Material
Download Zip (8.2 MB)Acknowledgments
We thank Dong-Hun Woo for sharing the STEMCCA and rtTA viruses. This work was supported by Alex’s Lemonade Stand Foundation (J.M.K.), the National Institutes of Health [T32 GM07229 (S.K.H.); GM051279 (M.S.B.); K08 CA193915 (J.M.K.)], St. Baldrick’s Foundation (J.M.K.), Damon Runyon Foundation (J.M.K.).
Disclosure statement
No potential conflict of interest was reported by the authors.
Supplemental material
Supplemental data for this article can be accessed here.
Additional information
Funding
Related Research Data
References
- Kalish JM, Jiang C, Bartolomei MS. Epigenetics and imprinting in human disease. Int J Dev Biol. 2014;58(2–4):291–298.
- Mussa A, Di Candia S, Russo S, et al. Recommendations of the scientific committee of the Italian Beckwith-Wiedemann syndrome association on the diagnosis, management and follow-up of the syndrome. Eur J Med Genet. 2016;59(1):52–64.
- Wang KH, Kupa J, Duffy KA, et al. Diagnosis and management of Beckwith-Wiedemann syndrome. Front Pediatr. 2019;7:562.
- Chang S, Bartolomei MS. Modeling human epigenetic disorders in mice: Beckwith-Wiedemann syndrome and Silver-Russell syndrome. Dis Model Mech. 2020;13(5). DOI:https://doi.org/10.1242/dmm.044123
- Brioude F, Kalish JM, Mussa A, et al. Expert consensus document: clinical and molecular diagnosis, screening and management of Beckwith-Wiedemann syndrome: an international consensus statement. Nat Rev Endocrinol. 2018;14(4):229–249.
- Kotzot D. Complex and segmental uniparental disomy updated. J Med Genet. 2008;45(9):545–556.
- Singh VB, Sribenja S, Wilson KE, et al. Blocked transcription through KvDMR1 results in absence of methylation and gene silencing resembling Beckwith-Wiedemann syndrome. Development. 2017;144(10):1820–1830.
- Tunster SJ, Van de Pette M, John RM. Fetal overgrowth in the Cdkn1c mouse model of Beckwith-Wiedemann syndrome. Dis Model Mech. 2011;4(6):814–821.
- Yan Y, Frisen J, Lee MH, et al. Ablation of the CDK inhibitor p57Kip2 results in increased apoptosis and delayed differentiation during mouse development. Genes Dev. 1997;11(8):973–983.
- Engel N, Thorvaldsen JL, Bartolomei MS. CTCF binding sites promote transcription initiation and prevent DNA methylation on the maternal allele at the imprinted H19/Igf2 locus. Hum Mol Genet. 2006;15(19):2945–2954.
- Ideraabdullah FY, Thorvaldsen JL, Myers JA, et al. Tissue-specific insulator function at H19/Igf2 revealed by deletions at the imprinting control region. Hum Mol Genet. 2014;23(23):6246–6259.
- Freschi A, Hur SK, Valente FM, et al. Tissue-specific and mosaic imprinting defects underlie opposite congenital growth disorders in mice. PLoS Genet. 2018;14(2):e1007243.
- Hur SK, Freschi A, Ideraabdullah F, et al. Humanized H19/Igf2 locus reveals diverged imprinting mechanism between mouse and human and reflects Silver-Russell syndrome phenotypes. Proc Natl Acad Sci U S A. 2016;113(39):10938–10943.
- Unternaehrer JJ, Daley GQ. Induced pluripotent stem cells for modelling human diseases. Philos Trans R Soc Lond B Biol Sci. 2011;366(1575):2274–2285.
- Chamberlain SJ, Chen PF, Ng KY, et al. Induced pluripotent stem cell models of the genomic imprinting disorders Angelman and Prader-Willi syndromes. Proc Natl Acad Sci U S A. 2010;107(41):17668–17673.
- Cruvinel E, Budinetz T, Germain N, et al. Reactivation of maternal SNORD116 cluster via SETDB1 knockdown in Prader-Willi syndrome iPSCs. Hum Mol Genet. 2014;23(17):4674–4685.
- Fink JJ, Robinson TM, Germain ND, et al. Disrupted neuronal maturation in Angelman syndrome-derived induced pluripotent stem cells. Nat Commun. 2017;8:15038.
- Kim BY, Lee JS, Kim YO, et al. Generation of patient-specific induced pluripotent stem cells (KSCBi007-A) derived from a patient with Prader-Willi syndrome retain maternal uniparental disomy (UPD). Stem Cell Res. 2019;41:101647.
- Stelzer Y, Sagi I, Yanuka O, et al. The noncoding RNA IPW regulates the imprinted DLK1-DIO3 locus in an induced pluripotent stem cell model of Prader-Willi syndrome. Nat Genet. 2014;46(6):551–557.
- Nazor KL, Altun G, Lynch C, et al. Recurrent variations in DNA methylation in human pluripotent stem cells and their differentiated derivatives. Cell Stem Cell. 2012;10(5):620–634.
- Nishino K, Toyoda M, Yamazaki-Inoue M, et al. DNA methylation dynamics in human induced pluripotent stem cells over time. PLoS Genet. 2011;7(5):e1002085.
- Sun B, Ito M, Mendjan S, et al. Status of genomic imprinting in epigenetically distinct pluripotent stem cells. Stem Cells. 2012;30(2):161–168.
- Takikawa S, Ray C, Wang X, et al. Genomic imprinting is variably lost during reprogramming of mouse iPS cells. Stem Cell Res. 2013;11(2):861–873.
- Lee JE, Pintar J, Efstratiadis A. Pattern of the insulin-like growth factor II gene expression during early mouse embryogenesis. Development. 1990;110(1):151–159. Retrieved from: https://www.ncbi.nlm.nih.gov/pubmed/1964408
- Poirier F, Chan CT, Timmons PM, et al. The murine H19 gene is activated during embryonic stem cell differentiation in vitro and at the time of implantation in the developing embryo. Development. 1991;113(4):1105–1114.
- Gadue P, Huber TL, Paddison PJ, et al. Wnt and TGF-beta signaling are required for the induction of an in vitro model of primitive streak formation using embryonic stem cells. Proc Natl Acad Sci U S A. 2006;103(45):16806–16811.
- Holtzinger A, Streeter PR, Sarangi F, et al. New markers for tracking endoderm induction and hepatocyte differentiation from human pluripotent stem cells. Development. 2015;142(24):4253–4265.
- Mills JA, Paluru P, Weiss MJ, et al. Hematopoietic differentiation of pluripotent stem cells in culture. Methods Mol Biol. 2014;1185:181–194.
- Ogawa M, Ogawa S, Bear CE, et al. Directed differentiation of cholangiocytes from human pluripotent stem cells. Nat Biotechnol. 2015;33(8):853–861.
- Ogawa S, Surapisitchat J, Virtanen C, et al. Three-dimensional culture and cAMP signaling promote the maturation of human pluripotent stem cell-derived hepatocytes. Development. 2013;140(15):3285–3296.
- Peters DT, Henderson CA, Warren CR, et al. Asialoglycoprotein receptor 1 is a specific cell-surface marker for isolating hepatocytes derived from human pluripotent stem cells. Development. 2016;143(9):1475–1481.
- Pashos EE, Park Y, Wang X, et al. Large, diverse population Cohorts of hiPSCs and derived hepatocyte-like cells reveal functional genetic variation at blood lipid-associated loci. Cell Stem Cell. 2017;20(4):558–570 e510.
- Love MI, Huber W, Anders S. Moderated estimation of fold change and dispersion for RNA-seq data with DESeq2. Genome Biol. 2014;15(12):550.
- Mootha VK, Lindgren CM, Eriksson KF, et al. PGC-1alpha-responsive genes involved in oxidative phosphorylation are coordinately downregulated in human diabetes. Nat Genet. 2003;34(3):267–273.
- Subramanian A, Tamayo P, Mootha VK, et al. Gene set enrichment analysis: a knowledge-based approach for interpreting genome-wide expression profiles. Proc Natl Acad Sci U S A. 2005;102(43):15545–15550.
- Szklarczyk D, Gable AL, Lyon D, et al. STRING v11: protein-protein association networks with increased coverage, supporting functional discovery in genome-wide experimental datasets. Nucleic Acids Res. 2019;47(D1):D607–D613.
- Prendergast GC. Mechanisms of apoptosis by c-Myc. Oncogene. 1999;18(19):2967–2987.
- Bouchard C, Lee S, Paulus-Hock V, et al. FoxO transcription factors suppress Myc-driven lymphomagenesis via direct activation of Arf. Genes Dev. 2007;21(21):2775–2787.
- Peck B, Ferber EC, Schulze A. Antagonism between FOXO and MYC regulates cellular powerhouse. Front Oncol. 2013;3:96.
- Wang Y, Zhou Y, Graves DT. FOXO transcription factors: their clinical significance and regulation. Biomed Res Int. 2014;(2014:925350.
- Conlin LK, Thiel BD, Bonnemann CG, et al. Mechanisms of mosaicism, chimerism and uniparental disomy identified by single nucleotide polymorphism array analysis. Hum Mol Genet. 2010;19(7):1263–1275.
- Sommer CA, Stadtfeld M, Murphy GJ, et al. Induced pluripotent stem cell generation using a single lentiviral stem cell cassette. Stem Cells. 2009;27(3):543–549.
- Anguera MC, Sadreyev R, Zhang Z, et al. Molecular signatures of human induced pluripotent stem cells highlight sex differences and cancer genes. Cell Stem Cell. 2012;11(1):75–90.
- Woo DH, Chen Q, Yang TL, et al. Enhancing a Wnt-telomere feedback loop restores intestinal stem cell function in a human organotypic model of dyskeratosis congenita. Cell Stem Cell. 2016;19(3):397–405.
- Bershteyn M, Hayashi Y, Desachy G, et al. Cell-autonomous correction of ring chromosomes in human induced pluripotent stem cells. Nature. 2014;507(7490):99–103.
- Okita K, Matsumura Y, Sato Y, et al. A more efficient method to generate integration-free human iPS cells. Nat Methods. 2011;8(5):409–412.
- Thom CS, Jobaliya CD, Lorenz K, et al. Tropomyosin 1 genetically constrains in vitro hematopoiesis. BMC Biol. 2020;18(1):52.