
 ?Mathematical formulae have been encoded as MathML and are displayed in this HTML version using MathJax in order to improve their display. Uncheck the box to turn MathJax off. This feature requires Javascript. Click on a formula to zoom.
ABSTRACT
Exposure to stress or glucocorticoids (GCs) is associated with epigenetic and transcriptional changes in genes that either mediate or are targets of GC signalling. FKBP5 (FK506 binding protein 5) is one such gene that also plays a central role in negative feedback regulation of GC signalling and several stress-related psychiatric disorders. In this study, we sought to examine how the mouse Fkbp5 gene is regulated in a neuronal context and identify requisite factors that can mediate the epigenetic sequelae of excess GC exposure. Mice treated with GCs were used to establish the widespread changes in DNA methylation (DNAm) and expression of Fkbp5 across four brain regions. Then two cell lines were used to test the persistence, decay, and functional significance of GC-induced methylation changes near two GC response elements (GREs) in the fifth intron of Fkbp5. We also tested the involvement of DNMT1, cell proliferation, and MeCP2 in mediating the effect of GCs on DNAm and gene activation. DNAm changes at some CpGs persist while others decay, and reduced methylation states are associated with a more robust transcriptional response. Importantly, the ability to undergo GC-induced DNAm loss is tied to DNMT1 function during cell division. Further, GC-induced DNAm loss is associated with reduced binding of MeCP2 at intron 5 and a physical interaction between the fifth intron and promoter of Fkbp5. Our results highlight several key factors at the Fkbp5 locus that may have important implications for GC- or stress-exposure during early stages of neurodevelopment.
Introduction
DNA methylation (DNAm) regulates gene transcription and is altered by environmental stressors. DNAm has been posited as one of the epigenetic mechanisms by which excess stress exposure, especially during neurodevelopment, leads to increased susceptibility to the development of psychiatric disorders. Numerous studies suggest that an altered stress-response confers vulnerability to psychiatric disorders [Citation1–5]. Exposure to stress causes epigenetic changes of genes involved in the stress response. Specifically, exposure to chronic stress or glucocorticoids (GCs) leads to DNAm changes of CpG dinucleotides that have been associated with changes in the expression levels of GC target genes.
Many of these ‘HPA axis’ target genes are involved in the regulation of homoeostatic glucocorticoid levels and intracellular glucocorticoid signalling. Genes such as Crf (corticotropin releasing factor), Fkbp5 (FK506 binding protein 5), Gr (glucocorticoid receptor), and Pomc (proopiomelanocortin) help to regulate glucocorticoid levels in the organism. For instance, exposure to social defeat stress leads to decreased methylation of the Crf promoter [Citation6], and this epigenetic change is associated with the dysregulation of HPA axis function and behavioural deficits. Another group of ‘HPA axis’ target genes play a critical role in the function of the brain, as they are involved in neurodevelopment, neuroprotection, and neurotransmission [Citation7]. The latter group of genes is of particular interest in relation to psychiatric disorders because they provide a direct link between excess stress or GC exposure and behaviour. In that regard, a study has demonstrated that social isolation stress leads to increased DNA methylation at the promoter region of the dopamine synthesis gene tyrosine hydroxylase (Th) and deficits in behaviours related to dopamine deficiency [Citation8].
Despite studies that have demonstrated regulation of such genes by stress and glucocorticoids, the mechanisms by and the molecular context in which epigenetic alterations exert their influence on gene function are largely undetermined. For instance, it is not clear whether changes in DNA methylation are generally stable, although several studies have documented their persistence [Citation8–10]. Further, it is not clear whether enzymes that regulate DNA methylation such as DNA methyltransferases (DNMT) and demethylases (TETs) play a role in the presence of GCs or stress. Studies of stress and GC exposure have demonstrated changes in the level of DNA methyltransferases that can either direct DNA methylation as part of cellular maintenance or de novo [Citation11]. Recent evidence has shown that glucocorticoid response elements (GREs) that bind to the glucocorticoid receptor either activate or silence transcription via physical interactions with the promoter, as demonstrated by the chromatin conformation capture technique (3 C) [Citation1,Citation12]. These studies imply that the GC-induced changes in methylation likely alter binding of methylation-sensitive or methylation-dependent transcription and enhancer factors that mediate the effect of CpG methylation on gene function.
In the present study, we investigated the regulation of Fkbp5, which plays an important role in mediating the stress response and has been implicated in psychiatric disorders such as anxiety, depression, and bipolar disorder [Citation13–15]. Previously, we have shown that upon exposure to glucocorticoids, Fkbp5 loses DNAm in a dose-dependent manner and increases in expression [Citation9,Citation11,Citation16]. Others have shown that the intronic GREs interact physically with the promoter in allele- and methylation-specific way [Citation1]. We now use GC-regulation of Fkbp5 as a model to better understand how GCs epigenetically control its transcription.
Materials and methods
Animals
At five weeks of age, male C57BL/6 J mice (N = 12 per group; Jackson Laboratories, Bar Harbour, ME) were given ad libitum access to solutions containing the rodent GC corticosterone (Sigma-Aldrich, St. Louis, MO; 100 μg/ml with 1% ethanol; ‘CORT’ group) or 1% ethanol (‘VEHICLE’ group) in place of their regular drinking water for four weeks. The method of administering CORT through the drinking water supply has been established by several studies that have sought to examine the role of corticosterone in mediating a stress response in rodents [Citation17–20]. The mean plasma CORT levels over the four weeks of treatment were 309.7 ± 27.0 ng/mL for the treated animals (CORT, N = 12) versus 28.2 ± 3.2 ng/mL for the vehicle-treated animals (VEHICLE, N = 12; p = 2.1 × 10⁻⁷). At the end of the treatment period, animals were euthanized, and their brains were frozen on powdered dry ice and stored at −80°C. All animal experimental procedures were approved by the Institutional Animal Care and Use Committee at the Johns Hopkins University School of Medicine and were performed in accordance with the guidelines established in the National Research Council’s Guide for the Care and Use of Laboratory Animals.
Cell lines and treatment
HT-22 and AtT-20 cell lines derived from the mouse hippocampus and the pituitary, respectively, were cultured using DMEM (Thermo Fisher Scientific, Waltham, MA) supplemented with 10% foetal bovine serum (Sigma-Aldrich, St.Louis, MO) under standard conditions (5% CO2, 37 °C). Previous studies have demonstrated that AtT-20 cells underwent similar epigenetic and transcriptional changes at the Fkbp5 locus [Citation11], and they were used in experiments where ease of transfection with Lipofectamine and a slower growth rate in tissue culture than the HT-22 cells were necessary. Cells were trypsinized and replated in 6-well plates before treatment with 1 μM Dexamethasone (DEX, Sigma), CORT, or VEHICLE solution. Cells were treated for various durations as indicated in the Results section. HT-22 cells were split every 2 days and the AtT-20 cells every 4 days to maintain them in the growth phase. After each time point, cells were harvested for genomic DNA (gDNA) and messenger RNA (mRNA). For the growth arrest experiments, three replicates per treatment of HT-22 cells in 10 cm plates were treated with DMEM with or without 10 μg/mL mitomycin C (MMC, Sigma-Aldrich) for 3 hours, after which the cells were washed with PBS 3 times and media was changed to DMEM with 1 μM CORT or VEHICLE solution. Here, murine stress hormone corticosterone was used instead of the more potent DEX, because DEX-MMC combination resulted in some cell death. Cells were cultured for 7 days and subsequently harvested for gDNA. Alternatively, AtT-20 cells were cultured in 2x 96-well plates for 7 days in the presence of different concentrations of nocodazole (0–500 nM, Sigma-Aldrich) with and without 1 μM CORT. After 7 days, one replicate plate was used to measure cell proliferation using the Vybrant MTT Cell Proliferation Assay Kit (Thermo Fisher Scientific) in a SpectraMax M2 spectrophotometer (Molecular Devices, Sunnyvale, CA). The other plate was used for gDNA extraction and bisulphite pyrosequencing for DNAm analysis. For the treatment of cells with 5-aza-2’-deoxycytidine (5-Aza-CdR or AZA), HT-22 cells were treated with several doses (0–0.25 μM) of AZA in the presence of 1 μM DEX or VEHICLE solution. Cells were cultured for 7 days, after which they were processed for gDNA extraction and bisulphite pyrosequencing. Finally, to test the effect of previous DEX treatment on Fkbp5 induction following re-exposure, HT-22 cells were treated for 7 days with 1 μM DEX, cultured for an additional 7 days in the absence of DEX, and re-stimulated with 1 μM DEX for 4 hours before cell harvest. Four hours was chosen because it was determined to be the shortest amount of time needed to elicit a robust expression of Fkbp5.
Tissue dissection
Whole mouse brains were mounted on a cryostat microtome (Leica Biosystems, Buffalo Grove, IL). Needles (19 gauge; 0.686 mm inner diameter and 1.086 mm outer diameter) were used to punch-dissect four brain regions using the following coordinates relative to bregma (mm): hippocampus (AP −2.00; ML ±1.3; DV −2.2); medial prefrontal cortex (AP 1.94; ML ±0.73; DV −3.3); amygdala (AP 1.4; ML ±3.1; DV 3.9); and hypothalamus (AP −1.46; ML ±0.25; DV −5.5). Tissue punches were immediately frozen on dry ice, stored at −80 °C, and processed at a later time for mRNA and gDNA.
Gene expression
mRNA from the brain regions and cell lines was obtained using the RNeasy Mini Kit (Qiagen, Germantown, MD), according to the manufacturer’s instructions. A small aliquot of the extracted mRNA was run on a 2200 TapeStation bioanalyzer (Agilent Technologies, Santa Clara, CA) to quantify the amount and fidelity of the mRNA samples. All of the mRNA samples with RIN (RNA Integrity Number) of greater than 8.0 were used. QuantiTect Reverse Transcription Kit (Qiagen) was used to generate cDNAs for subsequent quantitative real-time PCR (qPCR). Negative reverse transcriptase samples were used concurrently to ensure the absence of contaminating genomic DNA. All reactions were carried out in triplicate using 1× Taqman master mix (Thermo Fisher Scientific), 1× Taqman probes for each gene [Fkbp5, Mecp2, and Actb (β-actin)], and 30 ng of cDNA template in a total volume of 20 μl. Real-time reactions were performed on an Applied Biosystems 7900HT fast real-time PCR system under standard PCR conditions (50°C for 2 min; 95°C for 10 min; and 60°C for 1 min for 40 cycles). All samples were run on a single 384-well plate, and each sample was separated from others with the same treatment, Taqman probe, and time points by at least two rows. Each set of triplicates was checked to ensure that the threshold cycle (Ct) values were all within 1 Ct of each other. For the determination of relative expression values, the −ΔΔCt method [Citation21] was used, where triplicate Ct values for each mouse sample were averaged and subtracted from those derived from the housekeeping gene Actb. The Ct difference for a calibrator sample was subtracted from those of the test samples, and the resulting −ΔΔCt values were raised to a power of 2 to determine normalized relative expression.
DNA extraction and bisulphite treatment
gDNA from the brain and cell lines was isolated using the MasterPure DNA Purification Kit (Epicentre, Madison, WI), according to the manufacturer’s instructions. A Qubit 2.0 Fluorometer and a dsDNA BR Assay Kit (Thermo Fisher Scientific) were used to quantify the gDNA. Bisulphite conversion of 250 ng of each gDNA sample was achieved with the EZ DNA Methylation-Gold Kit (Zymo Research), according to the manufacturer’s instructions.
Bisulphite PCR and pyrosequencing
DNA methylation (DNAm) status was determined by bisulphite pyrosequencing, which measures methylation variation at > 90% precision [Citation22]. Primers were designed against introns 1 and 5 in the mouse Fkbp5 gene and have been published elsewhere [Citation9]. Thermocycling was carried out using a Veriti 96-Well Thermal Cycler (Thermo Fisher Scientific). Twenty-five nanograms of bisulphite-treated DNA were used for each PCR. An additional nested PCR was performed with 2 μl of the previous PCR and one biotinylated primer (other primer being unmodified). Amplification for both PCR steps consisted of 40 cycles (95 °C for 1 min, 60 °C for 30 sec, 72 °C for 1 min). PCR products were verified by agarose electrophoresis. Pyro Gold reagents (Qiagen) were used to process the samples for pyrosequencing according to the manufacturer’s instructions. For each sample, the biotinylated PCR product was mixed with streptavidin-coated Sepharose beads (GE Healthcare, Indianapolis, IN), Binding Buffer, and Milli-Q water and shaken at room temperature. The vacuum prep tool (Qiagen) was used to isolate the Sepharose bead-bound, single-stranded PCR products. The attached PCR products were released into a PSQ HS 96-plate containing a sequencing primer diluted with the Annealing Buffer. Pyrosequencing reactions were performed in a PyroMark PSQ HS 96MD system, and CpG methylation quantification was performed with the Pyro Q-CpGt 1.0.9 software (Qiagen). An internal quality-control step (dispensation of C’s to detect unconverted cytosines) was used to disqualify any assays that contained unconverted DNA. At the beginning of the study, SssI- and mock-methylated Fkbp5 intronic DNA fragments were mixed in predetermined ratios of methylated:nonmethylated DNA in 10% increments, bisulphite-converted, and tested by pyrosequencing to confirm the sensitivity of the machine and the absence of amplification bias. The percentage of methylation at each CpG, as determined by pyrosequencing, was compared between DNA from CORT (or DEX) and VEHICLE-treated samples. All primers used are provided in the in the Supplementary Materials section.
Luciferase reporter assay
To assess the functional role of DNA methylation on gene expression, we PCR-amplified a 292-bp genomic fragment harbouring the Fkbp5 intron 5 GRE, including the four CpGs, and subcloned the amplicon into the BamHI multiple cloning site (MCS) on the pCpGL vector. A DNA fragment containing three tandem copies of the consensus glucocorticoid response element (GRE) flanked by a CpG and BamHI site at each end was synthesized (GeneArt, Thermo Fisher) and subcloned in a similar manner. The MCS is located upstream of a minimal EF1-α promoter and a luciferase reporter cassette, and the vector in its entirety lacks CpG dinucleotides except for those cloned into the MCS [Citation23]. Sanger sequencing was performed for each vector to confirm successful subcloning. Each vector was divided into two fractions, and one fraction was methylated in vitro using SssI methylase. Bisulphite pyrosequencing was performed to verify > 90% methylation of all SssI-treated CpGs. The methylated or unmethylated plasmids, along with a CMV-β-gal plasmid to control for transfection efficiency, were transfected into the AtT-20 cell line and treated after 2 days with either vehicle or DEX for 24 hrs. Luciferase measurements were made using the GloMax 20/20 luminometer (Promega, Madison, WI), and luminometric data were normalized by colorimetric values obtained from the β-gal assay with the SpectraMax M2 spectrophotometer (Molecular Devices).
Chromatin immunoprecipitation (ChIP)
ChIP assay was performed to assess the presence of GR and MeCP2 at Fkbp5 intron 5. A detailed ChIP protocol has already been published elsewhere [Citation24]. Briefly, ten million HT-22 cells treated with either DEX or VEHICLE-solution for 5 days were fixed using 1% formaldehyde, chemically lysed in 1% Triton X-100, and physically lysed using a Dounce homogenizer to isolate the nuclei. Nuclei were subjected to centrifugation in a 30% sucrose gradient and ruptured with 1% SDS lysis buffer to release the chromatin. The chromatin was sonicated to yield ~ 250 bp DNA using a Covaris sonicator (Covaris, Inc., Woburn, MA). 25 μg of chromatin was incubated with 10 μg of rabbit polyclonal antibodies against MeCP2 or GR (MilliporeSigma, Burlington, MA) and incubated for 2 hrs. Additional chromatin samples were incubated with 10 μg of rabbit pre-immunization serum or no antibodies (input) to serve as negative and positive loading controls, respectively. Protein G DynaBeads (Invitrogen, Carlsbad, CA) were used to precipitate and wash the antibody-chromatin complex. Chromatin complexes then underwent reverse crosslinking (300 mM NaCl at 65 °C, 3 hrs), proteins were digested by proteinase K, and eluates were subjected to phenol–chloroform extraction and EtOH precipitation of DNA. DNA was quantified by Nanodrop (Thermo Fisher Scientific) and subsequently used for qPCR.
CRISPR and shRNA-mediated silencing of Mecp2
Two independent methods were employed to alter Mecp2 gene activity. First, we used five different lentiviral plasmids carrying a CMV promoter-driven Cas9-Gfp fusion gene downstream of four single-guide RNA (sgRNA) against the third exon of Mecp2 or a negative control sgRNA consisting of scrambled sequence (Sigma-Aldrich). Each Cas9-Gfp/sgRNA plasmid was first co-transfected into a 293 FT cell line with pMD2.G and psPAX.2 packaging plasmids in a 3:1:2 ratio. Two days post-transfection, the supernatant containing the lentiviruses was centrifuged at 800 x g and 4 °C for 15 min followed by filtration through a 0.22 μm filter to remove cellular debris. The supernatant was then mixed with new DMEM and added to HT-22 cells grown on 6-well plates (N = 6 per sgRNA). Two days following transduction, for each Mecp2 sgRNA, 3 of the wells were treated DEX and the other 3 with VEHICLE solution for 4 hrs. Cells were then trypsinized and subjected to fluorescence-activated cell sorting (FACS) to isolate GFP+ cells. GFP- cells were used as negative controls. mRNA extracted from the GFP± cells were used for RT-qPCR. Proteins extracted from the GFP+, GFP-, and unsorted cells were run on SDS-PAGE, and Western blotting was performed using antibodies against MeCP2 (ab253197) and β-actin (ab6276) (Abcam, Cambridge, MA) (Supplementary Figure 1). Expression levels of Fkbp5 and housekeeping gene Actb (β-actin, for normalization) were assessed by RT-qPCR. Second, we used 4 lentiviral plasmids, each carrying shRNAs against Mecp2 or scrambled shRNA (PLKO.1, JHU ChemCore). Similar transduction approach as used as above. Gene silencing was assessed by RT-qPCR of Mecp2 normalized by Actb.
Chromosome conformation capture (3 C)
To determine whether the Fkbp5 intron 5 region can affect transcriptional activity through physical interactions with its promoter, 3 C was performed. Briefly, DEX- or VEHICLE-treated cells (5 days) were fixed using 1% formaldehyde, lysed with 0.3% SDS and 2% Triton X-100, and digested with either PstI restriction enzyme that cuts once in the promoter and intron 5 or with EcoRI that does not cut within 2kb of the promoter or intron 5. Following heat inactivation of the enzyme, digested DNA-protein complexes were re-ligated overnight at 16°C. Formaldehyde crosslinking was reversed, and DNA was extracted. Primers flanking the restriction site, one from the promoter and the other from intron 5, were used in a PCR reaction to detect the presence of the concatenated promoter-intron DNA.
Statistics and data analysis
Initial tests of glucocorticoid-induced (GC) loss of DNA methylation
For , Student’s t-tests were generated for initial differences in relative expression comparing treatment vs. control groups within each of the four tissue regions (amygdala, hippocampus, hypothalamus, and prefrontal cortex). Among Fkbp5 intron 5 CpGs, ANOVA was run to generate F-statistics to assess differences in the mean DNA methylation across the CpG sites for each tissue sample type. This ANOVA was performed for the Fkbp5 intron 5 ()) and the Fkbp5 intron 1 CpG sites ()). Given that neighbouring, consecutive CpG methylation is correlated within an intron, these do not represent independent tests that would each inflate the family-wise error rate. Instead, we corrected for multiple testing across the two introns of interest (m) using a Sidak correction equivalent to 1-(1-α)1/m, where the intended α level is 0.05., where the intended
This resulted in an α threshold of 0.025.
Figure 1. Glucocorticoid exposure leads to gene expression and DNA methylation changes in the Fkbp5 locus in multiple brain regions. (a). Four-week corticosterone (CORT) treatment leads to an increase in Fkbp5 expression in all four brain regions examined: amygdala (AMYG), hippocampus (HIPPO), hypothalamus (HYPO), and prefrontal cortex (PFC). (b). Spatial organization of four CpG dinucleotides assayed by bisulphite PCR and pyrosequencing for DNA methylation. CpGs are located within the fifth intron of the Fkbp5 gene and are adjacent to two tandem GREs. (c). CORT-induced loss of methylation at the four intronic CpGs in four brain regions examined. (d). Absence of methylation changes at three CpGs located in the first intron of Fkbp5. N = 4 per group. Bar graphs are represented as mean ± SEM, and statistical significance was determined by Student’s t-tests: *p < 0.05, **p < 0.01, and ***p < 0.001
Longitudinal assessment of DNA methylation following DEX treatment
For , We initially conducted a Student’s t-test between treated and untreated samples and compared DNA methylation percentage at each CpG site at each timepoint to test for crude differences between treatment groups. We then modelled longitudinal effects of treatment on the percentage of DNA methylation at each CpG using a piecewise mixed effects model [Citation25]. For all samples, we generated scatterplots of DNA methylation percentage at each CpG over time. We used these scatterplots to inform our decision to allow for random effects in both the slope and intercept between samples. Time was modelled as the number of follow-up observations for interpretability of the estimates. For intron 5, we included a turning point at Day 0 for the piecewise equations. This allowed for one slope from Day −10 to Day 0 during which treatment samples received synthetic GC dexamethasone (DEX) for 10 days, and another slope for Day 0 to Day 32 following DEX treatment. A similar piecewise mixed effects model was fit for the expression of Fkbp5, with a piecewise turning point at Day 0. We used a 3 degree of freedom likelihood ratio test to test the main effect of treatment and the interaction effects with time before and after the piecewise turning point against the model with no treatment effects.
Figure 2. Partial reversal and persistence of GC-induced loss of DNA methylation in a cell line. (a). Two of the four CpGs (CpG-1 and CpG-2) in the Fkbp5 intron 5 undergo a gradual but partial reversal of dexamethasone (DEX)-induced loss of DNA methylation during the 32-day recovery period in the absence of DEX. (b). Two CpGs (CpG-3 and CpG-4) do not undergo any appreciable reversal of DEX-induced methylation loss. (c). Three CpGs in intron 1 of Fkbp5 do not undergo any changes in DNA methylation during the 10-day treatment with DEX. The Y-axis range is shown with a smaller scale than for the intron 5 CpGs to emphasize the methylation levels across the recovery period. (d). Assessment of Fkbp5 gene expression across the DEX treatment and recovery periods shows the transient nature of DEX-induced transcription. N = 3 per treatment group per day. Line graphs are represented as mean ± SEM, and methylation levels at all time points for (a) and (b) were significantly different between the DEX-treated samples and their corresponding VEHICLE-treated samples as determined by Student’s t-tests: (p < 0.001). For the expression study, Students’ t-tests were also performed: **p < 0.01
Tests of relative reporter gene expression due to DNA methylation and DEX treatment
For , we tested the overall effect of DEX compared to VEHICLE on the relative expression of Fkbp5 among both methylated and previously demethylated samples using Student’s t-test. The Relative Luminescence Units (RLUs) was measured from Fkbp5 intron 5 and consensus GREs treated with VEHICLE or DEX. We also tested within-gene and within-methylated group differences using Student’s t-test comparing treatments among methylated Fkbp5, demethylated Fkbp5, methylated GRE, and demethylated GRE.
Figure 3. DNA methylation status of intron 5 and a consensus GRE is associated with gene expression. (a). AtT-20 cells were first treated with DEX (Demethylated) or vehicle (Methylated) solution for 7 days and cultured for an additional 7 days without DEX. On the eighth day, cells were stimulated with either 1 μM DEX or VEHICLE solution for 4 hours to measure Fkbp5 expression. (b). Schematic drawing of three tandem GR binding sites that were subcloned upstream of a luciferase reporter cDNA. Other than the two CpGs that flank the GREs (or the four CpGs associated with the Fkbp5 intron 5 DNA fragment in )), the vector does not contain any CpGs. (c). Unmethylated or SssI-methylated fragments were transfected into the cell line, and luciferase assay was performed 2 days post-transfection following 24 hrs. of exposure to DEX or VEHICLE solution. Fkbp5 ± Meth denotes the unmethylated or methylated Fkbp5 intron 5, and GRE ± Meth denotes unmethylated or methylated consensus GREs. N = 3 per treatment group. Bar graphs are represented as mean ± SEM, and statistical significance was determined by Student’s t-tests: *p < 0.05, **p < 0.01, and ***p < 0.001
Role of DNMT1 on GC-induced loss of DNA methylation
For , we used a Student’s t-test to examine differences between the percentage of DNA methylation among VEH- and DEX-treated samples based on the amount of AZA treatment received (0, 0.05, 0.10, 0.25 μM). We also used a linear regression model to test the effects of increased AZA treatment and potential interaction with DEX treatment. AZA treatment was modelled as an ordinal variable (compared to 0 μM AZA treatment). This was done for intron 1 and intron 5 CpG sites.
Figure 4. Effect of 5-aza-2ʹ-deoxycytidine (AZA) on GC-induced loss of DNA methylation. (a). DNA methylation levels of DEX- or VEHICLE-treated HT-22 cells were examined under different concentrations of AZA. CpG-4 from intron 5 is shown, but all CpGs underwent GC- and AZA-induced loss of DNA methylation. (b). In contrast, as expected, three CpGs at intron 1 underwent AZA-induced loss of DNA methylation only. N = 4 per treatment group. Bar graphs are represented as mean ± SEM, and statistical significance was determined by Student’s t-tests: *p < 0.05, **p < 0.01, and ***p < 0.001
Testing methylation and cell proliferation differences due to anti-mitotic drug exposure
For , we used ANOVA to compare differences within CpG sites for Fkbp5 loci treated with VEH, CORT, MMC (mitomycin C)+VEH, and MMC+CORT. We also used linear regression with VEH-containing media as the reference category to estimate the effects of each treatment. In the NCO (nocodazole) study, we used a change point regression analysis to assess whether there was a threshold effect of NCO concentration [Citation26]. This was done for the optical density units at 540 nm for cell proliferation and for the DNA methylation percentage at the 4Fkbp5 CpG sites. The threshold cut points were then compared between the proliferation and methylation models. We also used Student’s t-tests comparing CORT-treated and VEHICLE-treated samples at a given NCO concentration to understand within-concentration differences.
Figure 5. GC-induced loss of methylation depends on cell replication. (a). HT-22 cells were treated with 10 μg/mL mitomycin C (MMC) for three hours, washed several times, and cultured for 7 days in the presence of 1 μM CORT or VEHICLE solution. MMC blocked CORT-induced loss of DNA methylation at all intron 5 CpGs. N = 3 per group. (b). To replicate the results in HT-22 cells, MTT assay was performed on AtT-20 cells treated with different concentrations of nocodazole (NCO) and 1 μM CORT or VEHICLE solution to find an NCO concentration capable of inhibiting cell proliferation. N = 7 per treatment group. (c). Methylation levels at Fkbp5 intron 5 show a failure to undergo CORT-induced loss of DNA methylation at 50 nM NCO, where a substantial reduction in cell proliferation was observed. N = 7 per treatment group. Bar graphs are represented as mean ± SEM. P-value asterisks determined by Student’s t-tests are for VEH vs. CORT and MMC+VEH vs. MMC+CORT. *p < 0.05, **p < 0.01, and ***p < 0.001
Initial tests and regression modelling of MeCP2 effects in GC-induced Fkbp5 expression
For , we conducted an ANOVA test for Fkbp5 intron 5 binding by GR and MECP2, comparing negative control (pre-immune serum) to -GC and +GC groups (a). We also tested for differences in relative expression using a Student’s t-test to compare VEHICLE- and DEX-treated samples, within -GFP and +GFP sorted samples (c). We used ANOVA among the clones to test for differences in their relative expression in Mecp2 and Fkbp5, as well as a linear regression for each clone as a categorical variable, and negative (scrambled shRNA) sample as a reference (d and e). Fkbp5 and Mecp2 expression levels were then modelled as a linear regression (f).
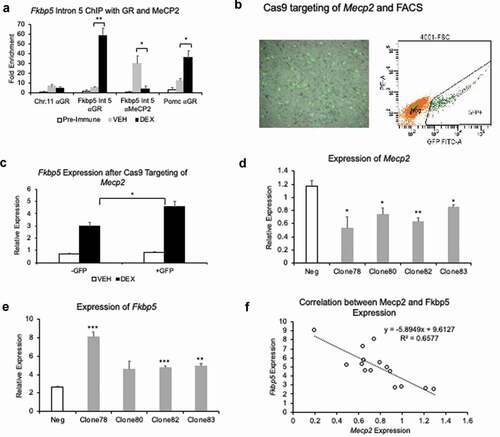
Figure 6. Methyl CpG-binding repressor MECP2 binds Fkbp5 intron 5, and its loss of function or reduction leads to increased levels of Fkbp5 expression. (a). HT-22 cells treated for 5 days with 1 μM DEX or VEHICLE solution were used in a ChIP assay to examine the occupancy of the glucocorticoid receptor (αGR) and MeCP2 at Fkbp5 intron 5. N = 4 per treatment group. DNA associated with GR or MeCP2 were assessed by qPCR for enrichment of the intron 5 region. An intergenic region from the mouse Chromosome 11 and a promoter GRE at the Pomc gene were used as negative and positive controls, respectively, for qPCR. (b). A lentiviral plasmid encoding a GFP-fused Cas9 protein and sgRNA targeting the third exon of Mecp2 was introduced into HT-22 cells. Following two days of culturing, cells were washed and treated with 1 μM DEX or VEHICLE solution for 4 hrs. GFP+ cells that indicated successful lentiviral transduction and sgRNA/Cas9 expression were isolated by fluorescence-activated cell sorting (FACS). (c). GFP+ (Mecp2-) and GFP- (Mecp2+) cells that were treated with DEX or VEHICLE solution were assayed for Fkbp5 expression. N = 3 per treatment group. (d). Lentiviral plasmids encoding four shRNAs against Mecp2 were introduced into HT-22 cells to knockdown Mecp2 expression. RT-qPCR showed a variable response of the four shRNA plasmid clones in terms of their ability to reduce Mecp2 levels. A scrambled shRNA plasmid was used as a negative control (Neg). N = 3 per shRNA clone. (e). Expression levels of Fkbp5 in the four shRNA clones were determined following a 4-hr treatment with 1 μM DEX or vehicle solution. Data are displayed as fold change over vehicle-treated samples whose relative expression was set to ‘1.’ N = 3 per shRNA clone. (f). Linear regression analysis shows a modest correlation between baseline Mecp2 levels in the shRNA-transfected cells and Fkbp5 levels in corresponding shRNA-transfected cells treated with DEX. Bar graphs are represented as mean ± SEM, and statistical significance was determined by Student’s t-tests: *p < 0.05, **p < 0.01, and ***p < 0.001
Results
Glucocorticoid-induced loss of DNA methylation in the brain
Previously, we have shown that the hippocampus and blood were susceptible to glucocorticoid-induced transcriptional and epigenetic changes at Fkbp5 [Citation9]. We asked whether this phenomenon extended to other brain regions relevant for stress-related behaviours to justify in vitro characterization and manipulation of Fkbp5. In addition to the hippocampus, we found highly significant glucocorticoid-induced changes in all of the tissues examined ()). Specifically, the amygdala, prefrontal cortex, and the hypothalamus from corticosterone (CORT)-treated animals all showed from 55.8% to 90.0% increase in Fkbp5 expression compared to those from VEHICLE-treated animals (N = 4 per group and p-values: 0.001 to 0.035). Consistently, glucocorticoid-induced expression was accompanied by a loss of DNA methylation at multiple CpGs located in the fifth intron of Fkbp5 (intron 5, )) in all four brain tissues examined: amygdala (1.8% to 12.6% and ANOVA p-value: 2.1x10⁻¹³); hippocampus (6.1% to 14.0% and ANOVA p-value: 5.6 × 10⁻⁹); hypothalamus (2.8% to 12.3% and ANOVA p-value: 2.0 × 10⁻¹⁶); and prefrontal cortex (−1.7% to 9.7% and ANOVA p-value: 1.6 × 10⁻⁴) () and Supplementary Table 1A). In contrast, methylation loss of three CpGs at the first intron (intron 1) in all brain tissues were less than 2.7% (p-value in amygdala: 0.45, hippocampus: 0.38, hypothalamus: 0.17, prefrontal cortex: 0.99, ) and Supplementary Table 1B), which is consistent with previous studies that documented GC-induced loss of intron 1 methylation in blood only [Citation9,Citation27]. Significant loss of intron 5 methylation in all four brain regions examined suggested a wide-spread epigenetic effect by GC exposure in the brain and necessitated an in-depth characterization of the underlying mechanism.
Persistence of DNA methylation in a neuronal cell line
In order to characterize the underlying mechanisms of GC action at the Fkbp5 locus, we used the glutamatergic mouse hippocampal cell line HT-22 that has been used previously to demonstrate GC-induced loss in vitro [Citation9]. This time, the cells were treated with the synthetic GC dexamethasone (DEX) for 10 days, after which the cells were washed with media and cultured in the absence of DEX for an additional 32 days before collection. At the four intron 5 CpGs where GC-induced loss of methylation occurred in the mouse brain ()), we observed varying degrees of methylation loss during the 10 days of DEX treatment. For CpG-1, there was an estimated reduction of −46.17% (95% CI: −50.30, −42.04). For CpG-2, the estimated reduction was −65.32% (95% CI: −70.00%, −60.53%). Over the course of 32 recovery days, both CpG-1 and CpG-2 showed gradual but significant recovery of the lost methylation content. For CpG-1, there was an estimated 25.92% recovery (95% CI: 22.24%, 29.60%) from Day 0 to Day 32. For CpG-2, there was a total recovery of 26.96% (95% CI: 22.88%, 30.96%) ()). At CpG-3 and CpG-4, there was an estimated reduction of −57.24% (95% CI: −50.30, 62.09) and −63.37% (95% CI: −70.30%, −60.33%), respectively. Unlike CpG-1 and CpG-2, CpG-3 and CpG-4 showed minimal recovery, with CpG-3 recovering 6.08% (95% CI: 0.96%, 11.20%) and CpG-4 recovering 1.92% cumulatively over the 32 days (95% CI: −4.16%, 8.00%) () and Supplementary Table 2A). Interestingly, CpG-1 and CpG-2 were located the farthest from the nearest GRE (182 and 175 bps, respectively), whereas CpG-3 was only 19 bps away from the nearest GRE, and CpG-4 was located within a GRE ()). This observation suggested that recovery may be dependent on the distance of each CpG from the GRE. In contrast, there were no significant differences in methylation during the treatment or the recovery period for all three CpGs in intron 1 ()). ANOVA p-values for intron 1 CpGs 1–3 are shown in Supplementary Table 2B.
We then sought to determine whether GC induction of Fkbp5 expression persisted during the 32-day recovery period. An increase in expression of 422% (p = 0.001) was observed in the DEX- vs. VEHICLE-treated samples at the end of the 10-day treatment period ()). At Day 0, DEX-treated samples were washed, and the media was replaced with DEX-free media. From Day 0 to 2, treated samples continued to have, on average, elevated expression by 5.85-fold (95% CI: 4.47, 7.23). However, the DEX-induced expression difference decayed by Day 11 with a nonsignificant (p > 0.1) undershoot effect observed on Day 11 and Day 19 compared to the corresponding VEHICLE-treated samples.
Effect of loss of DNA methylation on gene expression
Initially, the HT-22 cell line model showed a significant decrease in DNAm in intron 5 accompanied by a significant increase in Fkbp5 expression upon exposure to GCs. However, in the absence of GCs, the change in DNAm persisted, whereas the change in expression did not. Since the cell line model could retain an ‘epigenetic memory’ but not a ‘transcriptional memory’ of GC exposure, we sought to assess the molecular consequences of the ‘epigenetic memory.’ Specifically, we investigated whether the persistent loss of DNAm that we observed could affect future levels of Fkbp5 expression, such as in the case of a second exposure to GCs. HT-22 cells were treated with DEX or VEHICLE for 7 days, then allowed to recover in DEX-free media for 7 days. DEX-treated samples underwent a loss of DNAm, while vehicle-treated samples remained methylated at baseline levels as expected. These methylated (control) and demethylated (previously exposed) samples were then exposed to a second round of either VEHICLE or DEX for 4 hours. No differences in Fkbp5 expression levels were observed in the VEHICLE-treated cells regardless of previous DEX exposure (8.3% increase between previously-untreated vs. previously-treated, p = 0.37). However, a significant DEX-induced increase in expression levels was observed in the cells that were previously exposed to DEX (45.0% increase, p = 0.008, )). Despite the higher magnitude of DEX-induced Fkbp5 expression in the previously exposed samples, it was uncertain whether methylation levels in intron 5 directly contributed to this observed change in gene expression. To answer this question, we cloned the intron 5 region into a CpG-less plasmid, upstream of a minimal promoter and a luciferase reporter cDNA ()). For this experiment, we used the AtT-20 cell line, which also underwent GC-induced loss in DNA methylation [Citation11] but was more amenable to transfections. The plasmid was then methylated in vitro using a bacterial methylase and transfected into cells. This plasmid allowed us to first confirm the ability of intron 5 DNA to serve as a glucocorticoid response element (GRE) and then to assess the role of the methylation status of its four CpGs on gene expression. When unmethylated, the intron 5 region led to a 779% increase in luciferase activity by DEX treatment (p = 2.5x10⁻⁴, )). In contrast, artificially methylating its four CpGs caused only a 141% increase in DEX-induced luciferase activity compared to VEHICLE-treated samples (p = 2.7x10⁻⁴). The measured luciferase activity in the DEX-treated, methylated samples represented a 75.2% reduction (p = 4.9x10⁻⁴) from their unmethylated counterpart. To assess whether this is a phenomenon that can apply more generally to other GREs, we also cloned in three tandem copies of a consensus GRE flanked by one CpG at each end ()). Similar results were observed with the consensus GRE sequence, with the methylated GRE causing a 48.0% reduction (p = 4.4x10⁻⁴) in luciferase activity compared to its unmethylated counterpart following DEX treatment. These results suggest that methylation of CpGs within or near GREs, including those in Fkbp5 intron 5, are biologically relevant and can influence gene transcription.
Role of DNMT1 on GC-induced loss of DNA methylation
We have previously shown that CORT-treatment leads to dose-dependent decrease in the expression level of Dnmt1, suggesting that GC-induced loss of methylation at intron 5 may be mediated by the DNMT1 enzyme [Citation11]. We sought to examine the role of DNMT1 by inhibiting its activity with its antagonist 5-aza-2’-deoxycytidine (AZA) in the presence of GCs. HT-22 cells were treated with either VEHICLE or DEX solution in the presence of different doses of AZA (0, 0.05, 0.1, and 0.25 μM) for five days. In the VEHICLE-treated samples, all of the four CpGs in intron 5 underwent loss of methylation in a dose-dependent manner consistent with increasing concentration of AZA. For instance, CpG-4 in the VEHICLE-treated samples lost methylation with increasing doses of AZA as follows: 0.05 μM (18.2%, p = 9.0x10⁻⁴); 0.1 μM (31.1%, p = 1.0x10⁻⁴); and 0.25 μM (45.1%, p = 7.3x10⁻⁶, )). AZA concentrations higher than 0.25 μM were toxic to the cells. In contrast, in the DEX-treated samples, all of the intron 5 CpGs underwent both DEX- and AZA-induced loss of methylation, with AZA treatment showing dose-independent loss. In the same CpG-4, for instance, DEX treatment alone (with 0 μM AZA) caused a 33.2% decrease (p = 2.87x10⁻¹⁰) in DNA methylation. However, increasing the dose of AZA across the treatment levels caused an additional decrease in methylation of 15.5% (p = 6.3x10⁻⁴), 18.7% (p = 1.5x10⁻⁵), and 18.3% (p = 3.6x10⁻⁵), respectively, without a noticeable dose response. There was a statistically significant interaction between DEX treatment and AZA dose for 0.05 μM (p = 1.24x10⁻⁸) and 0.2 μM (p = 0.02) AZA levels, but not for 0.25 μM (p = 0.83). Similar results were obtained for intron 5 CpGs 1–3 (graph not shown). Intron 1 methylation was also assessed as a control. As expected, all three CpGs showed dose-dependent loss of methylation, with no substantial influence from the DEX treatment (<3% methylation difference), except at 0.25 μM AZA, where all three CpGs exhibited slightly higher increase in DNA methylation (4.1% to 5.7%, p = 0.009 to 0.02) in the DEX-treated samples (graph for only CpG-3 is shown in )). While statistically there was an interaction between AZA dose and DEX treatment at intron 1, it was an order of magnitude smaller than that seen in intron 5 (e.g., an interactive effect of 20.14% for intron 5 CpG-4 vs. 3.66% forintron 1 CpG-3). Taken together, GC-induced, site-specific loss of methylation likely works in conjunction with the activity of DNMT1.
GC-induced loss of DNA methylation is dependent on cell replication
In the cell, the maintenance methyltransferase DNMT1 is responsible for duplicating the methylation patterns of the parental DNA strand onto the newly synthesized daughter strand following DNA synthesis and cell division. Given its additional role in glucocorticoid signalling, we asked whether cell division played a role in the ability of GCs to induce loss of DNA methylation. HT-22 cells were treated with the chemotherapeutic drug mitomycin C (MMC), which inhibits DNA synthesis by creating covalent crosslinks across the two strands of the DNA duplex [Citation28]. Following three hours of exposure to MMC, cells were washed and cultured for an additional five days in VEHICLE- or CORT-containing media. Bisulphite pyrosequencing of Fkbp5 intron 5 showed that while all of the four CpGs in the untreated samples underwent GC-induced loss of DNA methylation (8.7 to 20.7%, p < 8.6x10⁻⁴), samples exposed to MMC did not undergo significant changes in methylation (0.3 to 4.1%, p > 0.4, )). To replicate this finding, GC-responsive AtT-20 pituitary cells were treated with varying concentrations of nocodazole (NCO), another anti-mitotic drug that is thought to inhibit cell replication by binding tubulin and destabilizing microtubule assembly [Citation29]. Cells were cultured in the presence of several concentrations of NCO (0, 10, 50, 100, 300, and 500 nM), and MTT assays were performed to assess inhibition of cell proliferation. In the VEHICLE-treated cells, 50 nM of NCO caused a 24.5% (p = 4.8x10⁻⁴) reduction in cell proliferation compared to 0 nM baseline, and 100 nM caused 77.2% reduction (p = 6.5x10⁻¹⁰). In contrast, in the CORT-treated cells, 50 nM of NCO caused a more substantial 73.2% (p = 4.6x10⁻⁷) reduction with similar reduction at 100 nM (80.7%, p = 1.2x10⁻⁸). There was a statistically significant change point at 10 nM NCO concentration (p = 2.89x10⁻⁸) indicating a threshold effect at higher concentrations (e.g., 50 nM and above) ()). Cells were also assessed for changes in DNA methylation. At 0 and 10 nM of NCO, where no substantial loss of cell replication was observed, predicted patterns of GC-induced loss of DNA methylation were observed at all 4 CpGs in intron 5 (0 nM NCO: 10.2 to 24.5%, p < 6.5x10⁻⁴ and 10 nM NCO: 10.3 to 29.7%, p < 9.9x10⁻⁵). However, 50 nM NCO significantly impaired the ability of CORT to influence DNA methylation (<6%, )). There was a statistically significant change point at 10 nM NCO concentration (p = 3.19x10⁻⁷), indicating a threshold effect at 50 nM and higher. As expected, there were no changes in DNA methylation in the VEHICLE-treated samples regardless of the NCO concentrations.
Involvement of MeCP2 in GC-induced Fkbp5 expression
Glucocorticoid-induced changes in DNA methylation likely confer differential binding to methylation-dependent repressor proteins that mediate the effect of DNA methylation on gene expression. We tested whether the methyl CpG-binding protein MeCP2 played such a mediating role. Using chromatin immunoprecipitation, we first demonstrated an interaction between the GC receptor (GR) and MECP2 with the Fkbp5 intron 5 GRE. ()). Then using the CRISPR system consisting of GFP-fused Cas9 cDNA on the same plasmid as the sgRNAs, the Mecp2 gene was silenced by targeting its third exon. Two days following transfection with the Cas9 plasmids, cells were treated with either VEHICLE or DEX for four hours. CRISPR/sgRNA-positive cells, as indicated by GFP, were isolated by fluorescence-activated cell sorting (FACS) ()), and both GFP- and GFP+ cells were tested for Fkbp5 expression. GFP+, DEX-treated cells showed 54% higher (p = 0.038) Fkbp5 expression than GFP-, DEX-treated cells ()). No significant differences were observed between VEHICLE-treated GFP- and GFP+ cells. We also sought to independently validate the CRISPR results by silencing Mecp2 expression using a shRNA/lentivirus system. Different shRNAs targeting the Mecp2 transcript were used, and their effect on Mecp2 expression was determined by qPCR. Knockdown efficiencies among the different Mecp2 shRNA constructs varied from 27.0% to 54.7% (p < 0.03) compared to negative control shRNA ()). All shRNA-transfected cells, including the negative control, were exposed to DEX and assessed for Fkbp5 expression. Compared to the negative control shRNA-transfected cells, Mecp2 shRNA+ cells showed a range of increase in Fkbp5 expression (74.1% to 209.1%, p-values from 0.12 to 5.4x10⁻⁴, )). A linear regression analysis using all of the shRNA constructs and their replicates showed a significant association between the expression levels of Mecp2 and Fkbp5 (p = 2.4x10⁻⁴, )), suggesting that a unit decrease in Mecp2 expression led to an increase in Fkbp5 expression by 5.89 relative expression units (95% CI: 3.58, 9.21).
GC-induced interaction between the Fkbp5 GRE and the promoter
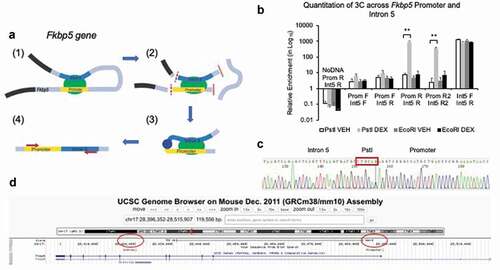
Finally, we sought to understand how GR binding to its GRE in intron 5 more than 60 kilobases downstream of the promoter could regulate transcription. We performed chromosome conformation capture (3 C) to test our hypothesis that in the presence of GCs, the GRE in intron 5 can increase Fkbp5 expression by physically interacting with the promoter. 3 C is predicated on the ability to use a restriction enzyme and a ligase to digest and then concatenate two distant genomic regions that physically interact for gene regulation. For both the promoter and intron 5 of Fkbp5, a common restriction site for the enzyme PstI was found. PCR amplification across the concatenated regions served as evidence of this interaction ()). qPCR showed that in the presence of DEX, such a concatenated PCR amplicon could form ()). An additional primer set further away from the PstI site did also produced similar qPCR results. The hybrid sequence was further verified by Sanger sequencing ()) and mapped to the expected promoter and intronic regions of Fkbp5 using the UCSC Genome Browser (mouse mm10 assembly, )). These results demonstrate that GC-exposure leads to Fkbp5 transcription by facilitating a physical interaction between the promoter and the GRE.
Figure 7. GC-treatment induces a physical interaction between the Fkbp5 promoter and intron 5. (a). A schematic drawing shows a GC-induced physical interaction between the promoter and intron 5 of Fkbp5 (1) with each having at least one PstI site in common (2). Digestion of cross-linked chromatin with PstI (2) followed by religation would enable the concatenation and formation of a promoter-intron 5 hybrid if they are in close proximity to each other (3). Small red arrows indicate the approximate locations of one set of primers used for PCR amplification (4). Additional introns and exons at the top of the loop between the promoter and intron 5 are not shown in the diagram. (b). HT-22 cells treated with DEX show a physical interaction between the two genomic regions, as assessed by qPCR. Primers against the promoter (Prom F and R) and intron 5 (Int5 F and R) were used in different combinations to demonstrate that PstI-digested and religated DNA-protein complexes, but not EcoRI-digested samples, showed a physical interaction. Prom R2 and Int5 R2 primers are located further away from the PstI site compared to the Prom R and Int5 R primers, respectively. (c). Sanger sequencing of the PCR product shows the concatenation of the promoter and intron 5 regions demarcated by PstI. (d). The BLAT function on the UCSC Genome Browser was used to show that the DNA sequence aligned to both the promoter and intron 5 of Fkbp5. Bar graphs are represented as mean ± SEM, and statistical significance was determined by Student’s t-tests: **p < 0.01
Discussion
In the current study, we sought to better understand the underlying mechanisms that govern GC-induced changes in DNA methylation. A previous study by our group has shown that GCs can alter DNA methylation across the genome and impact diverse pathways associated with WNT, calcium, neurotrophin, and insulin signalling among many others in the mouse hippocampus [Citation27]. Interestingly, GC exposure also tends to favour loss-of-methylation rather than gain-of-methylation events, despite a recent study reporting roughly the same number of up- and down-regulated GC target genes [Citation30]. While these genome-wide studies can provide ‘big picture’ insights such as gene-sets, pathways, and common motifs among target genes, they often do not provide an in-depth mechanistic understanding of how genes are regulated by GCs. To this end, we chose the stress response gene Fkbp5 for a detailed investigation, as it undergoes robust GC-induced loss of DNA methylation in cell lines and the mouse hippocampus [Citation9,Citation11,Citation31]. Interestingly, methylation levels of Fkbp5 are correlated with hippocampal Fkbp5 expression levels and anxiety-like behaviour in mice [Citation16,Citation31] and integrated 30-day cortisol levels [Citation32] and childhood trauma exposure in humans [Citation1]. However, the aforementioned animal studies have been observational in nature and underscored the importance of a mechanistic understanding of Fkbp5 regulation in neuroendocrinology and psychiatry.
We first began our study by establishing GC-induced loss of Fkbp5 methylation in multiple brain regions. The amygdala, hippocampus, hypothalamus, and prefrontal cortex all underwent corticosterone (CORT)-induced loss of DNA methylation. Here we use the term ‘loss of methylation’ because unlike blood, brain regions do not undergo appreciable GC-induced changes in cell-type composition [Citation27], where changing proportions of different cell types with distinct methylation levels may be misconstrued as bona fide changes in methylation levels. We have previously demonstrated CORT-induced methylation changes in the hippocampus [Citation9], whereas another group has reported Fkbp5 methylation changes in the amygdala of mice whose fear extinction has been enhanced by treatment with dexamethasone [Citation33]. The four brain regions examined also exhibited CORT-induced increase in Fkbp5 expression. Collectively, these results reflect a concerted effort by different regions of the brain to respond to chronic exposure to GCs.
Having established the relevance of GC-induced methylation changes in vivo, we used cell line models to conduct a more in-depth analysis. There are several reasons as to why cell lines such as HT-22 and AtT-20 were used. First, use of homogeneous cell lines minimized the possibility of there being changes in cell-type composition. Similarly, use of cell lines in this study has enabled us to focus on an epigenetic process without the additional physiological responses that might create confounding factors. However, we acknowledge that this reductionist approach has limitations, especially in serving as a model of in vivo systems where physiological context may be important. Second, cell line models have been used previously to demonstrate robust (>15%) changes in DNA methylation that are much easier to detect than in animal models, especially when DNA methylation is altered by pharmacological means [Citation9,Citation11]. The presence of GC-induced loss of methylation in the cell lines also implies that same epigenetic factors likely govern both systems. Third, many of the manipulations performed in the study, such as treatment with MMC, MCO, and AZA, use of reporter or CRISPR constructs, and multiple samplings over a 32-day period, are challenging with animal models. We also justify the use of the AtT-20 pituitary cell line since it is easier to transfect plasmids, such as those used for the luciferase assay, compared to viral transduction experiments performed in the HT-22 cells. For MTT assays, the AtT-20 pituitary cell line was preferred due to their slower growth rate in a 96-well plate. Despite the differences in cell type, we have previously observed similar GC-induced changes in gene expression and DNA methylation in the mouse brain and both cell lines, suggesting that similar mechanisms may play a role.
We used the cell line model to first demonstrate that not all epigenetic changes persist. One of the central tenets of epigenetics is that it provides a mechanism by which nuclear architecture can shape a gene’s transcriptional inertia. Epigenetic factors have been proposed as the mechanism by which exposure to environmental stressors such as early life adversity or in utero exposure to pathogens or medications can have long-lasting effects on an adult’s psychopathology. Our cell line data show that while GC-induced epigenetic changes do persist throughout the recovery period, half of the CpGs, especially the two farther away from the GREs, undergo a gradual reversal towards baseline methylation levels. This finding has several implications. First, GC-induced loss of CpG methylation in the vicinity of and beyond the GRE means that any other methylation-sensitive transcription or enhancer factors, either by direct loss of methylation or open chromatin conformation, can bind more easily to the intronic region. For instance, the Fkbp5 intronic GRE also binds to receptors for androgens [Citation34] and progestins [Citation35], so that the region would be more responsive to both hormones. It is likely that other transcription factors beyond steroid hormone receptors gain increased access to this region. Second, the persistent reduction in methylation of the two CpGs nearby the GRE may serve as a specific example of a mechanism where exposure to stress or GCs leads to persistent changes in responsiveness to GCs. In fact, GREs located in introns 2 and 7 of the human FKBP5 gene show persistent allele-specific loss of methylation in the blood DNA of adults exposed to childhood trauma [Citation1]. Third, a gradual reversal of some of the CpGs suggests that GC-induced methylation loss is not permanent. This novel finding suggests that some of the effects of prolonged GC exposure, such as chromatin accessibility near the GRE, can be reversed, with the exception of the GRE where methylation loss is more persistent. It is unclear why those two CpGs are persistently demethylated given the absence of any additional GC signalling during the 32-day recovery period as indicated by gene expression levels. Further, it will be intriguing to see whether animal models behave in a similar fashion and how far the loss of methylation and its decay spread from the GRE.
To experimentally demonstrate that loss of methylation is functionally significant, we tested both the HT-22 previously treated with GCs and an in vitro reporter system. We first used the cell line to show that cells previously exposed to GCs for 5 days and underwent loss of methylation showed a more robust expression of Fkbp5 compared to cells that were previously not exposed to GCs. Our finding is consistent with a previous study that used a chronic stress paradigm to show that previous exposure to stress alters the hippocampal transcriptome of rats challenged with GCs [Citation36]. Another epigenomic study using a human foetal hippocampal cell line has reported that GC-induced methylation changes lead to a significantly enhanced transcriptional response of candidate target genes after a second acute GC challenge [Citation37]. As mentioned above, a previous work has reported the presence of multiple GREs across the human FKBP5 [Citation1]. To show that CpG methylation levels near the intron 5 GRE could influence gene activity, we subcloned the intronic fragment upstream of the luciferase reporter gene. The results suggest that the methylation status of the four CpGs are functionally significant, as a robust luciferase activity was observed when the fragment was unmethylated. Interestingly, three tandem copies of a consensus GRE fragment also exhibited the same effect, emphasizing the dual role of CpG methylation as both a deterrent to GC exposure and as a regulator of gene function.
We then asked whether the GC-induced loss of methylation in the HT-22 cells involved the maintenance methyltransferase DNMT1. Previously, we have reported that GC treatment leads to the reduction of Dnmt1 expression in the mouse hippocampus and a dose-dependent decrease in the AtT-20 cell line [Citation11]. AZA was used to inhibit the methyltransferase activity of DNMT1, and as expected, dose-dependent loss of methylation was observed at Fkbp5 in the HT-22 cells in the absence of GCs. Interestingly, treatment with GCs increased the sensitivity of the cells to AZA so that even the lowest concentration of AZA caused the methylation levels to ‘bottom out’ and stay at the same low levels as those at higher AZA concentrations. Although the additional loss of DNA methylation borne by AZA is smaller in magnitude compared to that caused by DEX, this finding reflects an additive effect of both AZA and GCs on DNMT1 function and suggests that DNMT1 may play a role in the GC-induced loss of methylation at the Fkbp5 locus.
Since the activity of DNMT1 is coupled with cell division, i.e. establishing parental strand’s methylation patterns on the daughter strand following DNA replication, we next tested whether GC-induced loss of methylation also depended on cell division. We used two independent methods for arresting cell growth by crosslinking DNA (MMC) or destabilizing microtubule assembly (NCO). With both of these chemicals, GC-dependent loss of methylation was disrupted, suggesting that GC-induced epigenetic changes involve both DNMT1 and cell replication. These results raise an intriguing question as to whether non-replicating cells such as postmitotic neurons undergo similar GC-induced epigenetic changes in vivo. It is unclear whether the methylation changes in the mouse brain reflect methylation changes in only dividing populations of cells in the brain such as the neural progenitor cells (NPCs) or alternate mechanisms exist in vivo to induce methylation changes following GC exposure. If the former case is true, then there may be additional populations of proliferative cells beyond the hippocampal dentate gyrus already known to undergo neurogenesis [Citation38]. Further, if only actively dividing cells undergo GC-induced loss of methylation, then neurodevelopmental periods during which these events occur may be more susceptible to detrimental effects of GC exposure. This implication is consistent with the impact of stress or trauma exposure in utero or during childhood, when the brain is still developing, on disease risk later in life [Citation39–41].
Despite the functional relationship that exists between DNA methylation and gene expression of Fkbp5, a mechanism connecting the two has been unclear. Previously, MeCP2 has been shown to bind specific genomic regions of HPA axis genes, such as the Crf promoter, Sgk1, and intron 1 and promoter of Fkbp5 in a mouse model of Rett syndrome [Citation42–44]. Using ChIP assay, we demonstrated that MeCP2 occupies the Fkbp5 intron 5, presumably through its binding of the CpG(s) near the GRE, and its occupancy is diminished in a reciprocal pattern with that of the GC receptor following chronic GC exposure. We then proceeded to manipulate the expression levels of Mecp2 using two independent methods. Both methods consisting of CRISPR-mediated gene-editing and shRNA-mediated knockdown led to increases in Fkbp5 expression. Given its role as a methyl-CpG-binding repressor protein, MeCP2 may be affecting Fkbp5 expression by its reduced binding of the intron 5 GRE following GC-induced loss of DNA methylation. However, we do not rule out the possibility that MeCP2 can affect Fkbp5 expression through other loci in Fkbp5 and methylation-independent mechanisms.
Finally, we sought to find additional evidence of how the Fkbp5 intron 5 GRE regulates GC-induced transcription. We performed a 3 C experiment using the HT-22 mouse hippocampal cell line and showed a physical interaction between the intron 5 GRE and the promoter following GC treatment. In a human lymphoblastoid cell line, FKBP5 introns 2 and 7 interact with the promoter [Citation1]. A similar mechanism exists at the Nr3c1 gene (encoding the GC receptor), where the GC receptor binds an intronic GRE, interacts with the promoter, and regulates its own gene expression [Citation12]. It is likely that multiple GREs within or near a GC-regulated gene participate in a coordinated fashion and interact with the promoter to regulate transcription. It may also be the case that the participation of any specific intronic GRE is tissue-specific and dictated by accessibility of the GC receptor to the GRE [Citation45].
Despite the novel findings, there were several limitations to our study. Foremost, it is unclear whether some of the findings can be replicated in vivo. Although the initial mouse experiments and previous studies demonstrate GC-induced methylation loss of Fkbp5, it is not known, for instance, whether some of the methylation patterns reverse following a period of GC withdrawal or MeCP2 plays a role in mediating Fkbp5 silencing in GC-treated mice. Importantly, as mentioned before, it is unclear whether the same or an independent mechanism tethers loss of DNA methylation with cell replication in the mouse brain. Cohorts of animals at different ages need to be investigated to determine whether specific windows of neurodevelopment confer risk or vulnerability to stress or GC exposure. Another limitation is our choice of Fkbp5 as the candidate gene for investigation. Fkbp5, along with Nr3c1 that encodes the GC receptor, is both a target gene and negative feedback regulator of GC signalling. The FKBP5 protein antagonizes GC signalling by tethering the GC receptor to a chaperone complex to impede the GC receptor’s binding to GCs [Citation13]. This means that the increase in gene expression and loss of DNA methylation observed with Fkbp5 following GC exposure reflect a steady state response between two opposing forces, namely GC-induced Fkbp5 regulation and FKBP5 protein’s antagonism on GC signalling. We do not know how a GC target gene that does not also regulate GC signalling may behave under the same conditions. Of particular interest are genes that are silenced by GC signalling via negative GREs (nGREs) [Citation46]. For instance, we do not know whether a gene silenced by nGREs, such as the brain-derived neurotrophic factor (Bdnf), undergo GC-induced gain of methylation. Our previous study showed that more than 70% of epigenetic changes following GC exposure are loss-of-methylation events [Citation27]. If GC-induced gene silencing does not involve increase in DNA methylation, then it will be interesting to examine histone modifications and chromatin remodelling as potential alternative mechanisms.
Given its role as a regulator of GC signalling, the FKBP5 gene is associated with a number of stress-related psychiatric disorders. These include bipolar disorder, depression, anxiety disorder, and PTSD [Citation14,Citation15,Citation47,Citation48]. Importantly, one of the common allelic variations associated with these disorders, rs1360780, is associated with increase in protein expression, which is consistent with increased gene expression following chronic GC exposure [Citation14]. In addition, individuals who have experienced childhood trauma and carry the risk variant of rs1360780 harbour a reduction in intronic DNA methylation [Citation1]. Due to its role as a negative regulator of GC signalling, FKBP5 is also associated with glucocorticoid resistance [Citation49]. Altered sensitivity to GCs has a detrimental impact on neurotransmission and neuroprotection [Citation50–53]. Collectively, these studies highlight the complex interaction between genetics and environmental stressors that shapes epigenetic and transcriptional regulation of FKBP5 and the role of glucocorticoid resistance in neuronal function and psychiatric disorders. In this study, we have examined how GC exposure can epigenetically alter Fkbp5 expression. Additional work in neuroscience is necessary to delineate how brain function is altered by GCs or stress and how this alteration, in turn, contributes to psychiatric disorders.
Financial disclosures
None
Supplemental Material
Download Zip (124.9 KB)Acknowledgments
This study was funded by NIH grant MH101392 (RSL) and support from the following awards and foundations: a NARSAD Young Investigator Award, Margaret Ann Price Investigator Fund, the James Wah Mood Disorders Scholar Fund via the Charles T. Bauer Foundation, Baker Foundation, and the Project Match Foundation (RSL).
Disclosure statement
No potential conflict of interest was reported by the authors.
Supplementary materials
Supplemental data for this article can be accessed here.
Additional information
Funding
Related Research Data
References
- Klengel T, Mehta D, Anacker C, et al. Allele-specific FKBP5 DNA demethylation mediates gene-childhood trauma interactions. Nat Neurosci. 2013;16(1):33–41.
- Wu Y, Patchev AV, Daniel G, et al. Early-life stress reduces DNA methylation of the Pomc gene in male mice. Endocrinology. 2014;155(5):1751–1762.
- Webster MJ, Knable MB, O’Grady J, et al. Regional specificity of brain glucocorticoid receptor mRNA alterations in subjects with schizophrenia and mood disorders. Mol Psychiatry. 2002;7(985–94):24.
- Binder EB, Nemeroff CB. The CRF system, stress, depression and anxiety-insights from human genetic studies. Mol Psychiatry. 2010;15(6):574–588.
- Raue S, Wedekind D, Wiltfang J, et al. The role of proopiomelanocortin and alpha-melanocyte-stimulating hormone in the metabolic syndrome in psychiatric disorders: a narrative mini-review. Front Psychiatry. 2019;10:834.
- Elliott E, Ezra-Nevo G, Regev L, Neufeld-Cohen A, Chen A. Resilience to social stress coincides with functional DNA methylation of the Crf gene in adult mice. Nat Neurosci. 2010;13:1351–1353.
- Lee RS, Sawa A. Environmental stressors and epigenetic control of the hypothalamic-pituitary-adrenal axis. Neuroendocrinology. 2014;100(4):278–287.
- Niwa M, Jaaro-Peled H, Tankou S, et al. Adolescent stress-induced epigenetic control of dopaminergic neurons via glucocorticoids. Science. 2013;339(6117):335–339.
- Lee RS, Tamashiro KL, Yang X, et al. Chronic corticosterone exposure increases expression and decreases deoxyribonucleic acid methylation of Fkbp5 in mice. Endocrinology. 2010;151(9):4332–4343.
- Weaver IC, Cervoni N, Champagne FA, et al. Epigenetic programming by maternal behavior. Nat Neurosci. 2004;7(8):847–854.
- Yang X, Ewald ER, Huo Y, et al. Glucocorticoid-induced loss of DNA methylation in non-neuronal cells and potential involvement of DNMT1 in epigenetic regulation of Fkbp5. Biochem Biophys Res Commun. 2012;420(3):570–575.
- Ramamoorthy S, Cidlowski JA. Ligand-induced repression of the glucocorticoid receptor gene is mediated by an NCoR1 repression complex formed by long-range chromatin interactions with intragenic glucocorticoid response elements. Mol Cell Biol. 2013;33(9):1711–1722.
- Binder EB. The role of FKBP5, a co-chaperone of the glucocorticoid receptor in the pathogenesis and therapy of affective and anxiety disorders. Psychoneuroendocrinology. 2009;34(Suppl 1):S186–95.
- Binder EB, Salyakina D, Lichtner P, et al. Polymorphisms in FKBP5 are associated with increased recurrence of depressive episodes and rapid response to antidepressant treatment. Nat Genet. 2004;36(12):1319–1325. .
- Willour VL, Chen H, Toolan J, et al. Family-based association of FKBP5 in bipolar disorder. Mol Psychiatry. 2009;14(3):261–268. .
- Lee RS, Tamashiro KL, Yang X, et al. A measure of glucocorticoid load provided by DNA methylation of Fkbp5 in mice. Psychopharmacology (Berl). 2011;218(1):303–312.
- Conrad CD, McLaughlin KJ, Harman JS, et al. Chronic glucocorticoids increase hippocampal vulnerability to neurotoxicity under conditions that produce CA3 dendritic retraction but fail to impair spatial recognition memory. J Neurosci. 2007;27(31):8278–8285.
- Du J, Wang Y, Hunter R, et al. Dynamic regulation of mitochondrial function by glucocorticoids. Proc Natl Acad Sci U S A. 2009;106(9):3543–3548. .
- Gourley SL, Wu FJ, Kiraly DD, et al. Regionally specific regulation of ERK MAP kinase in a model of antidepressant-sensitive chronic depression. Biol Psychiatry. 2008;63(4):353–359.
- Karatsoreos IN, Bhagat SM, Bowles NP, et al. Endocrine and physiological changes in response to chronic corticosterone: a potential model of the metabolic syndrome in mouse. Endocrinology. 2010;151(5):2117–2127.
- Livak KJ, Schmittgen TD. Analysis of relative gene expression data using real-time quantitative PCR and the 2(-Delta Delta C(T)) Method. Methods. 2001;25(4):402–408.
- Colella S, Shen L, Baggerly KA, et al. Sensitive and quantitative universal Pyrosequencing methylation analysis of CpG sites. Biotechniques. 2003;35(1):146–150.
- Klug M, Rehli M. Functional analysis of promoter CpG methylation using a CpG-free luciferase reporter vector. Epigenetics. 2006;1(3):127–130.
- Lee RS, Pirooznia M, Guintivano J, et al. Search for common targets of lithium and valproic acid identifies novel epigenetic effects of lithium on the rat leptin receptor gene. Transl Psychiatry. 2015;5(7):e600.
- Bates D, Machler M, Bolker B, et al. Fitting linear mixed-effects models using lme4. J Stat Softw. 2015;67(1):1–48.
- Fong Y, Huang Y, Gilbert PB, et al. chngpt: threshold regression model estimation and inference. BMC Bioinformatics. 2017;18(1):454.
- Seifuddin F, Wand G, Cox O, et al. Genome-wide Methyl-Seq analysis of blood-brain targets of glucocorticoid exposure. Epigenetics. 2017;12(1):1–16. .
- Tomasz M. Mitomycin C: small, fast and deadly (but very selective). Chem Biol. 1995;2(9):575–579.
- Blajeski AL, Phan VA, Kottke TJ, et al. G(1) and G(2) cell-cycle arrest following microtubule depolymerization in human breast cancer cells. J Clin Invest. 2002;110(1):91–99.
- Murani E, Trakooljul N, Hadlich F, et al. Transcriptome responses to dexamethasone depending on dose and glucocorticoid receptor sensitivity in the liver. Front Genet. 2019;10:559.
- Ewald ER, Wand GS, Seifuddin F, et al. Alterations in DNA methylation of Fkbp5 as a determinant of blood-brain correlation of glucocorticoid exposure. Psychoneuroendocrinology. 2014;44:112–122.
- Lee RS, Mahon PB, Zandi PP, et al. DNA methylation and sex-specific expression of FKBP5 as correlates of one-month bedtime cortisol levels in healthy individuals. Psychoneuroendocrinology. 2018;97:164–173.
- Sawamura T, Klengel T, Armario A, et al. Dexamethasone treatment leads to enhanced fear extinction and dynamic Fkbp5 regulation in amygdala. Neuropsychopharmacology. 2016;41(3):832–846.
- Magee JA, Chang LW, Stormo GD, et al. Direct, androgen receptor-mediated regulation of the FKBP5 gene via a distal enhancer element. Endocrinology. 2006;147(1):590–598.
- Hubler TR, Scammell JG. Intronic hormone response elements mediate regulation of FKBP5 by progestins and glucocorticoids. Cell Stress Chaperones. 2004;9(3):243–252.
- Datson NA, van den Oever JM, Korobko OB, et al. Previous history of chronic stress changes the transcriptional response to glucocorticoid challenge in the dentate gyrus region of the male rat hippocampus. Endocrinology. 2013;154(9):3261–3272.
- Provencal N, Arloth J, Cattaneo A, et al. Glucocorticoid exposure during hippocampal neurogenesis primes future stress response by inducing changes in DNA methylation. Proc Natl Acad Sci U S A. 2019;117(38):23280–23285. .
- Lie DC, Colamarino SA, Song HJ, et al. Wnt signalling regulates adult hippocampal neurogenesis. Nature. 2005;437(7063):1370–1375. .
- Yang BZ, Zhang H, Ge W, et al. Child abuse and epigenetic mechanisms of disease risk. Am J Prev Med. 2013;44(2):101–107.
- Cao-Lei L, Veru F, Elgbeili G, et al. DNA methylation mediates the effect of exposure to prenatal maternal stress on cytokine production in children at age 13 (1/2)years: project Ice Storm. Clin Epigenetics. 2016;8(1):54.
- Duis J, Cox OH, Ji Y, et al. Effect of genotype and maternal affective disorder on intronic methylation of FK506 binding protein 5 in cord blood DNA. Front Genet. 2018;9:648.
- Urdinguio RG, Lopez-Serra L, Lopez-Nieva P, et al. Mecp2-null mice provide new neuronal targets for Rett syndrome. PLoS One. 2008;3(11):e3669.
- Nuber UA, Kriaucionis S, Roloff TC, et al. Up-regulation of glucocorticoid-regulated genes in a mouse model of Rett syndrome. Hum Mol Genet. 2005;14(15):2247–2256. .
- McGill BE, Bundle SF, Yaylaoglu MB, et al. Enhanced anxiety and stress-induced corticosterone release are associated with increased Crh expression in a mouse model of Rett syndrome. Proc Natl Acad Sci U S A. 2006;103(48):18267–18272.
- John S, Sabo PJ, Thurman RE, et al. Chromatin accessibility pre-determines glucocorticoid receptor binding patterns. Nat Genet. 2011;43(3):264–268.
- Surjit M, Ganti KP, Mukherji A, et al. Widespread negative response elements mediate direct repression by agonist-liganded glucocorticoid receptor. Cell. 2011;145(2):224–241.
- Minelli A, Maffioletti E, Cloninger CR, et al. Role of allelic variants of FK506-binding protein 51 (FKBP5) gene in the development of anxiety disorders. Depress Anxiety. 2013;30(12):1170–1176. .
- Binder EB, Bradley RG, Liu W, et al. Association of FKBP5 polymorphisms and childhood abuse with risk of posttraumatic stress disorder symptoms in adults. JAMA. 2008;299(11):1291–1305. .
- Scammell JG, Denny WB, Valentine DL, et al. Overexpression of the FK506-binding immunophilin FKBP51 is the common cause of glucocorticoid resistance in three New World primates. Gen Comp Endocrinol. 2001;124(2):152–165.
- Niwa M, Lee RS, Tanaka T, et al. A critical period of vulnerability to adolescent stress: epigenetic mediators in mesocortical dopaminergic neurons. Hum Mol Genet. 2016;25(7):1370–1381.
- Smith MA, Makino S, Kvetnansky R, et al. Stress and glucocorticoids affect the expression of brain-derived neurotrophic factor and neurotrophin-3 mRNAs in the hippocampus. J Neurosci. 1995;15(3):1768–1777.
- Glatz K, Mossner R, Heils A, et al. Glucocorticoid-regulated human serotonin transporter (5-HTT) expression is modulated by the 5-HTT gene-promotor-linked polymorphic region. J Neurochem. 2003;86(5):1072–1078.
- Ou XM, Chen K, Shih JC. Glucocorticoid and androgen activation of monoamine oxidase A is regulated differently by R1 and Sp1. J Biol Chem. 2006;281(30):21512–21525.