
 ?Mathematical formulae have been encoded as MathML and are displayed in this HTML version using MathJax in order to improve their display. Uncheck the box to turn MathJax off. This feature requires Javascript. Click on a formula to zoom.
ABSTRACT
Epigenetic modifications can contribute to adaptation, but the relative contributions of genetic and epigenetic variation are unknown. Previous studies on the role of epigenetic changes in adaptation in eukaryotes have nearly exclusively focused on cytosine methylation (m5C), while prokaryotes exhibit a richer system of methyltransferases targetting adenines (m6A) or cytosines (m4C, m5C). DNA methylation in prokaryotes has many roles, but its potential role in adaptation still needs further investigation. We collected phenotypic, genetic, and epigenetic data using single molecule real-time sequencing of clones of the bacterium Serratia marcescens that had undergone experimental evolution in contrasting temperatures to investigate the relationship between environment and genetic, epigenetic, and phenotypic changes. The genomic distribution of GATC motifs, which were the main target for m6A methylation, and of variable m6A epiloci pointed to a potential link between m6A methylation and regulation of gene expression in S. marcescens. Evolved strains, while genetically homogeneous, exhibited many polymorphic m6A epiloci. There was no strong support for a genetic control of methylation changes in our experiment, and no clear evidence of parallel environmentally induced or environmentally selected methylation changes at specific epiloci was found. Both genetic and epigenetic variants were associated with some phenotypic traits. Overall, our results suggest that both genetic and adenine methylation changes have the potential to contribute to phenotypic adaptation in S. marcescens, but that any environmentally induced epigenetic change occurring in our experiment would probably have been quite labile.
Introduction
While the traditional view of evolution is that adaptation proceeds via changes in DNA sequences, any heritable phenotypic variation can in principle be subject to natural selection. In recent years, some epigenetic changes, such as DNA methylation changes, have been found to be heritable and could thus theoretically play a role in evolution [Citation1–5]. However, even if convincing cases of epigenetic inheritance have been documented [Citation6], the role of epigenetic variation in evolution has been met with some scepticism [Citation7], the main argument for caution being that despite frequent observations we know very little about the relative contributions of genetic and epigenetic variation to adaptation. Addressing this question requires the simultaneous characterization of genetic, epigenetic and phenotypic changes in a population, which remains extremely challenging in a natural system, and so far empirical results have lagged behind theoretical models. Experimental evolution under controlled laboratory conditions with bacteria that have short generation times and large population sizes provides the opportunity to study this question in a practical way.
Non-genetic inheritance encompasses various mechanisms, such as structural inheritance via propagating templates (e.g., prions), self-sustaining regulation loops and DNA methylation [Citation4]. DNA methylation is particularly well studied and exists both in eukaryotes and in prokaryotes. While DNA methylation can have phenotypic effects in both of those taxonomic groups, important differences exist between them. In eukaryotes, C5-methylcytosine (m5C) is the best known modification and occurs in CpG-rich regions. Genome methylation patterns are maintained after DNA replication via maintenance methyltransferases but DNA methylation can be reset in the germ line. In prokaryotes, N4-methylcytosine (m4C) and N6-methyladenine (m6A) are known in addition to m5C [Citation8,Citation9]. Methylation is lost on the newly synthetized DNA strand during replication, and methylation restoration depends on the activity of sequence-specific methyltransferases after passage of the replication fork. Interestingly, recent evidence suggests that m6A can also occur in some eukaryotic species [Citation10–12] but the true abundance of m6A in eukaryotes remains controversial [Citation13,Citation14].
DNA methylation systems in prokaryotes are very diverse and include restriction-modification (RM) systems and orphan methyltransferases (MTases). RM systems associate an MTase activity and a complementary endonuclease activity: methylation of the target sequence protects DNA from restriction. Orphan MTases do not have an associated restriction enzyme but are thought to be evolutionary derived from RM systems. DNA methylation in bacteria has a wide range of well-documented roles: protection against foreign DNA via RM systems, regulation of DNA replication and mismatch repair based on hemimethylated DNA, control of mobile elements and regulation of gene expression [Citation8,Citation15]. Crucially, DNA methylation patterns can be inherited in prokaryotes: orphan MTases can compete with other regulatory proteins for access to cognate DNA sequences, for example in promoter and regulatory regions, resulting in self-regulating loops that can be maintained across cell division [Citation16,Citation17].
We used Serratia marcescens as a bacterial model in evolution experiments and characterized genetic, epigenetic and phenotypic differences between strains evolved from a common ancestor culture. S. marcescens is an opportunistic pathogen which can live in a variety of environments, including inside insect and mammalian hosts, with an optimal growth temperature close to 31°C [Citation18–20]. S. marcescens possesses a Dam MTase targeting adenines in -GATC-
motifs, and it has been shown that this enzyme is important to enable the mismatch repair machinery to distinguish between the original and the new DNA strand during replication [Citation21,Citation22].
While examples of inherited epigenetic changes and their involvement in bacterial adaptation exist [Citation23,Citation24], we do not fully understand yet the relative importance of epigenetic and genetic variation in evolution. Here, we studied the role of epigenetics in evolution in a prokaryotic system by (1) characterizing the epigenetic variation related to m6A in Serratia marcescens after evolution in different conditions, (2) determining if the observed epigenetic variation was associated with specific environmental conditions and (3) comparing the potential contributions of epigenetic and genetic variation to phenotypic variation.
We addressed these questions by phenotyping and single-molecule real-time (SMRT) sequencing of bacterial strains from an evolution experiment conducted at three contrasting thermal regimes: 31°C constant, 38°C constant, and 24–38°C fluctuating environments [Citation20]. By introducing a common garden step before phenotypic measurements and DNA sequencing, we focused on the identification of evolutionary differences in methylation patterns which would be stable enough to be propagated across several generations after their establishment once selection pressure was relieved, and we ignored epigenetic mutations with fast back-mutation rates which would be more akin to phenotypic plasticity. Additionally, to investigate the mechanism by which adenine methylation could affect cell processes in S. marcescens, we examined if the genomic distribution of the GATC cognate motif exhibited any informative pattern.
Materials and methods
Experimental evolution and phenotypic measurements
We used bacterial strains that were obtained from a previous evolution experiment [Citation20]. To summarize this experiment briefly, we let replicate populations of Serratia marcescens initiated from a single common ancestor colony evolve under either constant or fluctuating temperatures during three weeks [Citation20] (Supplementary Figure S1). Temperature treatments were constant 31°C (10 populations), constant 38°C (8 populations) or alternating daily between 24°C and 38°C (10 populations). Note that lines evolved in 38°C were not reported in Citation20. The experiment lasted approximately 70 generations (based on daily subcultures for 3 weeks). Given that population sizes were of the order of
cells in each 400 µL culture well at plateau, and that the fraction transferred to the next generation was
of the previous culture, the effective population size is estimated to be
during the experiment (using
from Citation25, where
is the bottleneck size and
is the number of generations between transfers). After experimental evolution, individual colonies were isolated from each population by serial dilution and plating and stored at −80°C in 50% glycerol.
We randomly selected one frozen clone from each population for sequencing (10 independent clones from the 31°C treatment, 8 from the 38°C treatment and 10 from the fluctuating treatment, i.e., 28 evolved strains sequenced in total). As a reference and since the frozen stocks for the common ancestor itself could not be revived successfully prior to sequencing, we also sequenced the stock strain from ATCC (ATCC 13880) from which the common ancestor colony was derived (Supplementary Figure S1). This strain is referred to as the ‘reference strain’ in the rest of this manuscript. We used the phenotypic data from Citation20, (Supplementary Figure S2), which included measurements of growth rate and yield at constant 24°C, 31°C and 38°C for the evolved strains. In addition, growth rate and yield had been measured in a series of novel environments: under redox balance stress (1 mg/ml dithiotreitol), in the presence of the ciliate predator Tetrahymena thermophila and in the presence of a virus, the lytic bacteriophage PPV. For further details on these phenotypic measurements, see Citation20.
Sequencing and genome annotation
Sequencing We used single molecule real-time sequencing (SMRT) with the PacBio platform to sequence the evolved strains and the reference strain. Since no template amplification takes place prior to sequencing on a PacBio platform in order to detect base modifications, relatively large amounts of DNA per strain are necessary with this method. Evolved strains were thawed and grown overnight in 150 ml of liquid medium and DNA was extracted using the Wizard Genomic DNA Purification Kit from Promega (WI, USA). One DNA sample (20 to 60 µg) per strain was sequenced by the DNA Sequencing and Genomics Laboratory of the University of Helsinki on a PacBio RS II sequencing platform using P6-C4 chemistry. Two single-molecule real-time sequencing (SMRT) cells were run per DNA sample.
PacBio software and recommended protocols were used with default parameters for the assembly and modification calling pipeline. For each strain, reads from the RS II instrument were assembled with PacBio RS_HGAP_Assembly.3, as implemented in SMRTportal 2.3.0. The resulting assembly for each strain was processed with the Gap4 program to generate de novo a first draft sequence for this strain and to circularize it. PacBio RS_Resequencing.1 protocol was then run 2 to 3 times for each sample to map the reads to the draft sequence and generate a consensus sequence for each strain. The average coverage of the draft chromosome per strain was high (from 102 to 413, average 268 across all strains). We used Samtools (version 1.7, Citation26) to examine PacBio reads mapped back to their respective assemblies in order to check for evidence of polymorphism within each sequenced strain. Such polymorphism would indicate that a given strain would be comprised of several genetic clones, which is possible if an isolated colony grew from more than a single isolated cell. Based on the Samtools pileup files, the distribution of proportions of mismatches for each position within a strain was compatible with the expected base error rate for PacBio SMRT sequencing (about 11–15%, Citation27), except for a short ca. 700 bp region comprised of repeated sequences and which was ignored in downstream analyses. Given the high coverage of the chromosome sequences across all strains, the base calling was considered accurate outside of this repeat region and genetic variants were directly called from an alignment of the 29 assembled chromosomes built with Mugsy [Citation28].
Estimation of methylated fractions Inter-pulse duration (IPD) ratios were used with the PacBio RS_Modification and Motif_Analysis protocol to detect modified bases and identify methylation sequence motifs. Methylated adenines (m6A) are the modified bases with the strongest kinetic signal [Citation29] and we only analysed those modifications in downstream analyses. Before downstream analysis, we applied a quality value threshold of 20 (i.e., -value
0.01) for the event detection score, which is a Phred-like quality score defined as
. For the detected events, a second quality score is available for modification identification (m6A or other modification type). Since the identification quality score depends on the methylated fraction (lower fractions yielding lower scores), we accepted identifications as m6A for a given position in all strains if the identification quality score at that position was
20 in at least one strain. We did this to avoid being over-conservative and underestimating the methylated fractions for positions which were likely to be truly methylated but with a low methylation fraction in some strains. We checked that the ability to estimate low methylation fractions for m6A was not substantially impaired in strains with the lowest coverages by examining the relationship between coverage and m6A fraction in GATC motifs (Supplementary Figures S3 and S4).
Genome annotation We used the NBCI Prokaryotic Genome Annotation Pipeline (PGAP, Citation30, version 2020–09-24.build4894) to annotate the assembled genome of our reference strain. The location of the origin of replication was determined using the DoriC server [Citation31]. The CDS predicted by PGAP were assembled into operons using the Operon Mapper server (http://biocomputo.ibt.unam.mx/operon_mapper/, Citation32, run on 2020–12-07). Gene ontology annotations for the CDS predicted by PGAP were pooled from two approaches: (i) submitting the predicted CDS to Interproscan (Citation33, version 5.48–83.0) and (ii) running a tblastn search of the predicted CDS against all UniProtKB entries related to Serratia marcescens (UniProtKB database searched via https://www.uniprot.org/ on 2019–01-31) and keeping the hits with the highest bit scores.
Identification of putative methyltransferase genes To identify putative MTase genes in our reference strain, we downloaded the nucleotide sequences of all the entries available for the Serratia genus in the REBASE database [Citation34] (http://rebase.neb.com/rebase/rebase.html accessed on 2020–03-07; the database contained three methyltransferases in particular for S. marcescens ATCC 13880) and performed a local nucleotide-to-nucleotide blast search of those sequences against the assembled genome of our reference strain. In order to identify putative MTases missing from the REBASE database, we also downloaded all the protein entries from the NCBI Identical Protein Groups (IPG) database using the search terms ‘DNA adenine methyltransferase’ and restricting the search to the ‘bacteria’ taxon (https://www.ncbi.nlm.nih.gov/ipg/ accessed on 2020–03-11). Those protein sequences were then matched against our reference strain genome using a local protein-to-translated nucleotide blast search. The IPG database was accessed programmatically using the rentrez R package [Citation35].
Calculation of tetramer composition bias along the genome
In order to test if the main target sequence identified for adenine methylation (-GATC-
) was under differential selection depending on the genomic context, we calculated the tetramer composition bias in two sets of chromosome segments: coding sequences (CDS) and promoter regions (defined as 200-bp-long regions immediately upstream of an operon-leading CDS). Sequences for CDS were taken from their (+) strand, and sequences for promoters were taken from the strand corresponding to the (+) strand of the downstream CDS. For each of the 256 possible tetramers, we counted the total number of occurrences observed in those sets,
, separately for CDS and for promoter sets. We compared those observed values with the expected number of occurrences based on two models: a zero-order model based on the frequencies of each nucleotide (A, T, G, C) in each segment and assuming that tetramers were generated from a random combination of those, and a Markov chain model taking into account the underlying biases that might exist in the frequencies of dimers and trimers comprising each tetramer in a given segment. In the zero-order model, the expected number of occurrences of a given tetramer in a sequence segment
is [Citation36]:
where ,
,
and
are the observed frequencies of each nucleotide in the segment,
,
,
and
are the count of each nucleotide in the considered tetramer (between 0 and 4), and
is the segment length. In the Markov chain approach, the expected number of occurrences of a given tetramer of composition
in a sequence segment
is [Citation36,Citation37]:
where ,
and
are the numbers of occurrences of the trimers
,
and of the dimer
in segment
, respectively. For the CDS and promoter sets separately, we calculated the expected total number of occurrences as the sum of expected numbers for each segment
:
and
. Deviations in the usage of each tetramer from expectation were then calculated as:
for the zero-order and the Markov chain models, respectively.
Identification of partially methylated m6A epiloci in GATC motifs
GATC motifs targetted by Dam are usually methylated on both strands (i.e., both m6A epiloci associated with a given GATC locus are methylated), but hemimethylated or non-methylated GATC loci can be inheritable features important for the regulation of various cellular processes [Citation8,Citation16]. To identify GATC loci which were only partially methylated in our dataset (i.e., present as hemimethylated or non-methylated GATC in at least some bacteria from a sequenced sample), we considered the estimated methylated fractions of adenines separately for the plus and the minus strands at each GATC locus to identify variable m6A epiloci (i.e., m6A epiloci which were not consistently fully methylated in all sequenced strains). In any given strain, GATC-related m6A epiloci for which no methylated fraction was reported by the PacBio pipeline (event detection score 20) were assigned a value of 0 for that strain (i.e., non-methylated adenine). Additionally, epiloci for which the modification identity score was
20 in all strains were also considered not to be methylated as m6A. Assuming that the distribution of modified fractions on the plus and minus strands for fully methylated GATC loci would follow a truncated bivariate distribution centred around (1, 1) (i.e., both strands fully methylated), we defined the set of partially methylated GATC loci of interest for downstream analyses as the GATC loci which presented modified fractions on the plus or on the minus strand which deviated from the point of full methylation at coordinates (1, 1) by more than four times the average observed quadratic distance to (1, 1), in at least one strain (Supplementary Figure S5). We checked that low estimated values of methylated fractions were not a sequencing artefact due to low coverage of the corresponding GATC loci by examining the relationship between coverage and estimated methylated fraction (Supplementary Figures S3 and S4). We tested for association between genetic variants and methylated fractions of variable m6A epiloci using Wilcoxon rank-sum tests. For each genetic variant present in more than two sequenced genomes, we ran Wilcoxon tests against all variable m6A epiloci and applied a Benjamini–Hochberg false discovery rate (FDR) correction [Citation38] to the p-values of those tests.
Effect of evolutionary treatments on genetic and epigenetic changes
To test for an association between evolutionary treatments and genetic variants, we ran Fisher’s exact tests on the contingency tables relating genotypes and evolutionary treatments, for each genetic variant or linked variants (haplotypes) and for pooled variants (as defined in ), with a Benjamini–Hochberg FDR correction to the p-values of those tests.
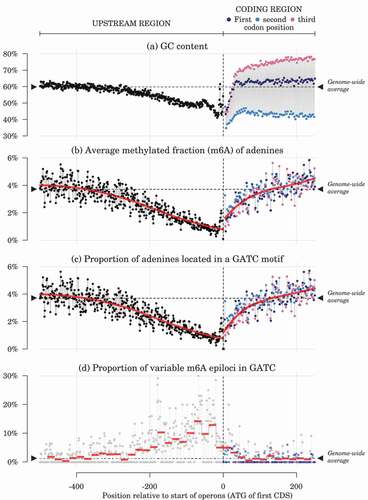
Figure 1. Profiles of nucleotide composition and adenine methylation around the start positions of operon-leading CDS. Red lines: LOESS regression (in (b) and (c), span ) and binned values (in (d), width
). Data points are averaged over each position relative to the leading CDS initiation codon, based on the 2686 operons predicted in the reference genome. Horizontal dashed lines and black triangles show genome-wide average values. Values for the three first bases on the coding sequences (usually ATG) are dropped from the plot to keep the y-scale reasonably narrow.
To determine if some adenine methylation changes had been selected by the evolutionary treatments and were stable enough to persist after several generations in common garden conditions, we tested for association between evolutionary treatments and methylated fractions of variable m6A epiloci with a methylated fraction range over the sequenced clones using Kruskal–Wallis rank sum tests with Benjamini–Hochberg FDR correction. In addition to those individual tests, and to investigate whether the genes related to m6A epiloci which tended to be associated with evolutionary treatments were consistently related to some biological processes, we performed a gene ontology enrichment analysis. Each variable m6A epiloci was assigned a gene if it was contained in its CDS or, alternatively, if it was located less than 500 bp upstream of it. A gene assigned to an m6A epiloci was assigned this epiloci’s Kruskal–Wallis test’s uncorrected p-value. Genes assigned to more than one m6A epiloci were assigned their lowest p-values. The GO enrichment analysis was performed using the topGO R package [Citation39]. The reference list of genes comprised all the genes assigned a Kruskal–Wallis test’s p-value as described above, and the subset of interest was the genes which had an uncorrected p-value
. GO enrichment tests were performed using Fisher’s exact test and the ‘weight01’ algorithm [Citation39,Citation40].
Association between phenotypes and genetic and epigenetic data
We explored the association between genetic variants present in at least two sequenced genomes and phenotypic traits using Wilcoxon rank sum tests with FDR correction. We investigated the association between methylated fraction of the variable m6A epiloci and phenotypic traits using Spearman’s . We analysed only variable m6A epiloci with a methylated fraction range
and we assigned each epiloci its overlapping gene or, alternatively, the closest downstream gene within 500 bp (if any).
Results
Genome sequences and genetic variants
The reference strain chromosome was 5,117,300 bp long, with a GC content of 59.8%. The genome annotation by NCBI’s PGAP predicted 4795 CDS, organised in 2686 operons according to Operon Mapper. Fifty-two mutations were identified from the aligned genomes of the reference and evolved strains, of which 35 were located inside coding regions and 32 were non-synonymous ( and Supplementary Figure S6). Some mutations always occurred together in the sequenced strains: we use the term ‘haplotype’ to refer to a set of linked mutations in our dataset (). Almost all identified haplotypes were strain-specific mutations. However, a striking feature of the variant map is the presence of 11 genetic mutations associated into a single haplotype, for which the minor allele is observed in 5 of the evolved strains from 38°C and in the reference genome but in no other evolved strain (haplotype in ). This suggests that the ancestor colony used to initiate the replicated populations in the evolution experiment, and which was itself derived from the reference strain sequenced here, actually contained at least two lineages which were preserved in some populations at 38°C but in no other evolutionary treatments. Even excluding variants from haplotype
, multiple parallel substitutions were observed among the evolved strains (Figure S6). Some genes exhibited several independent mutations in different strains: two independent mutations occurred in a deacetylase, three in a galactokinase and four in a glycosyltransferase ().
Table 1. Summary of the genetic variants observed in the sequenced strains. Haplotype: letters denote groups of mutations for which alleles are associated together. Freq.: minor allele frequency among the 28 evolved strains. An asterisk denotes loci for which the reference strain carries the minor allele. Distribution of mutations per strains is shown in Supplementary Figure S6.
Adenine methylation landscape in Serratia marcescens
Methylated bases and methylation motifs
Out of 2,057,542 adenine bases present in the bacterial chromosome, 81,434 (4.0%) were detected as m6A (identification quality score 20 in at least one of the evolved strains or in the reference strain). Most of those m6A were in GATC motifs: out of the 81,434 positions detected as m6A, 76,228 (93.6%) were in a GATC context. Since a total of 76,300 adenines belong to a GATC context in the genome, this corresponds to a very high rate of adenine methylation in GATC motifs: 99.9% of GATC adenines are detected as m6A in at least one evolved strain or the reference strain and 99.7% were detected in all sequenced genomes. When detected as modified, m6A bases had an average methylated fraction of 70.3% (s.d. 28.3%) outside GATC motifs and of 97.5% (s.d. 5.0%) inside GATC motifs. We did not find any evidence of a problematic coverage effect on the ability to estimate low methylated fraction for m6A (Supplementary Figures S3 and S4).
The PacBio pipeline identified two sets of motifs for adenine methylation (). One motif set for m6A was the GATC palindrome mentioned above, and the other was the much rarer pair AAAGNNNNNNTCG/TTTCNNNNNNAGC. For both sets, almost all genomic occurrences ( 99%) were detected as modified. Three candidate genes for adenine MTases were identified using REBASE, and no additional candidates were identified using NCBI’s IPG. The first candidate was identified as M.Sma13880ORF442P, of unknown recognition sequence in REBASE, and was very similar to M.Sma36365I (97% amino-acid identity), which is annotated as a type I MTase modifying the motif set AAGNNNNNGTTC/TTCNNNNNCAAG in REBASE. It was located close to a restriction endonuclease in our reference strain genome and is likely to be part of a restriction-modification system. The second candidate was identified as the orphan MTase M.Sma-13880DamP, which targets GATC motifs. This MTase is the protein which was identified as the Dam enzyme in Serratia marcescens by Citation22, (99% amino-acid identity with their sequence (UniProt P45454) and 72% amino-acid identity with E. coli Dam (UniProt P0AEE8)). Finally, the third candidate was identified as M.Sma13880ORF3839P, a type II MTase also targetting GATC, and was located inside a predicted prophage on our reference strain chromosome (46% amino-acid identity with E. coli Dam).
Table 2. Cognate sequence motifs for m6A modification. Methylated positions are underlined. Percentages of occurrences detected as methylated to some extent (i.e., for which the estimated methylated fraction was ) are averaged across the 29 sequenced samples. Methylated fractions (when methylated) are averaged first within each sequenced sample across its sites methylated to some extent and secondly across the 29 sequenced samples.
Genomic methylation profiles
We investigated m6A methylation profiles around the boundary between the first CDS of each predicted operon and the immediate upstream regions, which are likely to contain regulatory and promoter regions (). From a base-composition perspective, upstream regions have lower GC content than coding regions, which can be related to constraints on DNA curvature or double helix stability in promoter regions [Citation41] (). The average methylation of adenines into m6A bases was clearly lowered in upstream regions, in particular within 200 bp of the translation start sites, and reached background level again after a few tens of bp once in the operon coding regions (). This mostly mirrored the pattern observed for the proportion of adenines located in GATC motifs ().
GATC usage bias in Serratia marcescens genome
Oligonucleotide usage bias in prokaryotic genomes exists as a result of evolutionary constraints, such as codon usage bias and palindrome avoidance [Citation37]. To investigate if any such evolutionary constraint dictated the distribution of the main S. marcescens adenine methyltransferase cognate motif in promoter regions, we searched for evidence of differential usage bias of the -GATC-
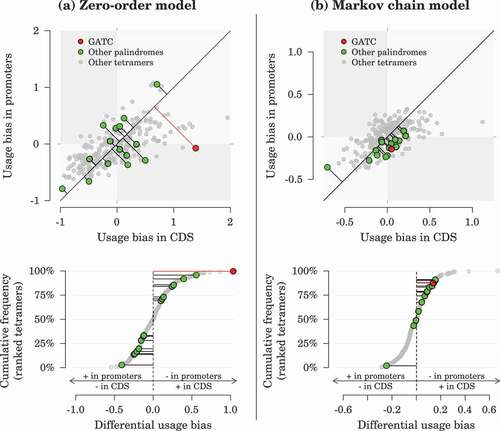
tetramer between coding sequences (CDS) and promoters, defined here as 200-bp long regions upstream of operon-leading CDS. In practice, we compared the usage bias of GATC with the usage bias of all other nucleotide tetramers (). The usage bias for a tetramer in a given genomic region is positive if the tetramer is more abundant than expected by chance and negative if it is rarer. Overall, the range of tetramer usage bias in CDS and promoters was larger when measured from a zero-order approach (deviation ranging from −0.97 to +1.95) than from a Markov chain approach (−0.71 to +1.12). The correlation between values obtained from the two approaches was moderate (Spearman’s
= 0.20), indicating that tetramer usage biases are strongly related to biases in dimers and trimers usage which are taken into account by the Markov chain approach but not by the zero-order approach. Most of the variation in tetramer usage bias was positively correlated between CDS and promoters (Spearman’s
= 0.58 for Markov chain estimates), but some tetramers exhibited large differences between their in-CDS and in-promoter usage biases (). Remarkably,
-GATC-
showed one of the largest distortions in usage bias between CDS and promoter regions among all tetramers, in both approaches. The
-GATC-
tetramer was rarer in promoters and more frequent in CDS than expected by chance, even when taking into account underlying biases in dimer and trimer usage ().
Figure 2. Tetramer usage bias in coding sequences (CDS) and promoters. (a) Bias calculation based on observed single-nucleotide frequencies (zero-order approach). (b) Bias calculation taking into account the observed frequencies of dimers and trimers (Markov chain approach). In the upper panels, the distance between a data point and its projection on the identity line measures how imbalanced the usage biases between CDS and promoters are (i.e., the differential usage bias). In the lower panels, those differential usage biases are sorted across all tetramers.
Identification of variable m6A epiloci
Unmethylated GATC loci seem to be rare in the genome of bacteria species possessing an adenine MTase targetting this motif [Citation21]. Unmethylated and hemimethylated GATC loci can be involved in the regulation of DNA replication and of DNA–protein interactions and their methylation status can potentially be transmitted to the next generation [Citation8,Citation16]. Here, most adenines in GATC motifs were observed close to full methylation, but we identified 892 partially methylated adenines in GATC motifs (1.2% of all adenines in GATC motifs), indicating that those GATC motifs were hemimethylated or non-methylated in at least some of the bacteria within a given sample. Those 892 adenines were located in 451 distinct GATC palindromes. We considered those sites as the m6A epiloci of interest and used them for downstream analyses of association with genetic and phenotypic data. Taking into account the genomic distribution of all GATC motifs, variable m6A sites were more frequent than expected in promoter regions (,
,
) and rarer than expected in operons (
,
,
), as is visible in . Finally, very little evidence of association between genetics and epigenetics was found in this experiment: based on FDR-corrected Wilcoxon rank-sum tests, associations with p-values
0.05 were only observed between haplotype
and five epiloci.
Effect of evolutionary treatments on genetic and epigenetic changes
Before FDR correction, only haplotype (
), pooled variants for glycosyltransferase (
) and for galactokinase (
) and variant 11 (
) were tentatively associated with evolutionary treatments (p-values
0.05). After FDR correction, only haplotype
(
) remained significantly associated with evolutionary treatments, being only observed in evolved strains from the 38°C treatment and in the reference strain ( and Supplementary Figure S6).
Concerning the association between evolutionary treatments and variable m6A epiloci, no association was significant at the level after FDR correction. We examined if some gene ontology terms were significantly enriched in the genes which were the closest to the m6A epiloci which were tentatively associated with evolutionary treatments (uncorrected p-value for association
). Using Fisher’s exact test and the ‘weight01’ algorithm [Citation39,Citation40], five biological process (BP) categories were enriched in this set of genes (topGO’s
): ‘cellular response to stress,’ ‘lipopolysaccharide biosynthetic process,’ ‘negative regulation of cellular process,’ ‘L-amino acid transport’ and ‘cellular component biogenesis.’
Association between phenotypes and genotypes
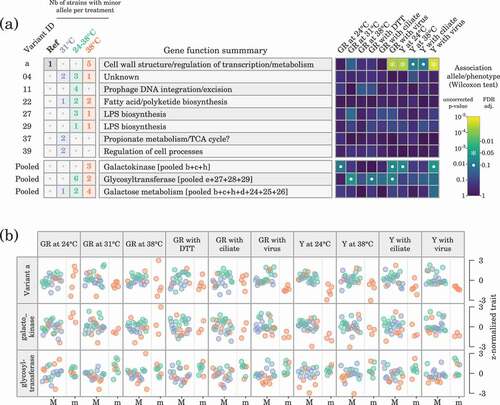
We explored the association between genetic variants present in at least two sequenced genomes and phenotypic traits using Wilcoxon rank sum tests with FDR correction (). All phenotypic data were from Citation20, and comprised growth performance traits under several temperatures and under a series of novel stressors (redox stress, ciliate predator, lytic phage). The only genetic variants associated with phenotypic traits at the level were those comprising haplotype
, which were associated with growth rate and yield in the presence of a virus and yield at 24°C. Those trait values decreased in the presence of the minor allele (). Pooled variants for a galactokinase and a glycosyltransferase were tentatively associated with some traits (
): for example, the minor alleles related to the glycosyltransferase were potentially associated with higher growth rate at 31°C, in the presence of DTT or in the presence of a virus.
Figure 3. Association between genetic variants observed in at least two sequenced genomes and phenotypes. (a) Distributions of variants across evolutionary treatments and association between alleles and phenotypic traits (GR, growth rate; Y, yield). ‘Pooled’ variants are variants affecting the same enzyme or function. (b) Detailed illustration of the association between major (M) and minor (m) alleles and phenotypes for variant and for the ‘pooled’ variants related to the galactokinase and to the glycosyltransferase. Data point colours correspond to the evolutionary treatment of each strain.
Association between phenotypes and variable epiloci
We examined the association between methylated fraction of the variable m6A epiloci and phenotypic traits using Spearman’s and assigning the m6A epiloci to the closest genes (). Forty genes were assigned a variable m6A epilocus tentatively associated with at least one trait, using an uncorrected p-value threshold of 0.005 for Spearman’s correlation. We did not apply FDR correction in this analysis as the large number of tests (10 traits
892 variable m6A epiloci
8920 tests) and the limited statistical power due to the small sample size for each test (28 evolved strains) resulted in all FDR-adjusted p-values to be
, even when uncorrected p-values were
. However, we used permutation tests to check how often 40 genes (or more) would emerge from a similar analysis performed on randomized datasets. This happened in only 8% of datasets when methylated fractions were randomized independently for each trait, or in 14% of datasets when strain labels were randomized once per permutation (to maintain the correlation structure of phenotypic traits). This suggests that our gene selection approach, while liberal, was likely to capture genes genuinely involved in phenotypic-epigenetic associations.
Figure 4. Association between adenine methylation and phenotypes. The heatmap shows Spearman’s correlation between methylated fractions of variable m6A epiloci (rows) and phenotypes (columns; GR, growth rate; Y, yield) for variable m6A epiloci exhibiting a methylation fraction range 0.2 across sequenced samples and an uncorrected p-value
0.005 for Spearman’s
with at least one trait. Overlapping or closest (
500 bp) downstream genes are assigned to each epiloci. Gene functions are based on manual literature search for each gene product. Examples of relationships between m6A methylated fractions and phenotypes are given for the heatmap cells annotated with a letter.
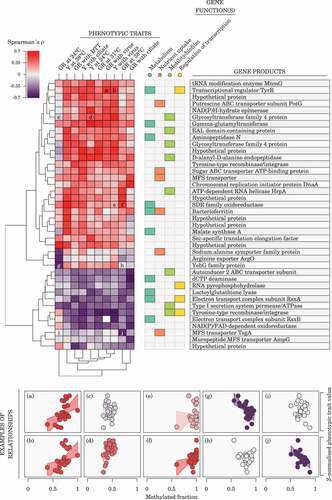
Gene ontology enrichment tests on a trait-by-trait basis using topGO revealed only very broad functional categories for genes associated with a given trait, such as metabolism, molecule transport, regulation of cellular processes, cell communication and response to chemical stimulus (Supplementary Table S1). Since enrichment tests on the permuted datasets showed that our approach was likely to find a small number of significantly enriched terms even from randomized datasets, we used the GO enrichment results only as a general guide to select four broad functional categories (metabolism, nutrient uptake, cell motility/biofilm formation, and regulation of transcription) and subsequently performed a literature search for each of those 40 genes of interest which indicated that most of those genes were related to at least one such category ().
Discussion
We have shown that substantial variation in adenine methylation existed in Serratia marcescens strains after experimental evolution followed by common garden conditions, and that GATC motifs and variable m6A epiloci were not randomly distributed along the genome. Sequenced evolved strains were genetically clonal (i.e., no intra-strain genetic polymorphism was observed) but they exhibited polymorphism in a small fraction of their m6A epiloci. In addition to de novo mutations, genetic variants were dominated by 11 linked loci (haplotype ) which were only observed in strains evolving at 38°C and suggested the existence of some degree of genetic polymorphism in the ancestor strain and differential selection between temperature treatments during the experiment. No clear effect of evolutionary treatments on specific m6A epiloci was found, suggesting that parallel environmentally induced or environmentally selected changes on particular epiloci were rare or labile in our experiment. Both genetic and epigenetic data were associated with some phenotypic traits to some extent. Surprisingly, the involved genes were not related to temperature response in particular but rather related to metabolism, nutrient uptake, motility/biofilm/adhesiveness and cell wall structure.
Methylation landscape in S. marcescens
E. coli and several other Gammaproteobacteria possess a Dam enzyme responsible for m6A methylation of GATC motifs [Citation42,Citation43], and GATC adenine methylation in those species is involved in important functions such as protection against foreign DNA, timing of DNA replication and regulation of gene expression [Citation42]. S. marcescens is known to also harbour a Dam enzyme targetting GATC motifs [Citation22]. The detailed S. marcescens adenine methylation data we collected in our experiment allowed us to identify two cognate motifs in this species, including GATC as expected. We identified candidate adenine MTases targetting those motifs, including the dam gene identified experimentally by Citation22 and an orphan MTase located in a prophage region and for which gene expression data would be needed to determine whether it is actually expressed or not. About 4% of the observed m6A positions were outside the identified cognate motifs, which suggests either off-target methylation by specific MTases [Citation44], the existence of an unspecific DNA adenine MTase [Citation45], or that some of those detected methylation events could possibly be false positives [Citation46].
Dam activity in S. marcescens has been shown to play a role in mutation avoidance by keeping track of the reference strand during post-replication mismatch repair [Citation22]. Here, several lines of evidence based on the genomic distribution of GATC motifs and of the variable m6A epiloci indicate that GATC methylation in S. marcescens could be involved in other cell functions than solely help in mismatch repair, such as gene expression regulation. First, average adenine methylation was lower in regulatory and promoter regions than in the rest of the genome (), which was primarily due to the lower frequency of GATC motifs in those regions (). Second, this unbalanced distribution of GATC motifs was not fully accounted for by the underlying distributions of constituting di- and trinucleotides: the Markov chain model showed that GATC were rarer than expected in promoters but more frequent in CDS, suggesting that evolutionary constraints on the GATC motif differ between those genomic regions (). Finally, sites with variable methylation were not randomly distributed among the GATC sites but were more frequent in promoters and rarer in coding regions (). Those observations are consistent with previous results in E. coli, where GATC motifs are also more frequent in coding rather than non-coding regions [Citation47] and GATC located in upstream regions of CDS are more frequently under-methylated [Citation48]. In E. coli, GATC methylation in gene regulatory regions is responsible for phase variation [Citation49] (but not all methylation in regulatory regions leads to regulation of gene expression – see, for example, Citation50). Citation51 suggested that GATC in upstream regions could modulate gene expression by interacting with some regulatory proteins, while Citation52 argued that expression could be regulated by clusters of GATC situated inside the coding regions and affecting DNA stability based on their methylation status. Overall, numerous studies have demonstrated that some genes are regulated by methylated GATC motifs located in their promoter or in nearby regulatory regions rather than in coding region (e.g., traJ gene [Citation53], gtr operons [Citation54], opvAB operon [Citation55], std operon [Citation56]), even if microarray studies involving dam mutants suggest that GATC methylation does not regulate gene expression at a global level in the cells [Citation57].
Effect of evolutionary treatments on adenine methylation
The origin of epigenetic variation and its stability are two fundamental evolutionary questions. Changes in methylation at a genomic locus can be either genetically determined, spontaneous, or environmentally induced. In eukaryotic systems, for example, most methylation changes observed in natural plant populations generally seem to be under genetic control [Citation58,Citation59] but only a small proportion of methylation changes were under genetic control during the experimental evolution of Chlamydomonas algae [Citation60]. In eukaryotes again, both spontaneous epigenetic changes [Citation61] or environmentally induced changes [Citation62,Citation63] have also been observed. In prokaryotes, even though the mechanisms involved in methylation processes are markedly different from the eukaryotic ones, those three types of methylation changes are also possible: genetically determined changes (e.g., mutations affecting the MTase enzyme itself or mutations in MTase target sites or in their flanking regions; Citation64), spontaneous (stochastic competition between MTase and DNA binding protein heritable via self-regulating loops), and environmentally induced (when other DNA binding proteins influencing MTase access to DNA are responding to environment, like in the case of the pap operon or the agn43 gene in E. coli; Citation65, Citation66). Importantly, the stability of methylation states in prokaryotes can vary from a regular resetting during DNA replication to bistable epigenetic switches underpinning phase variation. For a given epigenetic switch, OFF-to-ON and ON-to-OFF rates can differ, allowing for some relative stability after a switching event (e.g., agn43 gene in E. coli, Citation67; opvAB operon in Salmonella enterica, Citation68). Epigenetic changes in bacteria can thus be involved in both short-term, partially heritable phenotypic plasticity and in long-term response, possibly allowing for later genetic assimilation. Given our experimental design, our conclusions below apply only to epigenetic changes that can remain stable for several generations rather than to the more labile ones.
We did not find any strong evidence to support a genetic control of adenine methylation in our experiment, as only five m6A epiloci were found associated with haplotype . Furthermore, this association could be due to the shared history of those epiloci with haplotype a prior to the initiation of the evolution experiment (assuming that haplotype a was part of some standing genetic variation in the ancestor culture at the initiation of the experimental populations).
Any consistent methylation pattern associated with multiple clones from a given evolutionary treatment can in principle be due to methylation states induced by a common environment or explained by spontaneous changes that were environmentally selected in multiple populations, thus reflecting parallel evolution. It is also possible that some epiloci have extremely high forward- and back-mutations rates, so that some polymorphism is always present, or that the optimal fitness of a given culture is composed of a mix of subpopulations heterogeneously methylated. We did not observe any variable m6A epiloci whose methylated fraction would be significantly associated with evolutionary treatments, which suggest that no parallel epigenetic changes were either induced nor selected by the evolutionary treatments or that changes would be too labile to persist over a few generations in common garden conditions. Most of the observed epigenetic variation is thus likely to be spontaneous, stochastic fluctuations, for which our experimental design does not allow to determine if they affect the phenotype or are neutral. Highly labile epigenetic fluctuations could possibly reflect some sort of epigenetic bet-hedging mechanism [Citation69]. Our observations do not preclude, however, that environmental conditions could exert selective pressure on stochastic epigenetic variation at different epiloci that would affect a common biological process. Finally, it is also possible that more sensitive and accurate detection methods (e.g., to reliably determine m4C and m5C methylation levels, or with more precise m6A methylation estimates) could reveal epigenetic components of adaptation to temperature that our experimental design could not detect.
Distribution of genetic variants among evolutionary treatments
Most of the genetic variants observed in our experiment were present in single strains and we cannot determine if those variants provide an advantage in a specific evolutionary treatment or in the laboratory conditions in general. The only variant that was statistically associated with a particular treatment was haplotype , which comprised 11 linked loci and was observed only in evolved strains from the 38°C treatment. Haplotype a was also found in the reference strain from which the ancestor used for the evolution experiment was derived. The probability of 11 mutations arising independently and in succession in several strains in our dataset is low given the duration of the evolution experiment. It is thus likely that the ancestor culture used to initiate all the populations of the experiment exhibited some genetic diversity in relation with haplotype
, possibly due to cell aggregation occurring during the preparation of the ancestor colony. No sign of this diversity is observed in the sequenced strains evolved at 31°C and 24–38°C, indicating that haplotype
was driven to low frequencies or extinction in 31°C and 24–38°C conditions.
Interestingly, we observed mutations occurring independently at different positions within several genes and being selected in parallel. This happened independently of haplotype for a galactokinase and for a glycosyltransferase. Given the large effective population size in our experiment (
, see Methods), genetic drift cannot explain the fixation of multiple parallel mutations in independent populations, suggesting instead that selection favoured a modified function for those particular genes. Remarkably, those two genes and the deacetylase gene (with two linked mutations belonging to haplotype
) are all involved in the biosynthesis of lipopolysaccharide (LPS). Mutations in those three genes were observed in the 24–38°C and 38°C treatments, but not in the 31°C treatment, suggesting that the LPS structure might be affected in those treatments. Possible reasons for changes in LPS structure are explored further in a separate study [Citation70].
Effect of genetic and epigenetic variation on phenotypes
Our main objective was to determine the potential contributions of genetics and epigenetics to adaptation in rapidly changing environments. In the original evolution experiment during which the evolved strains were generated, 12 colonies were isolated from each replicate population, thus providing good statistical power to detect an effect of evolutionary treatment on phenotypic traits and enabling to show that strains from the fluctuating 24–38°C treatment outperformed strains that evolved at constant 31°C [Citation20]. In the subset of strains we sequenced here (one isolated colony for each replicate population), phenotypic variability results in overlapping phenotype ranges across treatments (Supplementary Figure S2). Given this overlap, trying to link genetic and epigenetic data directly to phenotypic trait values rather than to evolutionary treatments might give insight into how genetic variants and variable m6A epiloci can influence phenotype. Note that given our experimental design, where evolved clones were isolated and cultured in common garden conditions before phenotypic measurements and DNA extraction, short-lived epigenetic changes involved in rapid phenotypic plasticity would be lost and only more persistent changes, stable over several generations and more amenable to playing a role in evolution, would be carried over from the evolution experiment.
Evidence supporting a potential effect on phenotypes was found both for genetic variants and for variable m6A epiloci. Given that most genetic variants were present in only one strain, the ability to detect statistically significant associations was limited, but haplotype was associated with some reduced performance in the strains evolved at 38°C and independent genetic variants associated with galactokinase and glycosyltransferase were tentatively associated with phenotypic changes. From a general biological perspective, those genes and the genes affected by haplotype
are somehow related to cell wall structure, metabolism and regulation of transcription, which are all crucial cell functions likely to be impacted when environmental conditions change, but not to thermal stress in particular, and were associated both with temperature-related traits and with performances in novel environments (exposure to DTT, ciliate or virus). Similarly, variable m6A epiloci which were found to be associated with phenotypes were related to genes involved in important, broad functional categories (metabolism, nutrient uptake, motility and biofilm formation). Metabolism and nutrient uptake are both likely to be crucial in determining growth rate and yield, especially after evolving in a nutrient-limiting medium such as SPL 1%.
Conclusion
We have shown that substantial epigenetic variation existed in adenine methylation in Serratia marcescens, both across and within cultures of evolved strains. The distribution of methylated fractions and of the main adenine MTase cognate motif along the genome pointed to a possible connection between adenine methylation and gene expression regulation, as is the case in other Gammaproteobacteria, but further experiments measuring gene expression would be needed to confirm if that prediction is correct. No clear evidence of a genetic control of epigenetic variation, nor of stable environmentally induced or environmentally selected epigenetic changes were found in our experiment. However, this result does not rule out the existence of labile, short-term epigenetic responses in particular in fluctuating environmental conditions, which could be explored with more massive methylome sequencing of evolved strains grown in their treatment conditions and challenged in new conditions. Genetic variants from unexpected pre-existing standing genetic variation at the beginning of the evolution experiment seemed to be responsible for the majority of divergent phenotypic adaptation between the 38°C treatment and the others, but indications of both genetic and epigenetic effects on some of the phenotypic traits observed in our experiment were found.
Authors contributions
TK and IK conceptualized the study. Experimental design for PacBio sequencing was done by TK and MB. DNA extraction for PacBio sequencing was done by RA. MB, IK and TK analyzed the data and wrote the original draft with later review by all co-authors.
Acknowledgments
We acknowledge the Academy of Finland (Project 278751) and the Centre of Excellence in Biological Interactions for funding and facilities, and the CSC-IT Center for Science for computational resources.
Disclosure statement
The authors declare no competing financial interests.
Data availability
PacBio sequencing data (HDF5 files) were submitted to the European Nucleotide Archive’s Sequence Read Archive (ENA-SRA) (https://www.ebi.ac.uk/ena, project PRJEB40306) and assembled genomes to NCBI’s GenBank (biosamples SAMEA7301478 to SAMEA7301506). Genetic, epigenetic and phenotypic datasets used for analysis are available from the Dryad repository (https://doi.org/10.5061/dryad.g79cnp5qd).
Additional information
Funding
References
- Danchin E, Charmantier A, Champagne FA, et al. Beyond DNA: integrating inclusive inheritance into an extended theory of evolution. Nat Rev Genet. 2011;12(7):475–486.
- Danchin E, Pocheville A, Rey O, et al. Epigenetically facilitated mutational assimilation: epigenetics as a hub within the inclusive evolutionary synthesis. Biol Rev Camb Philos Soc. 2019;94(1):259–282.
- Day T, Bonduriansky R. A unified approach to evolutionary consequences of genetic and nongenetic inheritance. Am Natur. 2011;178(2):E18–E36.
- Jablonka E, Raz G. Transgenerational epigenetic inheritance: prevalence, mechanisms, and implications for the study of heredity and evolution. Q Rev Biol. 2009;84(2):131–176.
- Kronholm I, Collins S. Epigenetic mutations can both help and hinder adaptive evolution. Mol Ecol. 2016;25(8):1856–1868.
- Cortijo S, Wardenaar R, Colomé-Tatché M, et al. Mapping the epigenetic basis of complex traits. Science. 2014;343(6175):1145–1148.
- Charlesworth D, Barton NH, Charlesworth B. The sources of adaptive variation.Proc. R. Soc. B. 2017; 284(1855).
- Casadesús J, Low D. Epigenetic gene regulation in the bacterial world. Microbiol Mol Biol Rev. 2006;70(3):830–856.
- Ratel D, Ravanat JL, Berger F, et al. N6-methyladenine: the other methylated base of DNA. Bioessays. 2006;28(3):309–315.
- Liang Z, Shen L, Cui X, et al. DNA N6-adenine methylation in Arabidopsis thaliana. Dev Cell. 2018;45(3):406–416.
- Wu TP, Wang T, Seetin MG, et al. DNA methylation on N6-adenine in mammalian embryonic stem cells. Nature. 2016;532(7599):329–333.
- Zhang G, Huang H, Liu D, et al. N6-methyladenine DNA modification in Drosophila. Cell. 2015;161(4):893–906.
- Douvlataniotis K, Bensberg M, Lentini A, et al. No evidence for DNA N6-methyladenine in mammals. Sci Adv. 2020;6(12):0eaay3335.
- O’Brown ZK, Boulias K, Wang J, et al. Sources of artifact in measurements of 6mA and 4mC abundance in eukaryotic genomic DNA. BMC Genomics. 2019;20(1):445.
- Sánchez-Romero MA, Cota I, Casadesús J. DNA methylation in bacteria: from the methyl group to the methylome. Curr Opin Microbiol. 2015;25:9–16.
- Braaten BA, Nou X, Kaltenbach LS, et al. Methylation patterns in pap regulatory DNA control pyelonephritis-associated pili phase variation in E. coli. Cell. 1994;76(3):577–588.
- Sánchez-Romero MA, Casadesús J. The bacterial epigenome. Nat Rev Microbiol. 2020;18(1):7–20.
- Flyg C, Kenne K, Boman HG. Insect pathogenic properties of Serratia marcescens: phage-resistant mutants with a decreased resistance to Cecropia immunity and a decreased virulence to Drosophila. J Gen Microbiol. 1980;120(1):173–181.
- Grimont PAD, Grimont F. The genus Serratia. Annu Rev Microbiol. 1978;32(1):221–248.
- Ketola T, Mikonranta L, Zhang J, et al. Fluctuating temperature leads to evolution of thermal generalism and preadaptation to novel environments. Evolution. 2013;67:2936–2944.
- Blow MJ, Clark TA, Daum CG, et al. The epigenomic landscape of prokaryotes. PLOS Genetics. 2016;12(2):e1005854.
- Ostendorf T, Cherepanov P, de Vries J, et al. Characterization of a dam mutant of Serratia marcescens and nucleotide sequence of the dam region. J Bacteriol. 1999;181(13):3880–3885.
- Adam M, Murali B, Glenn NO, et al. Epigenetic inheritance based evolution of antibiotic resistance in bacteria. BMC Evol Biol. 2008;8(1):52.
- Atack JM, Srikhanta YN, Fox KL, et al. A biphasic epigenetic switch controls immunoevasion, virulence and niche adaptation in non-typeable Haemophilus influenzae. Nature Communications. 2015;6:7828.
- Lenski RE, Rose MR, Simpson SC, et al. Long-term experimental evolution in Escherichia coli. I. Adaptation and divergence during 2,000 generations. Am Nat. 1991;138(6):1315–1341.
- Li H, Handsaker B, Wysoker A, et al. The sequence alignment/map format and SAMtools. Bioinformatics 2009;25(16):2078–2079.
- Rhoads A, Au KF. PacBio sequencing and its applications. Genomics Proteomics Bioinformatics. 2015;13(5):0 278–289.
- Angiuoli SV, Salzberg SL. Mugsy: fast multiple alignment of closely related whole genomes. Bioinformatics. 2011;27(3):334–342.
- Clark TA, Murray IA, Morgan RD, et al. Characterization of DNA methyltransferase specificities using single-molecule, real-time DNA sequencing. Nucleic Acids Res. 2012;40(4):e29.
- Tatusova T, DiCuccio M, Badretdin A, et al. NCBI prokaryotic genome annotation pipeline. Nucleic Acids Res. 2016;44(14):6614–6624.
- Gao F, Luo H, Zhang CT. DoriC 5.0: an updated database of oriC regions in both bacterial and archaeal genomes. Nucleic Acids Res. 2013;41(Database issue):D90–D93.
- Taboada B, Estrada K, Ciria R, et al. Operon-mapper: a web server for precise operon identification in bacterial and archaeal genomes. Bioinformatics. 2018;34(23):4118–4120.
- Jones P, Binns D, Chang HY, et al. InterProScan 5: genome-scale protein function classification. Bioinformatics. 2014;30(9):1236–1240.
- Roberts RJ, Vincze T, Posfai J, et al. REBASE—a database for DNA restriction and modification: enzymes, genes and genomes. Nucleic Acids Res. 2015;43(D1): D298–D299.
- Winter DJ. rentrez: an R package for the NCBI eUtils API. The R Journal. 2017;9:520–526.
- Pride DT, Meinersmann RJ, Wassenaar TM, et al. Evolutionary implications of microbial genome tetranucleotide frequency biases. Genome Res. 2003;13(2):145–158.
- Rocha EP, Viari A, Danchin A. Oligonucleotide bias in Bacillus subtilis: general trends and taxonomic comparisons. Nucleic Acids Res. 1998;26(12):2971–2980.
- Benjamini Y, Hochberg Y. Controlling the false discovery rate: a practical and powerful approach to multiple testing. Journal of the Royal Statistical Society: Series B (Methodological). 1995;57(1):289–300.
- Alexa A, Rahnenfuhrer J. topGO: enrichment analysis for gene ontology, 2020. R package version 2.42.0.
- Alexa A, Rahnenführer J, Lengauer T. Improved scoring of functional groups from gene expression data by decorrelating GO graph structure. Bioinformatics. 2006;22(13):1600–1607.
- Bohlin J, Skjerve E, Ussery DW. Investigations of oligonucleotide usage variance within and between prokaryotes. PLoS Comput Biol. 2008;4(4): e1000057.
- Casadesús J. Bacterial DNA methylation and methylomes. Adv Exp Med Biol. 2016;945:35–61.
- Hattman S, Brooks JE, Masurekar M. Sequence specificity of the P1 modification methylase (M.Eco P1) and the DNA methylase (M.Eco dam) controlled by the Escherichia coli dam gene. J Mol Biol. 1978;126(3):367–380.
- Murray IA, Clark TA, Morgan RD, et al. The methylomes of six bacteria. Nucleic Acids Res. 2012;40(22):11450–11462.
- Murray IA, Morgan RD, Luyten Y, et al. The non-specific adenine DNA methyltransferase M.EcoGII. Nucleic Acids Res. 2018;46(2):840–848.
- McIntyre ABR, Alexander N, Grigorev K, et al. Single-molecule sequencing detection of N6-methyladenine in microbial reference materials. Nat Commun. 2019;10(1): 1–11.
- Barras F, Marinus MG. Arrangement of Dam methylation sites (GATC) in the Escherichia coli chromosome. Nucleic Acids Res. 1988;16(20):9821–9838.
- Tavazoie S, Church GM. Quantitative whole-genome analysis of DNA-protein interactions by in vivo methylase protection in E. coli. Nat Biotechnol. 1998;16(6):566–571.
- Blyn LB, Braaten BA, Low DA. Regulation of pap pilin phase variation by a mechanism involving differential dam methylation states. EMBO J. 1990;9(12):4045–4054.
- van der Woude M, Hale WB, Low DA. Formation of DNA methylation patterns: nonmethylated GATC sequences in gut and pap operons. J Bacteriol. 1998;180(22):5913–5920.
- Oshima T, Wada C, Kawagoe Y, et al. Genome-wide analysis of deoxyadenosine methyltransferase-mediated control of gene expression in Escherichia coli. Mol Microbiol. 2002;45(3):673–695.
- Riva A, Delorme MO, Chevalier T, et al. The difficult interpretation of transcriptome data: the case of the GATC regulatory network. Comput Biol Chem. 2004;28(2):109–118.
- Camacho EM, Casadesús J. Regulation of traJ transcription in the Salmonella virulence plasmid by strand-specific DNA adenine hemimethylation. Mol Microbiol. 2005;57(6):1700–1718.https://onlinelibrary.wiley.com/doi/pdf/10.1111/j.1365-2958.2005.04788.x
- Broadbent SE, Davies MR, van der Woude MW. Phase variation controls expression of Salmonella lipopolysaccharide modification genes by a DNA methylation-dependent mechanism. Mol Microbiol. 2010;77(2):337–353.
- Cota I, Bunk B, Spröer C, et al. OxyR-dependent formation of DNA methylation patterns in OpvABOFF and OpvABON cell lineages of Salmonella enterica. Nucleic Acids Res. 2016;44(8):3595–3609.
- García-Pastor L, Sánchez-Romero MA, Jakomin M, et al. Regulation of bistability in the std fimbrial operon of Salmonella enterica by DNA adenine methylation and transcription factors HdfR, StdE and StdF. Nucleic Acids Res. 2019;47(15):7929–7941.
- Adhikari S, Curtis PD. DNA methyltransferases and epigenetic regulation in bacteria. FEMS Microbiol Rev. 2016;40(5):575–591.
- Dubin MJ, Zhang P, Meng D, et al. DNA methylation in Arabidopsis has a genetic basis and shows evidence of local adaptation. eLife. 2015;4:e05255.
- Hagmann J, Becker C, Müller J, et al. Century-scale methylome stability in a recently diverged Arabidopsis thaliana lineage. PLoS Genet. 2015;11(1):e1004920.
- Kronholm I, Bassett A, Baulcombe D, et al. Epigenetic and genetic contributions to adaptation in Chlamydomonas. Mol Biol Evol. 2017;34(9):2285–2306.
- van der Graaf A, Wardenaar R, Neumann DA, et al. Rate, spectrum, and evolutionary dynamics of spontaneous epimutations. Proc Nat Acad Sci. 2015;112(21):6676–6681.
- Jiang C, Mithani A, Belfield EJ, et al. Environmentally responsive genome-wide accumulation of de novo Arabidopsis thaliana mutations and epimutations. Genome Res. 2014;24(11):1821–1829.
- Wibowo A, Becker C, Marconi G, et al. Hyperosmotic stress memory in Arabidopsis is mediated by distinct epigenetically labile sites in the genome and is restricted in the male germline by DNA glycosylase activity. eLife. 2016;5:e13546.
- Coffin SR, Reich NO. Modulation of Escherichia coli DNA methyltransferase activity by biologically derived GATC-flanking sequences. J Biol Chem. 2008;283(29):20106–20116.
- Casadesús J, Low DA. Programmed heterogeneity: epigenetic mechanisms in bacteria. J Biol Chem. 2013;288(20):13929–13935.
- Wallecha A, Munster V, Correnti J, et al. Dam- and OxyR-dependent phase variation of agn43: essential elements and evidence for a new role of DNA methylation. J Bacteriol. 2002;184(12):3338–3347.
- Kaminska R, van der Woude MW. Establishing and maintaining sequestration of Dam target sites for phase variation of agn43 in Escherichia coli. J Bacteriol. 2010;192(7):1937–1945.
- Olivenza DR, Nicoloff H, Sánchez-Romero MA, et al. A portable epigenetic switch for bistable gene expression in bacteria. Sci Rep. 2019;9, 11261.
- Veening JW, Smits WK, Kuipers OP. Bistability, epigenetics, and bet-hedging in bacteria. Annu Rev Microbiol. 2008;62(1):193–210.
- Bruneaux M, Ashrafi R, Kronholm I, et al. Environmentally triggered evolutionary cascade across trophic levels in an experimental phage-bacteria-insect system. BioRxiv. 2019. DOI:10.1101/850248