
ABSTRACT
Hypermethylation of tumour suppressors and other aberrations of DNA methylation in tumours play a significant role in cancer progression. DNA methylation can be affected by various environmental conditions, including hypoxia. The response to hypoxia is mainly achieved through activation of the transcriptional program associated with HIF1A transcription factor. Inactivation of Von Hippel-Lindau Tumour Suppressor gene (VHL) by genetic or epigenetic events, which also induces aberrant activation of HIF1A, is the most common driver event for renal cancer. With whole-genome bisulphite sequencing and LC-MS, we demonstrated that VHL inactivation induced global genome hypermethylation in human kidney cancer cells under normoxic conditions. This effect was reverted by exogenous expression of wild-type VHL. We showed that global genome hypermethylation in VHL mutants can be explained by transcriptional changes in MDH and L2HGDH genes that cause the accumulation of 2-hydroxyglutarate – a metabolite that inhibits DNA demethylation by TET enzymes. Unlike the known cases of DNA hypermethylation in cancer, 2-hydroxyglutarate was accumulated in the cells with the wild-type isocitrate dehydrogenases.
Introduction
VHL inactivation is the most common driver event in renal cancer [Citation1]. VHL is involved in hypoxia sensing, directing polyubiquitination and further degradation of HIF1A transcription factor [Citation2]. Inactivation of VHL leads to the accumulation of HIF1A and activation of the genes involved in the hypoxia response [Citation3,Citation4]. Therefore, mutation-driven VHL inactivation in tumours causes similar transcriptomic changes as those induced by hypoxic environments [Citation3,Citation5,Citation6].
DNA methylation is sensitive to oxidation-reduction potential. Specifically, hypoxia has been shown to impair TET-driven DNA demethylation and decrease the level of hydroxymethylcytosine, the key intermediate of the demethylation process, resulting in DNA hypermethylation [Citation7].
Genome hypermethylation during hypoxia produces a wide variety of physiological and molecular consequences. Сhanges in DNA methylation contribute to pathologies caused by chronic intermittent hypoxia in people living at sea level and potentially mediate adaptations to chronic sustained hypoxia by affecting the hypoxia-inducible factor (HIF) signalling pathway [Citation8]. Additionally, epigenetic factors are thought to play a role in the acclimatization to high-altitude hypoxia. Those include significantly lower DNA methylation at high altitudes in EPO and RXRA genes and LINE-1 repetitive elements, and increased methylation in EPAS1 and PPARA genes [Citation9]. In conjunction with these results, it was reported that hypoxia altered the DNA methylation profile of cardiac fibroblasts via HIF1A regulation of DNA methyltransferase DNMT1 and DNMT3B [Citation10].
Apart from its role in environmental adaptations, hypoxia is a major factor that affects epigenetic marks during oncogenic transformation. In lung adenocarcinoma (LUAD) cells, hypoxia led to changes in DNA methylation patterns of the key genes involved in LUAD progression: FAM20C, MYLIP and COL7A1 [Citation11]. In breast cancer, hypoxia leads to a more aggressive tumour phenotype by transactivation of several genes as well as reprogramming of pre-mRNA splicing through the HIF pathway. The inclusion levels of certain exons of DHX32 and BICD2 genes are both significantly correlated with DNA methylation levels and predictive of patient survival [Citation12].
Several non-mutually exclusive mechanisms can be suggested to explain the influence of hypoxia on genomic methylation patterns: (i) transcriptional or functional inhibition of TET enzymes directly by oxygen intermediates [Citation7]; (ii) transcriptional of functional enhancement of DNA methylating DNMT enzymes; (iii) de novo activated transcriptional programs that are associated with stabilized nuclear HIF1A and cause changes in concentrations of TET/DNMT-regulating metabolites. In this work, we explore the possibility of regulating genome methylation level by initiating the hypoxia transcriptional program without changing the actual level of oxygen. Previously, we explored the effects in gene promoters and CpG-rich regions, by performing reduced representation bisulphite sequencing (RRBS) in cells under normoxia conditions but with stabilized HIF1A [Citation13]. However, it remained unknown if the observed changes could be generalized to the whole genome and what mechanism could drive the hypermethylation.
In this work, we profiled genome-wide DNA methylation with bisulphite sequencing (wgBS) in three clones with independent VHL inactivation and observed global genome hypermethylation. Reintroduction of exogenous wild-type VHL has partially rescued DNA methylation phenotype to the wild-type state. Global changes in DNA methylation were confirmed with LC-MS. Levels of several metabolites were measured with LC-MS to explore a potential mechanism of global DNA hypermethylation upon VHL inactivation in normoxia.
Results
Introduction of cancer mutation into the VHL gene results in stabilization of HIF1A in Caki-1 cells
With CRISPR-Cas9 gene editing, we obtained three clones (Caki-1VHLmut) of Caki-1 human clear cell renal carcinoma cell line with a homozygous frameshift in VHL gene ()). The frameshift at 181D led to the production of an inactive form of VHL that was unable to ubiqitinate HIF1A [Citation3,Citation13]. Mutations within 181D were frequently observed in renal tumours according to the COSMIC database [Citation14]. Western blot analysis of nuclear extracts confirmed the stabilization of HIF1A protein in the absence of hypoxia in cells with mutant VHL in comparison with Caki-1 cells (Supplementary figure S1A). Expression of VHL in the three clones (Caki-1VHLexo) was rescued with exogenous chimeric VHL (tagged with HA) by lentivirus infection. Western blot showed restored VHL expression that led to the degradation of HIF1A protein (Supplementary figure S1A). RNA-seq analysis of Caki-1 cell line, three clones with mutant VHL and the clones with rescued VHL expression confirmed the activation of hypoxia program in VHL mutants and its deactivation after exogenous expression of VHL (Supplementary figure S1B).
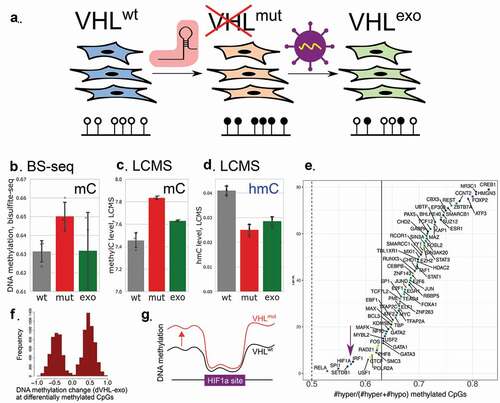
Figure 1. Whole-genome methylation in Caki-1 cells, three clones with inactivated VHL and the same clones with VHL expression rescued by exogenous construct. (a). Design of the experiment. VHL was inactivated independently in three clones of Caki-1 human kidney cancer cell line. In each clone, the mutation was rescued by exogenous expression of VHL. DNA methylation and metabolites were profiled in these cells. (b). Global DNA methylation levels estimated from bisulphite sequencing data. (c). Global DNA methylation levels measured by mass-spectrometry. (d). Global DNA hydroxymethylation (hmC) measured with mass-spectrometry. (e). For each transcription factor, we estimated the fraction of hypermethylated sites among all CpG sites with significantly altered methylation. (f). DNA methylation changes in CpGs with significant difference between wild-type Caki-1 cells and the clones with inactivated VHL. G. While all transcription factors tend to be hypermethylated in VHL mutants, HIF1A sites to a great extent avoid hypermethylation.
VHL inactivation causes whole-genome hypermethylation
To test if the induction of the transcriptional programs driven by HIF1A could cause changes in genome methylation in the absence of hypoxia, we performed whole genome bisulphite sequencing in Caki-1, Caki-1VHLmut and in Caki-1VHLexo cells (), Supplementary figure S2). In our previous work, we observed DNA hypermethylation in gene promoters. Here, we discovered a significant increase of DNA methylation not only in promoter regions, but rather globally throughout the genome ()). Hypermethylation could be observed in each chromosome (Supplementary figure S3). The magnitude of the change was smaller for whole-genome DNA methylation (2% increase) than for CpG islands (6.45% increase), as most of the CpG’s in the genome are fully methylated even in the original cell line, hence, DNA methylation levels of these positions could not increase more. Exogenous expression of VHL rescued DNA methylation phenotype and returned global DNA methylation close to the wild-type levels (), S3).
We validated the increase of global DNA methylation in VHL mutants and its partial rescue to the normal phenotype in the clones with exogenic VHL expression by mass-spectrometry (LC-MS) of DNA nucleotides and observed the same effect (), Pmut vs wt = 0.01). Using LC-MS, we could distinguish between methylated and hydroxymethylated cytosine in the studied samples. While mC levels increased in VHL mutants, hmC levels decreased ()). In Caki-1VHLexo, we saw a partial restoration in mC which was accompanied by the drop in hmC level. Accumulation of mC accompanied with depletion of hmC could be explained by impaired oxidation of mC to hmC by TET enzymes – the first step of DNA demethylation [Citation15].
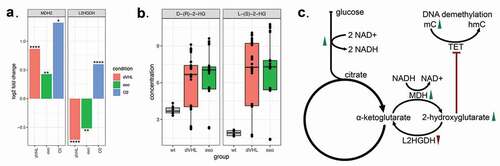
Figure 2. (a). Changes of gene expressions of MDH and L2HGDH enzymes responsible for 2-hydroxyglutarate synthesis and degradation. Y-axis indicates log fold-change of gene expression in VHL mutants, rescued VHL mutants with exogenic expression of VHL and Caki-1 cells in hypoxic conditions, all compared to Caki-1 cells in normoxic conditions. DESeq2 p-values corrected for multiple testing (FDR) are indicated as follows: **** P < 0.0001; *** P < 0.001; ** P < 0.01; * P < 0.05. (b). Concentrations of L and D isomers of 2-hydroxyglutarate measured by mass-spectrometry. (c). Proposed mechanism of DNA hypermethylation in VHL mutants. Green arrows indicate the increase of gene expression of all enzymes involved in glycolysis and MDH after VHL inactivation. Red arrow indicates decreased expression of L2HGDH. Increased concentrations of L- and D- hydroxyglutarate in VHL mutants lead to the inhibition of TET enzymes and DNA hypermethylation.
The observed changes in DNA methylation could not be attributed to the differences in cell cycle progression. Quantitation of DNA content revealed that the differences in the distribution of cells according to the phases of the cell cycle between Caki-1 cells, VHL mutants and the rescued clones were beyond statistical significance (Supplementary Figure S4)
DNA hypermethylation in VHL mutants was not restricted to the binding sites of specific transcription factors or to the loci characterized by certain histone modifications. Among CpG sites with significantly altered DNA methylation in VHL mutants (PBetaBinomial<0.01, )) that fall into a given set of genomic intervals such as HIF1A binding sites, we checked what proportion of CpG’s were hyper- and hypomethylated. Binding sites of all transcription factors tended to be enriched by hypermethylated CpGs ()). Interestingly, one of the smallest rates of hypermethylated CpGs (yet still higher than 0.5) was observed for HIF1A sites. Thus, it stands to reason that HIF1A binding sites could potentially be protected from hypermethylation by increased binding of HIF1A ()).
Gene expression changes of key metabolic enzymes
To decipher a potential mechanism of the observed DNA hypermethylation in the absence of active VHL, we first studied gene expression of the key enzymes responsible for DNA methylation and demethylation. TET enzymes were transcriptionally downregulated in VHL mutants (Supplementary Figure S5). We demonstrated that the protein levels of TET2 enzymes were not affected by VHL mutation (Supplementary figure S6A). However, the ability of TET enzymes to demethylate DNA measured by activity assay kit were not impaired, moreover, some clones demonstrated higher rate of demethylation of the probe DNA (Supplementary figure S6B).
VHL inactivation led to a significant increase in gene expression of the enzymes involved in all stages of glycolysis (Supplementary figure S7), including SLC2A1, HK1, PFKL, PFKP, ALDOA, ALDOC, GAPDH, PGK1, PGAM1, ENO1, ENO2 and LDHA (Supplementary table 1). Glycolysis leads to accumulation of pyruvate and NADH that are subsequently utilized in the TCA cycle. Some TCA cycle metabolites are also known to stimulate or inhibit the activity of TET enzymes. Using mass-spectrometry, we measured the levels of known TCA cycle metabolites and observed no significant changes in the concentrations of α-ketoglutarate (P = 0.87), fumarate (P = 0.087) and succinate (P = 0.066).
Accumulation of 2-HG in cells with inactivated VHL
2-hydroxyglutarate can inhibit TET enzymes that actively demethylate DNA. In gliomas and acute myeloid leukaemias (AML) with mutated IDH1 and IDH2 genes, genome hypermethylation is driven by increased concentration of D-2-hydroxyglutarate that, in turn, was caused by a gain-of-function mutation in IDH [Citation16–18]. However, the cell lines and their derivatives used in the current study contained wild-type IDH1 and IDH2. We validated that IDH1 and IDH2 did not have gain-of-function mutations at positions chr2:209113192 (IDH1), chr15:90631934 and chr15:90631838 (IDH2, coordinates according to hg19) that could lead to aberrant production of D-2-hydroxyglutarate: all positions were covered by RNA-seq data and all reads contained only the wild-type alleles in these positions. We therefore explored what alternative mechanisms could lead to 2-hydroxyglutarate accumulation.
Apart from oxidizing malate to oxaloacetate, malate dehydrogenase (MDH2) is capable of reducing 2-oxoglutarate (TCA cycle metabolite) to L-2-hydroxyglutarate [Citation19,Citation20]. We showed that expression of MDH2 significantly increased (1.8-fold, FDR = 2×10⁻⁸) after VHL inactivation compared to the original cell lines with wild type VHL. It significantly decreased after exogenous VHL reactivation (1.3 fold decrease, FDR = 0.001, )).
In contrast, VHL inactivation caused a two-fold drop of expression of two 2-hydroxyglutrarate dehydrogenases, L2HGDH (0.60, FDR = 2.9×10⁻⁵, )) and D2HGDH (0.73, FDR = 0.03). These enzymes can convert, respectively, L- and D-2-hydroxyglutarate back into 2-oxoglutarate ()). Taken together, the observed gene expression changes suggested the increase of 2-hydroxyglutarate and specifically its L-isomer in VHL mutants.
To validate this hypothesis, we measured the isomers of 2-hydroxyglutarate with mass-spectrometry (LC-MS). Indeed, the concentrations of both L- and D-2-hydroxyglutarate significantly increased in VHL mutants and decreased after the rescue of VHL expression ()). The L-isomer showed stronger increase (4-fold, PWilcoxon = 9.9×10⁻⁵), whereas the D-isomer was increased twofold (PWilcoxon = 0.0036), which suggested an IDH-independent mechanism of 2-hydroxyglutarate accumulation.
To investigate if this increase of 2-hydroxyglutarate concentration was sufficient to explain global DNA hypermethylation in VHL mutants, we profiled 2-hydroxyglutarate levels in HCT116 cell line. D-2-hydroxyglutarate concentration reached 5–7.5 amol/cell in HCT116 cell line which was within the range of concentrations observed in Caki-1 VHL mutants (Supplementary figure S8). In HCT116 cells, this accumulation of D-2-hydroxyglutarate was sufficient to reach higher levels of DNA methylation than those of Caki-1 VHL mutants.
Tumours formed by Caki, CakiVHLmut and CakiVHLexo cells
We assessed the ability of the studied clones to form tumours in immunodeficient mice ()). All three clones with mutated VHL (Caki-1VHLmut) gave rise to significantly bigger tumours (more than 2.5-fold increase in tumour size, PWilcoxon = 0.001) as compared to the original Caki-1 cells with wild-type VHL. Exogenous expression of wild-type VHL significantly rescued the phenotype in each clone (PWilcoxon = 0.0008). In two of the three rescued clones, tumour sizes were not higher than those of Caki-1 cells.
Figure 3. (a). Mass of the tumours formed by cells injected into immunodeficient mice. VHL mutant Caki-1 cells formed significantly bigger tumours. (b, c). DNA methylation in CpG islands increases in VHL mutants compared to VHL-wild-type Caki-1 cells. Each promoter CpG island was assigned to a gene. CpG islands were significantly hypermethylated in VHL mutants. (d). Genes with significantly hypermethylated CpG islands in their promoters were enriched among negative regulators of cell proliferation.
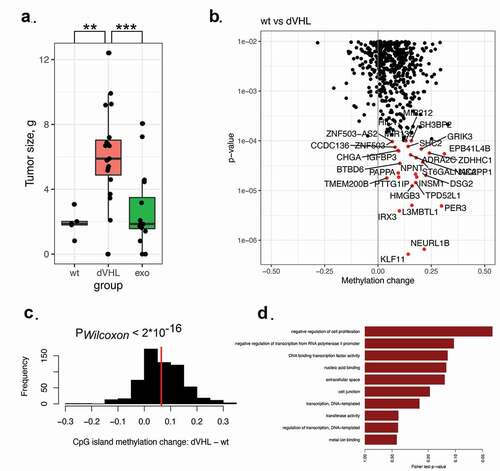
To understand the mechanism of increased tumorigenesis in VHL mutants (Caki-1VHLmut), we explored DNA methylation in gene promoters containing CpG islands. For each CpG island, we tested if DNA methylation level changed between the original Caki-1 cells and VHL mutant cells ()). Strikingly, a vast majority of CpG islands were hypermethylated in VHL mutants: on average, a 6.45% increase in DNA methylation level was observed (PWilcoxon<2.2×10⁻¹⁶, )). Genes with hypermethylated CpG islands in their promoter regions were strongly enriched among the genes responsible for negative regulation of proliferation ()). Among the genes hypermethylated in VHL mutants, we observed known tumour suppressors in kidney cancer: PER3, PCDH19, RLIM, KIAA1024. Their expression was decreased in VHL mutants and reversibly reactivated upon VHL inactivation (Supplementary figure S9).
Discussion
DNA hypermethylation in hypoxia was previously linked directly to decreased oxygen levels: active DNA demethylation involves oxidation of mC to hmC by TET enzymes and therefore is sensitive to oxidation-reduction potential in the cells [Citation7]. However, DNA hypermethylation could be observed at completely normal oxygen concentrations in the cells with impaired hypoxia signalling. We have previously shown that VHL inactivation led to DNA hypermethylation in CpG-rich genomic regions profiled by RRBS [Citation13]. Here, we generalized this observation to the whole genome. We also demonstrate that the rescue of VHL expression from an exogenous lentiviral vector partially restores DNA methylation.
Global increase of DNA methylation in VHL mutants and decrease after the reactivation of VHL were observed by two independent methods, bisulphite sequencing and mass spectrometry (LC-MS). The magnitude of DNA hypermethylation within CpG islands was even stronger than in the whole genome. Hypermethylation of CpG islands in the promoters of tumour suppressors could explain higher size of tumours formed by cell clones with mutated VHL. Decrease in tumour suppressor gene expression PER3, PCDH19, RLIM, KIAA1024 in VHL mutant cells follows the changes in their promoter methylation. All of these genes are downregulated in various cancer types and regulated by promoter hypermethylation [Citation21–23]. Increased tumour size in VHL mutant cells is also in accordance with increased viability of these cells after achieving confluence in cell culture [Citation3].
Hypermethylated CpG sites were not enriched within specific transcription factor-binding sites. However, HIF1A sites were among the least affected by the global DNA hypermethylation. We hypothesized that overall genomic hypermethylation is to a great extent compensated within HIF1A sites by increased binding of HIF1A caused by accumulation of HIF1A protein in VHL mutants. Recent findings suggest that HIFs fail to bind if the CpG dinucleotides within their binding sites are methylated, both in vitro and in vivo [Citation24]. Therefore, the observed protection of the functional HIF1A sites from hypermethylation could prevent their long-term inactivation.
We identified a metabolic mechanism that could lead to DNA hypermethylation in VHL mutants. VHL mutants accumulated 2-hydroxyglutarate, a metabolite that is known to inhibit TET-mediated DNA demethylation in IDH-mutant glioblastomas. Specifically, the D-isomer of 2-hydroxyglutarate is accumulated in IDH-mutant tumours. However, in the studied cell clones with intact IDH1/IDH2 and mutated VHL, we observed a stronger increase of the concentration of the L-isomer. The D-isomer might arise from tautomerization of the L-isomer and both isomers can subsequently inhibit TET [Citation25–27]. In addition, we observed an increased expression of MDH enzyme that produces L-2-hydroxyglutarate and decreased expression L2HGDH that degrades it. These observations are in line with L-2-hydroxyglutarate production by MDH, rather than D-2-hydroxyglutarate production by IDH1 or IDH2. Thus, for the first time we demonstrate an IDH-independent mechanism of 2-hydroxyglutarate accumulation that leads to increased DNA methylation upon VHL inactivation. Further studies are required to show how HIF1A can directly or indirectly regulate the expression of MDH and L2HGDH.
Typically, heterozygous mutations within the active sites of isocitrate dehydrogenases (R132H in IDH1 and R140Q in IDH2) lead to the accumulation of millimolar concentrations of D-2-hydroxyglutarate. However, even the tumours with wild-type IDH1 and IDH2 can accumulate higher levels of 2-HG (0.01–0.1 mM) than normal tissues (10−8 M) [Citation28]. To demonstrate that the magnitude of the increase of 2-hydroxyglutarate concentration was sufficient for the observed DNA hypermethylation, we measured the concentrations of L- and D-2-hydroxyglutarate and the levels of DNA methylation in HCT116 cell line. In HCT116 cell line, the similar or lower concentrations of L- and D-2-hydroxyglutarate induced even higher levels of DNA methylation compared to the studied VHL mutants.
In the previous works, a difference in the concentration of 2-hydroxyglutarate was observed between various cell lines and tumours [Citation25]. However, cell lines differ from each other by many parameters. Here, we established a causal link between VHL inactivation, HIF1A stabilization and the increase of 2-hydroxyglutarate by performing a direct intervention.
Hypoxia and pseudohypoxia conditions, in which glycolysis is hyperactivated, present a challenge for a cell due to NADH accumulation. Interestingly, production of 2-hydroxyglutarate from 2-oxoglutarate by MDH consumes NADH. It can therefore be considered as one of the mechanisms to get rid of excess NADH that accumulates in glycolysis.
In the pioneering work of Thienpont et al. [Citation7], the DNA hypermethylation was discovered in hypoxia. Under hypoxia, they observed a 50% increase in 2-hydroxyglutarate level and 5–10% increase of 2-hydroxyglutarate concentration normalized to the concentration of alpha-ketoglutarate, a cofactor of TET. However, this effect was much smaller than the direct effect of hypoxia and therefore DNA hypermethylation was attributed solely to the low concentration of oxygen required as a substrate for Tet enzymes. For comparison, in our study, 2-HG/α-ketoglutarate ratio was 5–10 fold higher in Caki-1VHLmut cells than in Caki-1 cells (increased from 1% to 10%). Identical activity of TET enzymes measured in nuclear extracts both in [Citation7] between the cells in normoxia and hypoxia, and in our work (Figure S6B) between VHL wild-type cells and mutants can be explained by the fact that the assay used in both studies to estimate the rate of 5mC oxidation (Colorimetric Epigenase 5mC-Hydroxylase TET Activity/Inhibition Assay Kit from Epigentek) contained high molar excess of alpha-ketoglutarate that could neutralize the effect of 2-HG increase. In other words, the kit attempts to measure TET activity regardless of the concentrations of various metabolites in nuclear extracts.
The discovered link between activation of hypoxia signalling due to VHL inactivation, accumulation of 2-hydroxyglutarate and DNA hypermethylation not only explains hypermethylation in VHL mutants under normoxic condition, but can also contribute to DNA hypermethylation in hypoxia, additionally to the direct effect of low oxygen concentration on the activity of TET enzymes. Deconvolution of these two effects requires further studies.
Methods
Cell culture
Caki-1 and HEK293t cell lines were grown in Dulbecco’s modified Eagle medium supplemented with 10% foetal bovine serum, 1% penicillin/streptomycin, and 2 mM L-glutamine. Cells were transfected with Lipofectamine 3000 (Thermo Fisher Scientific) according to the manufacturer’s recommendation.
Genome editing
CRISPR/Cas9–based editing was performed as described in ref [Citation29]. Briefly, Caki-1 cells were seeded on a 12-well plate. Cells were transfected with Lipofectamine 3000 with PX459-VHL plasmid to generate frame shift which led to a stop loss in the C-terminal alpha domain of VHL [Citation3]. Puromycin was applied after 24 h at a concentration of 2 μg ml−1. Cells were incubated for 72 h, passaged into a 96-well plate at a density of 1 cell per 2 wells on medium without puromycin. For further study, we have chosen three clones for each experiment. The frame shift was confirmed by Sanger sequencing of the corresponding amplicons obtained from PCR with genomic DNA.
Antibodies
Following antibodies were used in this study: anti-HIF1A ((H1 alpha 67) ab1), anti-actin (ab8227), anti-H3 (ab18521), anti-TET2 (active motif 61390).
Viral vectors and lentivirus transduction
VHL-HA was subcloned to pCDF1-MCS2-EF1-Puro vector (System BioSciences). HEK293t cells were transfected with pCDF-VHL-HA, pVSV-G and pFiv-34 N vectors. Viral supernatant was collected after 48 and 60 hrs, filtered through a 40um filter. Virus was precipitated by 12,5% PEG 8000 at +4°C overnight followed by centrifugation at 4200 g during 40 minutes at+4°C. Pellet was resuspended in 300 mkl of OPTI-MEM and stored at −80°C. Infections were carried out in 4 ml medium using polybrene diluted 1:2,000. 100ul of viral concentrate were used per 60-mm cell plate for 12 hrs. Infected cells were selected by puromycin (2 mkg/ml).
Tumour xenografts
Nu/J mice were obtained from Jackson Laboratories and transferred to the Center for Genetic Resources of Laboratory Animals at the Institute of Cytology and Genetics, Siberian Branch, RAS (Stock No: 002019). All procedures were conducted under Russian legislation according to Good Laboratory Practice, inter-institutional bioethical committee guidelines and the European Convention for the protection of vertebrate animals used for experimental and other scientific purposes. All procedures were approved by the bioethical committee (protocol №33 from 21.05.2018). All efforts were made to minimize the number of animals used and their suffering. All animals used had specific pathogen-free status. 5–6 mice were used per one cell line. Each mouse was inoculated subcutaneously in the withers area with 5 × 10⁶ Caki-1, Caki-1VHLmut or Caki-1VHLexo tumour cells in 100 mkl sterile PBS. Mice were sacrificed on day 21 after inoculation. Tumours were weighed and measured.
Bisulphite conversion and whole-genome bisulphite sequencing
DNA methylation was profiled by whole genome bisulphite sequencing (WGBS). DNA extraction, bisulphite conversion, library preparation and sequencing are described in Supplementary Methods.
Reads were mapped to the hg19 reference genome with Bismark software [Citation30]. To estimate the efficacy of C-to-T conversion, the lambda phage genome was added to the reference genome. Low DNA methylation levels at cytosines in lambda phage DNA indicate good bisulphite conversion. Additionally, we estimated DNA methylation level at C positions outside the CpG context. Differential methylation analysis was performed by the MethPipe/RADmeth software package [Citation31]. Custom scripts were used to iterate through bisulphite bam files and estimate global DNA methylation, per-chromosome methylation levels. To find out how DNA methylation changed in individual CpG islands, we calculated the total number of methylated and unmethylated CpG’s in bisulphite reads at each CpG position within the CpG island. Beta-binomial test was applied to estimate if the DNA methylation of a given CpG island significantly differed between two groups of samples.
The following genomic tracks were downloaded from ENCODE: histone marks for HepG2 cell line (wgEncodeBroadHistone tables, hg19 genome); clustered transcription factor-binding sites, conserved across many cell lines (wgEncodeRegTfbsClusteredV3). PWM for HIF1A binding motif was downloaded from HOCOMOCO database [Citation32,Citation33]. Occurrences of HIF1a binding motif were searched in the hg19 genome with SARUS software [Citation34].
RNA-seq
Total RNA was extracted from cell culture with Trizol reagent according to the manufacturer’s instructions. Quality was checked with BioAnalyser and RNA 6000 Nano Kit (Agilent). PolyA RNA was purified with Dynabeads® mRNA Purification Kit (Ambion). Illumina library was made from polyA RNA with NEBNext® Ultra™ II RNA Library Prep (NEB) according to manual. Sequencing was performed on HiSeq1500 with 50 bp read length. At least 10 millions of reads were generated for each sample.
Reads were mapped to the hg19 genome with STAR software (version 2.5.4b) [Citation35]. Gene models of non-overlapping exonic fragments were taken from the ENSEMBL 54 database. For each exonic fragment, total coverage by mapped reads in each sample was calculated with htseq-count (version 0.11.0) [Citation36]. Differential expression analysis was performed by applying default read count normalization and performing per-gene negative binomial tests, implemented in DESeq2 R package (version 1.20.0), with default parameters [Citation37].
Flow cytometry
Cells were fixed in 70% ethanol during 30 minutes at +4°C, washed by 1xPBS 2 times, treated with ribonuclease and stained by PI and analysed by flow cytometry. Data was analysed by ModFit LT V5.09.
TET activity assay
TET hydroxylase activity was measured by TET hydroxylase activity colorimetric quantification kit (ab15619) according to the manufacturer’s instruction.
Mass-spectrometry profiling of modified nucleotides
The analyses were performed using a method described earlier by Gackowski et al. [Citation38] with some modifications that are described in Supplementary Methods.
Mass-spectrometry profiling of metabolites
Quantitation of TCA cycle metabolites
Quantitation of α-ketoglutaric acid (αKG), succinic acid (SA) and fumaric acid (FA) is described in detail in Supplementary Methods. A series of standard curves were prepared over a concentration range of 0.391–100 µM from a stock solutions of unlabelled metabolites αKG (Sigma Aldrich), SA (Sigma Aldrich) and FA (Sigma Aldrich) in water and concentration range of 800 µM from a stock solutions of labelled metabolites [D4]-2-KG (Sigma-Aldrich), [13C4]-SA (Sigma-Aldrich) and [13C4]-FA (Sigma Aldrich) in water. All calibration curves constructed from the peak area ratios versus the molar ratios (labelled/unlabelled) showed a range of determination coefficient (R2) values over 0.99 (Supplementary Figure S10). The experiment was performed in five technical replicates.
Quantitation of L- and D-2-hydroxyglutarate
Quantitation of L- and D-2-hydroxyglutarate is described in detail in Supplementary Methods. The stable-isotope labelled internal standards of L-, D-[D4]-2-hydroxyglutaric acid were synthetized in-house by reduction of commercially available [D6]-2-ketoglutaric acid (Sigma-Aldrich) with excess zinc as previously described [Citation39].
All samples were analysed at least in three technical replicates. A series of standard curves were prepared over a concentration range of 0.005–10 µM from a stock solutions of unlabelled enantiomers L-, D-2HG (Sigma Aldrich) in water and 50 µM of labelled metabolites L-,D-[D4]-2HG. All calibration curves constructed from the peak area ratios versus the molar ratios (labelled/unlabelled) showed determination coefficient (R2) values over 0.99 (Supplementary Figure S11).
Key points
Inactivation of the VHL gene leads to genome hypermethylation in kidney cancer cells. The DNA methylation phenotype can be rescued by endogenous expression of the wild-type VHL.
DNA hypermethylation can be attributed to the accumulation of aTET inhibitor 2-hydroxyglutarate.
The accumulation of 2-hydroxyglutarate in IDH wild-type cells is explained by gene expression changes in key metabolic enzymes (malate dehydrogenase MDH and 2-hydroxyglutrarate dehydrogenase L2HGDH).
Ethics approval and consent to participate
All procedures were conducted under Russian legislation according to Good Laboratory Practice, inter-institutional bioethical committee guidelines and the European Convention for the protection of vertebrate animals used for experimental and other scientific purposes. All procedures were approved by the bioethical committee (protocol #33 from 21.05.2018). All efforts were made to minimize the number of animals used and their suffering.
Authors’ contributions
A.A. and E.P. conceived the idea of the study and drafted the manuscript, A.A., S.Z. and E.P. designed the experiments, S.Z. and D.K. performed gene editing, D.K. and A.M. performed bisulfite sequencing, A.A., A.St. and A.So. performed alignment and quality control of bisulfite sequencing and RNA-seq reads, A.A. performed bioinformatic analysis of the data, plotted and assembled the figures, J.S., M.G., M.M. and D.G. designed and performed mass-spectrometry experiments.
Supplemental Material
Download Zip (767.7 KB)Acknowledgments
We would like to acknowledge Alexey Ruzov for a meaningful discussion. We would like to thank Galina Filonova and Ivan Ozerov for their support. We would like to thank Alek Erickson for his help with the editing of the manuscript.
Disclosure statement
The authors declare that they have no competing interests.
Availability of data and material
Sequenced data was deposited to the GEO database (https://www.ncbi.nlm.nih.gov/geo/) under accession number GSE151787.
Supplementary material
Supplemental data for this article can be accessed here
Additional information
Funding
Related Research Data
References
- Scelo G, Riazalhosseini Y, Greger L, et al. Variation in genomic landscape of clear cell renal cell carcinoma across Europe. Nat Commun. 2014;5:5135.
- Tanimoto K, Makino Y, Pereira T, et al. Mechanism of regulation of the hypoxia-inducible factor-1 alpha by the von Hippel-Lindau tumor suppressor protein. EMBO J. 2000;19:4298–4309.
- Zhigalova NA, Zhenilo SV, Artemov AV, et al. CRISPR/Cas9-editing-based modeling of hypoxia in renal cancer cells. Mol Biol. 2017;51:836–840.
- Rechsteiner MP, von Teichman A, Nowicka A, et al. VHL gene mutations and their effects on hypoxia inducible factor HIFα: identification of potential driver and passenger mutations. Cancer Res. 2011;71:5500–5511.
- Liu T, Zhao L, Chen W, et al. Inactivation of von Hippel-Lindau increases ovarian cancer cell aggressiveness through the HIF1α/miR-210/VMP1 signaling pathway. Int J Mol Med. 2014;33:1236–1242.
- Mandriota SJ, Turner KJ, Davies DR, et al. HIF activation identifies early lesions in VHL kidneys: evidence for site-specific tumor suppressor function in the nephron. Cancer Cell. 2002;1:459–468.
- Thienpont B, Steinbacher J, Zhao H, et al. Tumour hypoxia causes DNA hypermethylation by reducing TET activity. Nature. 2016;537:63–68.
- Nanduri J, Semenza GL, Prabhakar NR. Epigenetic changes by DNA methylation in chronic and intermittent hypoxia. Am J Physiol Lung Cell Mol Physiol. 2017;313:L1096–100.
- Childebayeva A, Harman T, Weinstein J, et al. DNA Methylation Changes Are Associated With an Incremental Ascent to High Altitude. Front Genet. 2019;10:1062.
- Watson CJ, Neary R, Collier P, et al. Hypoxia alters the dna methylation profile of cardiac fibroblasts via HIF-1α regulation of DNA methyltransferase [Internet]. Heart. 2012;98:A7.2–A7. DOI:10.1136/heartjnl-2012-303148a.21
- Li H, Tong L, Tao H, et al. Genome-wide analysis of the hypoxia-related DNA methylation-driven genes in lung adenocarcinoma progression. Biosci Rep [Internet]. 2020;40. DOI:10.1042/BSR20194200
- Pant D, Narayanan SP, Vijay N, et al. Hypoxia-induced changes in intragenic DNA methylation correlate with alternative splicing in breast cancer. J Biosci [Internet]. 2020;45. Available from https://www.ncbi.nlm.nih.gov/pubmed/31965981
- Artemov AV, Zhigalova N, Zhenilo S, et al. VHL inactivation without hypoxia is sufficient to achieve genome hypermethylation. Sci Rep. 2018;8:10667.
- Tate JG, Bamford S, Jubb HC, et al. COSMIC: the Catalogue Of Somatic Mutations In Cancer. Nucleic Acids Res. 2019;47:D941–7.
- Tahiliani M, Koh KP, Shen Y, et al. Conversion of 5-methylcytosine to 5-hydroxymethylcytosine in mammalian DNA by MLL partner TET1. Science. 2009;324:930–935.
- Cohen AL, Holmen SL, Colman H. IDH1 and IDH2 Mutations in Gliomas [Internet]. Curr Neurol Neurosci Rep. 2013;13. DOI:10.1007/s11910-013-0345-4
- Parsons DW, Jones S, Zhang X, et al. An integrated genomic analysis of human glioblastoma multiforme. Science. 2008;321:1807–1812.
- Klughammer J, Kiesel B, Roetzer T, et al. The DNA methylation landscape of glioblastoma disease progression shows extensive heterogeneity in time and space. Nat Med. 2018;24:1611–1624.
- Intlekofer AM, Wang B, Liu H, et al. L-2-Hydroxyglutarate production arises from noncanonical enzyme function at acidic pH [Internet]. Nat Chem Biol. 2017;13:494–500.
- Rzem R, Vincent M-F, Van Schaftingen E, et al. L-2-hydroxyglutaric aciduria, a defect of metabolite repair. J Inherit Metab Dis. 2007;30:681–689.
- Tang W, Peng W, Zhang H, et al. Period 3, a tumor suppressor in non-small cell lung cancer, is silenced by hypermethylation. Int J Clin Exp Pathol. 2018;11:120–128.
- Hong Z, Feng Z, Sai Z, et al. PER3, a novel target of miR-103, plays a suppressive role in colorectal cancer in vitro. BMB Rep. 2014;47:500–505.
- Zhang T, Guan G, Chen T, et al. Methylation of PCDH19 predicts poor prognosis of hepatocellular carcinoma. Asia Pac J Clin Oncol. 2018;14:e352–8.
- D’Anna F, Van Dyck L, Xiong J, et al. DNA methylation repels binding of hypoxia-inducible transcription factors to maintain tumor immunotolerance. Genome Biol. 2020;21:182.
- Shim E-H, Livi CB, Rakheja D, et al. L-2-Hydroxyglutarate: an epigenetic modifier and putative oncometabolite in renal cancer. Cancer Discov. 2014;4:1290–1298.
- Shenoy N. Epigenetic dysregulation by aberrant metabolism in renal cell carcinoma can be reversed with Ascorbic acid. Mol Cell Oncol. 2019;6:1595309.
- Xu W, Yang H, Liu Y, et al. Oncometabolite 2-hydroxyglutarate is a competitive inhibitor of α-ketoglutarate-dependent dioxygenases. Cancer Cell. 2011;19:17–30.
- Ježek P. 2-Hydroxyglutarate in Cancer Cells [Internet]. Antioxid Redox Signal. 2020;33:903–926.
- Ran FA, Hsu PD, Wright J, et al. Genome engineering using the CRISPR-Cas9 system. Nat Protoc. 2013;8:2281–2308.
- Krueger F, Andrews SR. Bismark: a flexible aligner and methylation caller for Bisulfite-Seq applications [Internet]. Bioinformatics. 2011;27:1571–1572.
- Dolzhenko E, Smith AD. Using beta-binomial regression for high-precision differential methylation analysis in multifactor whole-genome bisulfite sequencing experiments. BMC Bioinformatics. 2014;15:215.
- Kulakovskiy IV, Medvedeva YA, Schaefer U, et al. HOCOMOCO: a comprehensive collection of human transcription factor binding sites models. Nucleic Acids Res. 2013;41:D195–202.
- Kulakovskiy IV, Vorontsov IE, Yevshin IS, et al. HOCOMOCO: expansion and enhancement of the collection of transcription factor binding sites models. Nucleic Acids Res. 2016;44:D116–25.
- Kulakovskiy IV, Boeva VA, Favorov AV, et al. Deep and wide digging for binding motifs in ChIP-Seq data. Bioinformatics. 2010;26:2622–2623.
- Dobin A, Davis CA, Schlesinger F, et al. STAR: ultrafast universal RNA-seq aligner. Bioinformatics. 2013;29:15–21.
- Anders S, Pyl PT, Huber W. HTSeq–a Python framework to work with high-throughput sequencing data. Bioinformatics. 2015;31:166–169.
- Love MI, Huber W, Anders S. Moderated estimation of fold change and dispersion for RNA-seq data with DESeq2. Genome Biol. 2014;15:550.
- Gackowski D, Starczak M, Zarakowska E, et al. Accurate, direct, and high-throughput analyses of a broad spectrum of endogenously generated DNA base modifications with isotope-dilution two-dimensional ultraperformance liquid chromatography with tandem mass spectrometry: possible clinical implication. Anal Chem. 2016;88:12128–12136.
- Gibson KM, Ten Brink HJ, Schor DSM, et al. Stable-isotope dilution analysis of D- and L-2-Hydroxyglutaric acid: application to the detection and prenatal diagnosis of D- and L-2-Hydroxyglutaric acidemias [Internet]. Pediatr Res. 1993;34:277–280. DOI:10.1203/00006450-199309000-00007