
ABSTRACT
High levels of methylated DNA in urine represent an emerging biomarker for non-small cell lung cancer (NSCLC) detection and are the subject of ongoing research. This study aimed to investigate the circadian variation of urinary cell-free DNA (cfDNA) abundance and methylation levels of cancer-associated genes in NSCLC patients. In this prospective study of 23 metastatic NSCLC patients with active disease, patients were asked to collect six urine samples during the morning, afternoon, and evening of two subsequent days. Urinary cfDNA concentrations and methylation levels of CDO1, SOX17, and TAC1 were measured at each time point. Circadian variation and between- and within-subject variability were assessed using linear mixed models. Variability was estimated using the Intraclass Correlation Coefficient (ICC), representing reproducibility. No clear circadian patterns could be recognized for cfDNA concentrations or methylation levels across the different sampling time points. Significantly lower cfDNA concentrations were found in males (p=0.034). For cfDNA levels, the between- and within-subject variability were comparable, rendering an ICC of 0.49. For the methylation markers, ICCs varied considerably, ranging from 0.14 to 0.74. Test reproducibility could be improved by collecting multiple samples per patient. In conclusion, there is no preferred collection time for NSCLC detection in urine using methylation markers, but single measurements should be interpreted carefully, and serial sampling may increase test performance. This study contributes to the limited understanding of cfDNA dynamics in urine and the continued interest in urine-based liquid biopsies for cancer diagnostics.
Introduction
Lung cancer remains the leading cause of cancer-related deaths worldwide [Citation1]. Screening programmes have shown that cancer-related mortality could be reduced by using low-dose computed tomography (LDCT) screening in selected high-risk patients [Citation2–4]. Combining this approach with molecular marker testing in liquid biopsies could further improve the screening selection and management of positive LDCT screening tests.
The analysis of methylated cell-free DNA (cfDNA) in liquid biopsies is a promising, safe, and easily applicable tool that is now being investigated for the detection of lung cancer. Methylation, an epigenetic DNA modification that regulates gene expression, is known as a critical process, involved in early lung cancer development and progression [Citation5]. Amongst liquid biopsies, blood and sputum are the most commonly reported sources of cfDNA for methylation analyses [Citation6–14]. On the other hand, urine is an upcoming means for liquid biopsy analyses in lung cancer diagnostics [Citation10,Citation15,Citation16]. Urine-based liquid biopsies are of particular interest, as the collection is completely non-invasive and can be performed at home. Moreover, large volumes can be collected regularly, which allows for repetitive sampling at frequent intervals.
Despite encouraging developments of urine-based liquid biopsies for lung cancer detection, this technique is not yet ready for implementation into clinical practice. Over the past years, considerable improvements have been achieved by optimisation and standardisation of pre-analytical conditions [Citation17–20]. However, one of the major remaining questions regarding the yield of cfDNA is the uncertainty on whether the circadian rhythm leads to variations in the amounts of methylated DNA in urine. There is also a limited understanding of the range of biological variation of methylated cfDNA in the urine of lung cancer patients. Biological variability refers to the random fluctuation of analyte concentrations around a homeostatic set point (within-subject variability), which varies per individual (between-subject variability) [Citation21]. Previous studies have focused exclusively on the abundance of cfDNA in plasma of healthy controls and lung cancer patients, which appeared to vary greatly within [Citation22] and between individuals [Citation23], and during the day [Citation24].
The aim of this study, therefore, was to investigate the dynamics of methylated cfDNA in the urine of lung cancer patients to estimate both between- and within-subject variability, and to evaluate whether a preferred urine collection time and sampling frequency exist.
Methods
Study population
In this prospective cohort study, patients with histologically confirmed NSCLC were consecutively recruited between November 2019 and January 2020 at the outpatient clinic of the Department of Pulmonology of the Amsterdam University Medical Center, location VUmc, Amsterdam. Inclusion criteria of NSCLC patients involved being diagnosed with active disease (i.e., before anti-cancer therapy or at disease progression after therapy) without the presence or history of any other primary malignancies. The revised eighth edition of the American Joint Committee on Cancer/Union for International Cancer Control Tumor-Node-Metastasis (TNM) Staging was used to determine tumor stage [Citation25]. Other relevant patient characteristics that were documented included sex, age, weight, tobacco use, therapy during study, survival, and histological subtype.
As controls, urine samples from healthy volunteers were collected through the Urine Controls (URIC) Biobank. Inclusion criteria of controls involved not having any cancer diagnosis in the past 15 years. Sex and age were registered from each participant.
Informed consent was acquired from each participating individual before urine collection. Ethical approval was obtained by the Medical Ethical Committee of the VU University Medical Center for both the DAYTIME study (No. 2017.333 and 2017.545) and the use of the URIC biobank (No. 2017.112).
Urine sample collection and processing
Each patient was carefully instructed to collect 30 mL of urine at three different time points for two subsequent days, adding up to a total of six samples per patient. To this end, special collection kits were designed, containing clear illustrated instructions, collection tubes, and postal envelopes. The three time points comprised morning (6:00 AM – 11:00 AM), afternoon (12:00 noon – 5:00 PM), and evening (6:00 PM – 12:00 midnight). Patients registered the time of urine collection and shipped their urine samples to the Pathology department of Amsterdam UMC, location VUmc, by regular mail. To ensure the preservation of genetic material in the urine, collection tubes contained 2 mL 0.6 M ethylenediaminetetraacetic acid (EDTA) as a preservative agent (final concentration 40 mM), and sample processing was performed within 72 h after collection. Urine samples of healthy volunteers were retrieved from the URIC biobank, which were collected once at a random time point of the day, according to the same collection protocol.
Urine samples of patients and controls were processed similarly. Up to 30 mL (patients) or 40 mL (controls) full void urine was centrifuged at 3000 × g for 15 min to obtain the urine supernatant fraction, which was stored at −20°C. This collection and storage procedure has been validated for reliable DNA methylation detection in urine [Citation18].
Cell-free DNA extraction and bisulfite conversion
The urinary cfDNA was extracted from 20 mL (patients) or 40 mL (controls) urine supernatant using the Quick DNA urine kit (Zymo Research, Irvine, CA, US). Previous research showed that differences in urine collection volume in a similar range (4–20 mL) have limited effects on DNA yield, eliminating this potential bias [Citation26]. DNA concentration was measured using the Qubit™ dsDNA HS Assay (Invitrogen, Carlsbad, CA, US). Depending on the yield, up to 250 ng purified DNA was subjected to bisulfite conversion using the EZ DNA Methylation Kit (Zymo Research). All procedures were carried out according to the manufacturer’s instructions.
DNA methylation analysis by quantitative methylation-specific PCR (qMSP)
Promoter hypermethylation detection of the CDO1, SOX17, and TAC1 genes was carried out by qMSP using a ViiA7 real-time PCR system (Applied Biosystems, Foster City, CA, USA). For each reaction, up to 50 ng modified DNA was mixed with the EpiTect MethyLite Master Mix (Qiagen), and 2.5–5.0 µM of each primer and 5.0–10.0 µM of each probe in a total volume of 12.5 µl. Primer and probe sequences used for CDO1 and TAC1 were kindly provided by Dr. A. Hulbert (University of Illinois at Chicago, Chicago, IL, US) and listed in [Citation10]. Primer and probe sequences of SOX17 were redesigned within the same genomic region as reported before [Citation10], using a locked nucleic acid probe to enhance specificity (Supplementary Table 1). The qMSP reactions were multiplexed as described previously [Citation27] to assess the methylation levels of all genes within the same reaction. ACTB was also included in the multiplex and used as a reference gene for normalisation and quality assessment. Sample series from each patient were processed in the same run.
Double-stranded gBlocks™ Gene Fragments (Integrated DNA Technologies) containing the amplicon sequences of all targets and ACTB were used as technical quality control and H2O was taken along as negative control during each qMSP run. Cycle threshold (Ct) values were measured at a fixed threshold. Sample quality and sufficient input were ensured by excluding samples with a ACTB Ct value exceeding 32 from methylation analysis. The discriminatory power of the qMSP was verified by testing 11 pairs of tumors and adjacent normal tissues from NSCLC patients of a previously published cohort [Citation28,Citation29].
Statistical analyses
The cfDNA concentration was expressed in ng/mL urine and transformed using an inverse hyperbolic sine function to enhance normality of the data. The methylation levels of the target genes were normalised according to the Ct value of the reference gene ACTB (2− ΔCt × 100) to obtain Ct ratios, and square root transformed. Linear mixed-effects models were fitted separately for the repeated measurements of cfDNA concentration and methylation levels of each marker. Linear mixed-effects models contain both fixed (i.e., constant across the population) and random (i.e., varying per individual) effects, enabling estimation of both between- and within-subject variation [Citation30]. Models incorporated a random intercept for each patient to account for within-patient correlation and included explanatory variables day (i.e., day 1 and day 2) and part of the day (i.e., morning, afternoon, and evening) as fixed effects.
Models were estimated using restricted maximum likelihood (REML). Additional patient characteristics (i.e., sex, age, weight, therapy during study, survival, and histological subtype) were considered for inclusion as fixed effects by backward stepwise selection (p≥ 0.05 for removal). Tobacco use could not be included as fixed effect due to missing data. Final models are available in the Supplementary material. The assumptions of linearity, normality of the residuals and random effects, and homoscedasticity (i.e., constant variance of the residuals) were checked visually using diagnostic plots [Citation31].
Differences in cfDNA concentration and methylation levels during the day and between the two days were evaluated by Type II Wald Chi-square tests. Model estimates and corresponding 95%-confidence intervals (CI), between-subject variances (σ2), within-subject variances (τ00 subject), and intraclass correlation coefficients (ICC) were tabulated for both the cfDNA concentration and methylation levels of CDO1, SOX17, and TAC1. The ICC indicates the resemblance of repeated measurements and describes the proportion of between-subject variability with respect to the total variability (between plus within). The ICC can range from zero to one, with zero indicating a poor reproducibility and one indicating a perfect reproducibility [Citation32].
Differences in time were displayed in boxplots, demonstrating the cfDNA concentrations and methylation marker levels measured between the different days and time points at a group level. Between- and within-subject differences were visualised by conditional scatterplots, showing the cfDNA concentrations and methylation marker levels measured at each time point for each patient individually, stratified for sex.
The added value of collecting multiple urine samples was determined by (1) comparing the methylation levels measured in the urine of patients (n=23) and controls (n=60), by including all available patient samples (n=138), and (2) random sampling to compute the statistical difference between methylation levels of cases and controls when only one urine sample would have been collected. Linear mixed-effects models were fitted as described above with subject as a random effect to account for repeated measures in the patient group. Likewise, differences in methylation levels between patients and controls were tested as described above. Final models are available in the Supplementary material. Random sampling was conducted according to [Citation33]. Briefly, only one urine sample of each patient was randomly selected from the six available samples to compare the methylation levels of each marker between patients and controls, which was repeated 100 times in total. A median p-value was computed to summarise the outcome of 100 rounds of random sampling.
Statistical analyses were performed in R (v.3.6.1) and Rstudio (v.1.1.463). For statistical tests, p-values <0.05 were considered statistically significant.
R packages
Linear mixed models were computed using the ‘lme4’ package [Citation30], combined with the Companion to Applied Regression ‘car’ package [Citation34] for statistical testing. Normalisation of the cfDNA concentration data was performed according to the ‘bestNormalize’ package [Citation35]. The ‘sjPlot’ package [Citation36] was used to test model assumptions and extract model summaries. Boxplots and conditional scatterplots were computed using the ‘ggplot2’ package [Citation37] and ‘lattice’ package [Citation38], respectively.
Results
Patient characteristics
A total of 23 patients with NSCLC were included, of which relevant clinical and pathological features are presented in . The median age at diagnosis was 69 (range 65–75) and nine patients were female. The patient cohort covered the major histological subtypes of NSCLC, with TNM stages ranging from IIb to IVb. The majority of patients were current or former smokers.
Table 1. Baseline characteristics of the 23 NSCLC patients.
Variation in cfDNA concentration
Variation during the day and between days
Total cfDNA concentrations of all urine samples (n=138) were quantified by Qubit and compared within and between days by a linear mixed model approach. The cfDNA concentrations measured across the six different time points are shown in . No significant differences were found between the morning, afternoon, and evening, or between the two days. Parameter estimates and corresponding 95% confidence intervals and variance components are displayed in . The cfDNA concentration found in males was significantly lower as compared to females (p=0.034; Wald test). Age, weight, therapy during urine collection, survival, tumor stage, or tumor histology were not associated with the cfDNA concentration.
Table 2. Parameter estimates of cfDNA concentration in the urine of NSCLC patients measured across the different sampling time points according to the fitted linear mixed model corrected for sex.
Figure 1. Logarithmic representation of cfDNA concentrations (ng/mL urine) measured at different collection time points, illustrating the median and IQR of each collection time point. Outliers are indicated by bold circles located outside the whiskers of the boxplot. No significant differences were found within or between the days. cfDNA = cell-free DNA; IQR = interquartile range.
Between- and within-subject variation
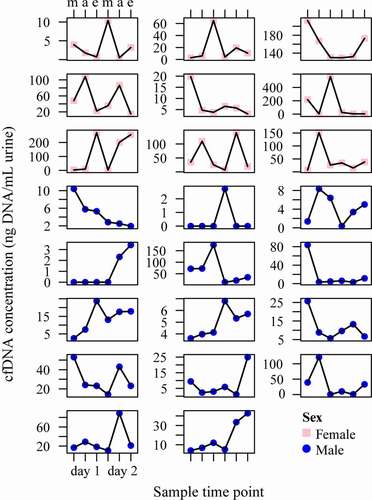
Similarly, the variation in cfDNA concentration was assessed at the individual patient level, as illustrated in . The ICC value was 0.49, meaning that 49% of the variance is due to variability between patients, and 51% of the variance can be explained by variability within patients. Parameter estimates of cfDNA concentrations measured over time are summarised in .
Figure 2. Conditional scatterplots displaying the between- and within-subject variability of the urinary cfDNA concentration of each NSCLC patient across the six sampled time points (m = morning, a = afternoon e = evening), stratified by sex (pink square = female, blue circle = male). cfDNA = cell-free DNA; NSCLC = non-small cell lung cancer.
Variation in methylation levels
Variation during the day and between days
DNA methylation levels of CDO1, SOX17, and TAC1 were measured in all urine samples (n=138) by qMSP (). Five urine samples were excluded from the analysis based on an ACTB Ct value of ≥ 32. The discriminatory power of the qMSP was verified by comparing methylation levels in 11 pairs of NSCLC and adjacent normal tissues (Supplementary Figure 1). Differences in time were assessed by a linear mixed model framework. None of the studied markers showed systematic differences in methylation levels during the day or between the two days (). Methylation levels found were independent of sex, age, weight, therapy during urine collection, survival, tumor stage, and tumor histology. For each marker, a significant association between methylation level and the cfDNA concentration was observed (p< 0.05; Wald test).
Table 3. Parameter estimates of DNA methylation levels of CDO1, SOX17 and TAC1 measured over time in urine samples of NSCLC patients according to the fitted linear mixed model.
Figure 3. Methylation levels of CDO1 (a), SOX17 (b), and TAC1 (c) measured in the urine of NSCLC patients at different collection time points illustrating the median and IQR of each collection moment. Methylation levels are normalized according to the reference gene ACTB and presented as square root Ct ratios. No significant differences were found within or between the days. IQR = interquartile range; NSCLC = non-small cell lung cancer.
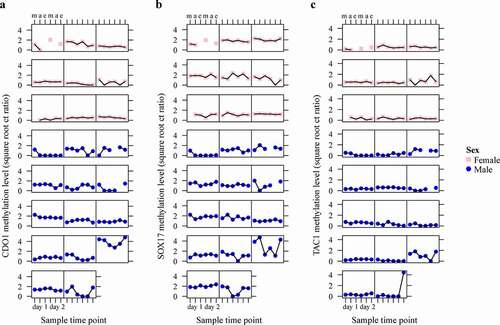
Figure 4. Conditional scatterplots displaying the between- and within-subject variability of CDO1 (a), SOX17 (b), and TAC1 (c) methylation levels of each patient across the six sampled time points (m = morning, a = afternoon e = evening), stratified by sex (pink square = female, blue circle = male). Missing data points indicate excluded urine samples with an ACTB value of ≥ 32.
Between- and within-subject variation
The variation of DNA methylation levels between and within individual patients is displayed in and was examined within the same linear mixed model with subject as a random effect. The ICC values of the markers CDO1, SOX17, and TAC1 were 0.74, 0.57, and 0.14, respectively (). This indicated that 26% of the variation observed in CDO1 methylation levels is due to variability within patients, as opposed to 43% for SOX17 and 86% for TAC1.
Model assumptions were not violated as indicated by diagnostic tests (Supplementary Material).
Prolonged urine sampling
To explore whether collecting multiple urine samples provides a more accurate test outcome, methylation levels of CDO1, SOX17, and TAC1 were also measured in urine samples of healthy controls (n=60). The control cohort had a median age of 69 (range 58–79) and 30 controls were female. The qMSP Ct values are provided in the Supplementary Data file. The discriminatory power of each marker was first evaluated when including six samples per patient and compared to the levels found in controls. Linear mixed models were used to correct for repeated measurements in the patient group. Significant differences in methylation levels of cases and controls were found for SOX17 (Wald test, p=0.030), and also TAC1 showed a trend towards significance (Wald test, p=0.059), both independent of age and sex ( and Supplementary Table s2).
Figure 5. Methylation levels of CDO1 (a), SOX17 (b), and TAC1 (c) measured in the urine of NSCLC patients (n=23) and healthy controls (n=60). Methylation levels are normalised to the reference gene ACTB and presented as square root Ct ratios. Case values represent the mean methylation level measured in the six collected urine samples. Outliers are indicated by bold circles located outside the whiskers of the boxplot. *p < 0.10 (suggestive evidence), **p < 0.05 (moderate evidence).
Next, only one urine sample of each patient was compared against the control group by random sampling. The results of 100 sampling rounds are summarized as median p-value. shows the discriminatory power (p-value) of each methylation marker between patients and controls when collecting one or six urine samples per patient. This comparative analysis indicated that the discriminatory power of TAC1 and SOX17 decreases when only one urine sample was taken into account, instead of six.
Table 4. Statistical differences of CDO1, SOX17 and TAC1 methylation levels between NSCLC patients (n=23) and healthy controls (n=60) when collecting one or six urine samples per patient.
Discussion
Insight into the dynamics of urinary cfDNA is essential to determine whether a preferred collection time and sampling frequency exist, and to correctly interpret molecular analyses. Analysis of the circadian variation of the cfDNA concentration in the urine of NSCLC patients revealed substantial variation between and within subjects, but no clear circadian pattern. Similarly, also for methylation levels of lung cancer markers no clear circadian pattern was found, whereas the biological variation was high.
Data of the current study suggests that the moment of urine collection does not significantly affect the urinary cfDNA concentration in NSCLC patients with active disease. Similarly, no day-to-day variation in urinary cfDNA concentration was found. So far, only the dynamics of cfDNA in plasma have been explored. Madsen et al. [Citation24]. reported similar results with stable cfDNA amounts in the plasma of lung cancer patients during the day and between days. Contradictory findings have been described for cfDNA concentrations in the plasma of healthy subjects. While constant cfDNA concentrations were observed by Wagner et al. [Citation23], other studies demonstrated a significant decrease during the day in healthy subjects [Citation24,Citation39]. Previous studies also did not find a day-to-day variation of cfDNA in plasma [Citation22,Citation24,Citation40], in line with the current findings. The only patient characteristic that influenced urinary cfDNA concentration levels in this study was sex, with a significantly higher concentration found in females, following previous studies [Citation41–43].
The proportion of between-subjects variation was expressed using the ICC value, where an ICC value of one indicates a perfectly reproducible test. Although the interpretation of the ICC value differs amongst studies, it has been suggested that ICC values below 0.50 reflect poor reproducibility, values between 0.50 and 0.75 moderate reproducibility, values between 0.75 and 0.90 good reproducibility, and values above 0.90 equal excellent reproducibility [Citation44]. The cfDNA concentrations measured in the six urine samples per patient showed between- and within-subject variability of comparable size, approaching a moderate reproducibility (0.49). In other words, both the baseline cfDNA concentration of each patient and the random fluctuation around this baseline contribute equally to the observed variation in cfDNA concentrations. Substantial between- and within-subjects variability has also been reported for serial measurements of cfDNA in plasma of healthy subjects [Citation23,Citation24].
Methylation levels of the CDO1, SOX17, and TAC1 genes were also not affected by the time of urine collection. This is in accordance with the stable detection of EGFR mutations in the plasma of lung cancer patients collected during three time points within one day [Citation45]. However, alternative results have been described for methylation of the SEPT9 gene in plasma samples of a small group of 11 colorectal cancer patients. The highest SEPT9 methylation levels were found at midnight, detecting all (pre)cancers included in the study, as compared to 77.7% of the cases during the other time points.
Methylation levels of CDO1 and SOX17 reached moderate to good reproducibility (0.74 and 0.57), while TAC1 showed poor reproducibility (0.14). The reproducibility of the markers seems to reflect the level of DNA methylation detected. TAC1 with the lowest ICC showed the lowest methylation levels of the three markers studied. Comparable variation within subjects has been observed for the mutant allele concentration of tumor-specific mutations in KRAS and P53 in the plasma of non-progressive lung cancer patients [Citation22]. From a patient monitoring perspective, the between-subject variation observed in this study implies that evaluating DNA methylation levels within individual patients, using longitudinal testing, may be more useful than using a dichotomous population-based threshold. Also, contrary to the moment of sampling, additional value was observed with collecting multiple urine samples for markers with the highest within-subject variability. This suggests that detecting lung cancer in urine will become more likely when multiple urine samples are being collected. Collecting urine at multiple time points has also been proposed by Lui et al. [Citation10]. who published the proof-of-concept study for lung cancer detection in urine by the analysis of methylated DNA. A previous study by Hubers et al. [Citation46]. indicated that prolonged sampling increased the sensitivity of lung cancer detection by methylation analysis in sputum, with a slight decrease in specificity. Other options to improve test accuracy would be to increase urine volume, as shown for bladder cancer detection in urine [Citation47], or to pool several urine samples before DNA isolation, as suggested for gene polymorphism analysis [Citation43]. The significant association found between the methylation levels of each marker and the cfDNA concentration of the urine sample indicates that adjusting the threshold of the reference gene, used for normalization and for excluding samples with insufficient DNA quality or quantity, could also increase the test reproducibility and accuracy.
The current study has several limitations. Due to the substantial biological variance observed, our sample size may have been too small to accurately address systematic changes of cfDNA concentration and methylation levels in time. Nonetheless, the total of 138 urine samples included is similar or even higher as compared to previous studies assessing the biological variation of cfDNA in plasma [Citation22–24]. Moreover, because this study only included patients with active disease, further studies are warranted to examine the biological variation of cfDNA in patients with early-stage or non-progressive disease. Apart from that, the variability of the current marker selection in the urine of healthy controls and individuals at risk for lung cancer (e.g., heavy smokers or patients diagnosed with chronic obstructive pulmonary disease) remains to be determined as no longitudinal sample sets of such subjects were available. This will provide essential information since biomarkers with small biological variability or even negative values in controls are clinically most useful for diagnostic and prognostic purposes. Detectable changes in such biomarkers will most likely reflect disease processes and not merely natural occurring variation [Citation48].
The strengths of the study include its relatively large sample size and the measurement of both cfDNA concentrations and DNA methylation levels of three genes at each collection time point. Moreover, the use of a standardised and reproducible urine processing protocol limited pre-analytical variance [Citation18]. Together with a sophisticated linear mixed modelling approach, this allowed an accurate estimation of the within- and between-subject variation of all analytes assessed in the current study. Furthermore, although not collected longitudinally, the inclusion of a representative control group enabled evaluation of the potential benefit of prolonged sampling.
In conclusion, no clear circadian pattern of methylated cfDNA in the urine of NSCLC patients was observed, implying that no preferred time of urine collection exists. Nevertheless, the observed between- and within-patient variation indicates that single methylation marker measurements should be interpreted carefully, and that collecting multiple urine samples may increase the chance of detecting lung cancer in urine. Improved understanding of the dynamics of urinary cfDNA provides a fundamental step towards the development of urine-based biopsies and their translation into clinical practice.
Contributors
SB, IB, and RS designed the study. SB and BW recruited patients, collected clinical samples and performed laboratory work. SB collected clinical data. JV, SH, and IB guided and provided the collection of clinical samples. RS supervised laboratory experiments. BW and MvdW carried out statistical analyses. BW and RS drafted the first version of the manuscript. All authors contributed to the interpretation of the data and revised the manuscript critically. SB, BW, and RS can verify the accuracy of all raw data in this study. Funding was acquisitioned by GK, IB, and RS. All authors approved the final version of the manuscript.
Supplemental Material
Download Zip (573.5 KB)Acknowledgments
The authors would like to thank the URIC biobank team for their assistance, and patients and their families for participating in this study.
Disclosure statement
RS has a minority stake in Self-screen B.V., a spin-off company of VU University Medical Center Amsterdam. SB, RS, IB, and GK are named inventors on patent applications related to the detection of methylated DNA in urine. All other authors have no conflict of interest to declare.
Supplementary material
Supplemental data for this article can be accessed here.
Additional information
Funding
References
- Siegel RL, Miller KD, Jemal A. Cancer statistics, 2020. CA Cancer J Clin. 2020;70(1):7–30.
- de Koning HJ, van der Aalst CM, de Jong PA, et al. Reduced lung-cancer mortality with volume CT screening in a randomized trial. N Engl J Med. 2020;382(6):503–513.
- National Lung Screening Trial Research T, Aberle DR, Adams AM, Berg CD, et al. Reduced lung-cancer mortality with low-dose computed tomographic screening. N Engl J Med. 2011;365(5):395–409.
- Pastorino U, Silva M, Sestini S, et al. Prolonged lung cancer screening reduced 10-year mortality in the MILD trial: new confirmation of lung cancer screening efficacy. Ann Oncol. 2019;30(10):1672.
- Herman JG, Farooq M. Noninvasive diagnostics for early detection of lung cancer: challenges and potential with a focus on changes in DNA methylation. Cancer Epidemiol Biomarkers Prev. 2020;29(12):2416–2422.
- Chen C, Huang X, Yin W, et al. Ultrasensitive DNA hypermethylation detection using plasma for early detection of NSCLC: a study in Chinese patients with very small nodules. Clin Epigenetics. 2020;12(1):39.
- Gaga M, Chorostowska-Wynimko J, Horvath I, et al. Validation of Lung EpiCheck, a novel methylation-based blood assay, for the detection of lung cancer in European and Chinese high-risk individuals. Eur Respir J. 2021;57(1):2002682.
- Hubers AJ, Heideman DA, Burgers SA, et al. DNA hypermethylation analysis in sputum for the diagnosis of lung cancer: training validation set approach. Br J Cancer. 2015;112(6):1105–1113.
- Hulbert A, Jusue-Torres I, Stark A, et al. Early detection of lung cancer using DNA promoter hypermethylation in plasma and sputum. Clin Cancer Res. 2017;23(8):1998–2005.
- Liu B, Ricarte Filho J, Mallisetty A, et al. Detection of promoter DNA methylation in urine and plasma aids the detection of non-small cell lung cancer. Clin Cancer Res. 2020;26(16):4339–4348.
- Ostrow KL, Hoque MO, Loyo M, et al. Molecular analysis of plasma DNA for the early detection of lung cancer by quantitative methylation-specific PCR. Clin Cancer Res. 2010;16(13):3463–3472.
- Yang Z, Qi W, Sun L, et al. DNA methylation analysis of selected genes for the detection of early-stage lung cancer using circulating cell-free DNA. Adv Clin Exp Med. 2019;28(3):355–360.
- Shen SY, Singhania R, Fehringer G, et al. Sensitive tumor detection and classification using plasma cell-free DNA methylomes. Nature. 2018;563(7732):579–583.
- Balgkouranidou I, Chimonidou M, Milaki G, et al. SOX17 promoter methylation in plasma circulating tumor DNA of patients with non-small cell lung cancer. Clin Chem Lab Med. 2016;54(8):1385–1393.
- Franovic A, Raymond VM, Erlander MG, et al. Urine test for EGFR analysis in patients with non-small cell lung cancer. J Thorac Dis. 2017;9(Suppl 13):S1323–S31.
- Kirkpatrick JD, Warren AD, Soleimany AP, et al. Urinary detection of lung cancer in mice via noninvasive pulmonary protease profiling. Sci Transl Med. 2020;12:537.
- Augustus E, Van Casteren K, Sorber L, et al. The art of obtaining a high yield of cell-free DNA from urine. PLoS One. 2020;15(4):e0231058.
- Bosschieter J, Bach S, Bijnsdorp IV, et al. A protocol for urine collection and storage prior to DNA methylation analysis. PLoS One. 2018;13(8):e0200906.
- El Bali L, Diman A, Bernard A, et al. Comparative study of seven commercial kits for human DNA extraction from urine samples suitable for DNA biomarker-based public health studies. J Biomol Tech. 2014;25(4):96–110.
- Ungerer V, Bronkhorst AJ, Holdenrieder S. Preanalytical variables that affect the outcome of cell-free DNA measurements. Crit Rev Clin Lab Sci. 2020;57(7):484–507.
- Braga F, Panteghini M. Generation of data on within-subject biological variation in laboratory medicine: an update. Crit Rev Clin Lab Sci. 2016;53(5):313–325.
- Hojbjerg JA, Madsen AT, Schmidt HH, et al. Intra-individual variation of circulating tumor DNA in lung cancer patients. Mol Oncol. 2019;13(10):2098–2106.
- Wagner JT, Kim HJ, Johnson-Camacho KC, et al. Diurnal stability of cell-free DNA and cell-free RNA in human plasma samples. Sci Rep. 2020;10(1):16456.
- Madsen AT, Hojbjerg JA, Sorensen BS, et al. Day-to-day and within-day biological variation of cell-free DNA. EBioMedicine. 2019;49:284–290.
- Lababede O, Meziane MA. The Eighth Edition of TNM staging of lung cancer: reference chart and diagrams. Oncologist. 2018;23(7):844–848.
- Teblick L, Van Keer S, De Smet A, et al. Impact of collection volume and DNA extraction method on the detection of biomarkers and HPV DNA in first-void urine. Molecules. 2021;26:7.
- Snellenberg S, De Strooper LM, Hesselink AT, et al. Development of a multiplex methylation-specific PCR as candidate triage test for women with an HPV-positive cervical scrape. BMC Cancer. 2012;12:551.
- Breuer RH, Snijders PJ, Smit EF, et al. Increased expression of the EZH2 polycomb group gene in BMI-1-positive neoplastic cells during bronchial carcinogenesis. Neoplasia. 2004;6(6):736–743.
- Breuer RH, Snijders PJ, Sutedja GT, et al. Expression of the p16(INK4a) gene product, methylation of the p16(INK4a) promoter region and expression of the polycomb-group gene BMI-1 in squamous cell lung carcinoma and premalignant endobronchial lesions. Lung Cancer. 2005;48(3):299–306.
- Bates D, Mächler M, Bolker B, et al. Fitting linear mixed-effects models using lme4. J Stat Softw. 2015;67(1):48.
- Fitzmaurice GM, Ravichandran C. A primer in longitudinal data analysis. Circulation. 2008;118(19):2005–2010.
- Ranganathan P, Pramesh CS, Aggarwal R. Common pitfalls in statistical analysis: measures of agreement. Perspect Clin Res. 2017;8(4):187–191.
- Ripley BD. Stochastic simulation. New York: Wiley; 1987.
- Fox J, Weisberg S. An R companion to applied regression. 2nd ed. Los Angeles: SAGE; 2011.
- Peterson RA, Cavanaugh JE. Ordered quantile normalization: a semiparametric transformation built for the cross-validation era. J Appl Stat. 2020;47(13–15):2312–2327.
- Lüdecke D. sjPlot: Data visualization for statistics in social science. The Comprehensive R Archive Network. 2019. https://CRAN.R-project.org/package=sjPlot.
- Wickham H. ggplot2: elegant graphics for data analysis. 2nd Edition, Springer, New York; 2009. Springer, New York. https://doi.org/10.1007/978-0-387-98141-3
- Sarkar D. Lattice: multivariate data visualization with R 2008.
- Meddeb R, Dache ZAA, Thezenas S, et al. Quantifying circulating cell-free DNA in humans. Sci Rep. 2019;9(1):5220.
- Xie J, Yang J, Hu P. Correlations of circulating cell-free DNA with clinical manifestations in acute myocardial infarction. Am J Med Sci. 2018;356(2):121–129.
- Streleckiene G, Reid HM, Arnold N, et al. Quantifying cell free DNA in urine: comparison between commercial kits, impact of gender and inter-individual variation. Biotechniques. 2018;64(5):225–230.
- Bach S, Paulis I, Sluiter NR, et al. Detection of colorectal cancer in urine using DNA methylation analysis. Sci Rep. 2021;11(1):2363.
- Chiarella P, Carbonari D, Capone P, et al. Susceptibility biomarker detection in urine exfoliate DNA. Biomark Med. 2017;11(11):957–966.
- Koo TK, Li MY. A guideline of selecting and reporting intraclass correlation coefficients for reliability research. J Chiropr Med. 2016;15(2):155–163.
- Wang J, Bai H, Hong C, et al. Analyzing epidermal growth factor receptor mutation status changes in advanced non-small-cell lung cancer at different sampling time-points of blood within one day. Thorac Cancer. 2017;8(4):312–319.
- Hubers AJ, Heideman DA, Herder GJ, et al. Prolonged sampling of spontaneous sputum improves sensitivity of hypermethylation analysis for lung cancer. J Clin Pathol. 2012;65(6):541–545.
- Zuiverloon TC, Tjin SS, Busstra M, et al. Optimization of nonmuscle invasive bladder cancer recurrence detection using a urine based FGFR3 mutation assay. J Urol. 2011;186(2):707–712.
- Aziz N, Detels R, Quint JJ, et al. Biological variation of immunological blood biomarkers in healthy individuals and quality goals for biomarker tests. BMC Immunol. 2019;20(1):33.