
 ?Mathematical formulae have been encoded as MathML and are displayed in this HTML version using MathJax in order to improve their display. Uncheck the box to turn MathJax off. This feature requires Javascript. Click on a formula to zoom.
ABSTRACT
Unlike genomes, which are static throughout the lifespan of an organism, DNA methylomes are dynamic. To study these dynamics, we developed quantitative models that measure the effect of multiple factors on DNA methylomes including, age, sex, weight, and genetics. We conducted our study in canids, which prove to be an ideal species to assess epigenetic moderators due to their extreme variability in size and well-characterized genetic structure. We collected buccal swabs from 217 canids (207 domestic dogs and 10 grey wolves) and used targeted bisulphite sequencing to measure methylomes. We also measured genotypes at over one thousand single nucleotide polymorphisms (SNPs). As expected, we found that DNA methylomes are strongly associated with age, enabling the construction of epigenetic clocks. However, we also identify novel associations between methylomes and sex, weight, and sterilization status, leading to accurate models that predict these factors. Methylomes are also affected by genetics, and we observe multiple associations between SNP loci and methylated CpGs. Finally, we show that several factors moderate the relationship between epigenetic ages and real ages, such as body weight, which increases epigenetic ageing. In conclusion, we demonstrate that the plasticity of DNA methylomes is impacted by myriad genetics and physiological factors, and that DNA methylation biomarkers are accurate predictors of age, sex and sterilization status.
Introduction
Domestic dogs (Canis lupus familiaris) and humans share a long and intertwined history, reflected by their roles as herders, hunters, guardians and companions. Domestication likely initiated 11,000–16,000 years ago [Citation1]. Domesticated dogs inhabit the same environments as humans and are influenced by similar shared factors including pollution and disease-causing microbes [Citation2,Citation3]. In addition, dogs and humans share many fundamental processes including those relating to development, disease susceptibility, behaviour patterns, and ageing [Citation3,Citation4].
While there have been myriad investigations into dog genetics and their relationships to multiple traits, significantly fewer studies have addressed the relationship between canid epigenetics and traits. DNA methylation is a covalent modification, which consists in the addition of methyl groups to the C5 position of cytosine, preferentially at CpG dinucleotides. It has been implicated in the regulation of gene expression and is generally regulated by the methylation of the fourth lysine of histone H3, which preferentially occurs at promoters and enhancers [Citation5]. DNA methylation can be measured using sodium bisulphite conversion, a well-established technique that can be used to profile the status of methylcytosines across the genome at single nucleotide resolution.
While genetics are fixed throughout the lifespan of an organism, DNA methylomes are dynamic, changing with age in a tissue-specific manner. Moreover, epigenomes are impacted by environmental and physiological states of organisms. For example, body mass index (BMI) and adiposity have been shown to have observable effects on DNA methylation [Citation6–8]. There is also a well-established relationship between methylation changes and ageing, which has led to the establishment of epigenetic clocks that predict the age of an individual based on their DNA methylation profile [Citation10]. However, it is thought that epigenetic clocks may advance at slightly different rates across individuals and there is great interest in the identification of factors that impact epigenetic ageing rates and lifespan.
Body size is one of the factors that has been reported to affect canine lifespan. One remarkable aspect of trait variability in dogs is the extreme variation noted in body size and weight between breeds. The genetic underpinning of that variation is well established, with a small number of loci driving much of the variability [Citation11]. Several studies have shown that body weight interacts with lifespan whereas larger breeds have shorter lifespans and generally age faster than smaller breeds [Citation13,Citation14]. Many breeds have, and continue to undergo strong human selection to meet breed standards set by registering bodies such the American Kennel Club (AKC). Additionally, dog lineages frequently reflect crosses between closely related individuals in an effort to maintain breed-defining phenotypes. However, such practices can negatively affect breed health and impact lifespan [Citation15]. Finally, the reproductive capability of a dog can have a significant impact on lifespan, and sterilization has been shown to increase longevity [Citation16].
In this study, we measure the impact of age, sex, weight and sterilization status on canid epigenomes and study moderators of epigenetic ageing. We carry out these measurements across several dozen breeds, and have also included a limited number of wolves. The DNA methylation profiles are measured using targeted bisulphite sequencing of DNA samples collected from buccal swabs. This approach also allows the extraction of genetic information and the identification of single nucleotide polymorphisms from a minimally invasive tissue collection procedure. We show that all of the above traits, along with a set of associated genotypes have significant impacts on canid epigenomes. We quantify these effects by developing several models that predict age, sex, sterilization status, etc. directly from methylation profiles, and show how ageing epigenetic biomarkers are in turn affected by other traits. These results demonstrate that the epigenome serves as a central molecular hub for the integration of genetic, physiological and environmental data.
Results
Canid Methylomes
We collected DNA from 207 dog buccal swab samples and ten wolf blood samples. From these samples we prepared targeted bisulphite sequencing libraries that profiled approximately five thousand loci across the genome. These loci were selected based on results from previous studies that showed their methylation was associated with age. The resulting bisulphite converted reads were aligned to the genome using a bisulphite aware aligner, and the alignment files were further processed to generate methylation matrices that measured the methylation of captured regions across our samples. Details of the samples, library preparation and data analysis are provided in the Methods section.
DNA methylation changes associated with age
To study age associated change in DNA methylation, we used two complementary approaches: the epigenetic clock and the epigenetic pacemaker. Epigenetic clocks have been constructed for multiple species to predict the age of an animal based on their methylation profile. These clocks are typically constructed using machine learning approaches that allow for the generation of robust age estimators. Here we used Least Angle Regression (LAR) to arrive at an age predictor that consists of a weighted sum of methylation sites. As the methylation data is high dimensional with over five thousand methylation measurements per sample, we used LAR to reduce the complexity of the search space. To avoid overfitting, we used leave-one-out cross-validation to build a separate model for each sample that is trained on all the remaining data once that sample has been excluded. We found that the resulting model is able to accurately predict the age of dogs and wolves to within an average error of approximately eight months (), although we noted that the predictions for wolves were worse than for dogs with a median absolute error of 2.5 years. Based on previous work, we also hypothesized that DNA methylation changes may not be linear with time, rather, methylation profiles may change more rapidly earlier in life. To account for such non-linearities, we trained a model for the square root of age which approximates a trend in which methylation changes more slowly with increasing age. However, we observe that the model trained on the square root of age slightly underperforms the linear model, with a median absolute error of eight and a half months ().
Figure 1. Epigenetic age and state of dogs. (a) Models generated using least angle regression (LARS). (b) LARS model of the square root of age. (c) Epigenetic Pacemaker was also used to predict epigenetic states, and the trend line was fit using three functions – linear, logarithmic, and square root.
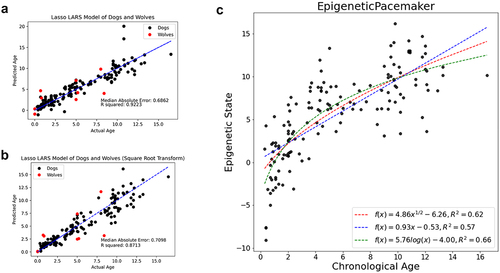
While epigenetic clocks are useful predictors of age, as the examples above demonstrate they require a priori assumptions about the functional form of age associated methylation changes. Our previous analysis suggests that the square root function may more accurately characterize age associated DNA methylation changes. However, it is of interest to identify this functional form in an unbiased fashion. To this end, we have previously developed the epigenetic pacemaker [Citation17]. This approach is distinct from an epigenetic clock, in that it attempts to model the time dependent changes in DNA methylation directly, rather than predict an age based on methylation levels. The underlying model is described by the following equation:
Here represents the methylation level of position i in individual j,
represents the methylation level at birth,
the rate of change of methylation with respect to an underlying epigenetic state
. The epigenetic state of each individual represents a position in the epigenetic trajectory of its lifespan. To solve the model, we use an expectation maximization approach in which we recursively estimate the epigenetic state, then
and
, and repeat the process until the model converges and minimizes the difference between the observed and predicted methylation values in our dataset. The advantage of this approach is that the relationship between the epigenetic state and age is not constrained and is optimized by the model. We previously found that a logarithmic function offers the best fit for the association of epigenetic age with actual age in humans when the dataset spans a very broad age range [Citation18]. Here, we find a similar result, with the logarithmic trend line best describing the relationship between the epigenetic state of dogs and their age (). This result suggests that the rate of DNA methylation change is constantly decreasing as an animal ages, and the rate of change is approximately inversely proportional to the age of the dog.
Effect of sex, sterilization and weight on DNA methylation
While many studies demonstrate a relationship between DNA methylation and age, the effects of other traits on methylation have been less well characterized. We first asked whether the methylome can distinguish male from female dogs. We trained a lasso logistic regression model on 139 dog samples, using leave one out cross validation, to test if methylation profiles accurately predict the sex of dogs. Not surprisingly, we found that such a model had nearly perfect performance and could accurately classify all but one dog (). We also asked whether certain sites in our methylome had a stronger influence on these models and found that the most informative sites were on the X chromosome (Supplementary Fig 1). Similarly, we carried out and Epigenome wide association (EWA) of methylation sites with sex and found that the most significant associations were on the X chromosome (Supplementary Fig 2, Supplementary Table I). This result supports the notion that the male and female X chromosomes are differentially methylated, likely due to chromosome inactivation of one of the X chromosomes in females [Citation19]. Indeed, this inactivation is associated with hypermethylation of the inactive X chromosome. Thus, the single male X chromosome has many differentially methylated loci when compared to the combined active and inactive female X chromosomes. This finding is concordant with a past study of dog and grey wolf methylation profiles across their genomes [Citation20]. We also tested whether the removal of sex dependent sites would improve the accuracy of our epigenetic clock but found that the model without sex chromosomes generated very similar results to the ones with all sites, suggesting that the sites selected by our epigenetic clocks are usually not on the X chromosomes as these do not show strong age associated changes in methylation (Supplementary Fig 3).
Figure 2. Epigenetics of sex, weight and spayed status. (a) Predicted sex values (labelled as Epigenetic Sex on the y-axis) were coloured based on the sample’s sterilization status into five categories: blue for not spayed, Orange for spayed, green for not neutered, red for neutered, and purple for missing values. A two-tailed t-test was performed separately for each sex, on the predicted values of fixed and intact samples. The hermaphrodite (intersex) wolf was not included in the t-tests. (b) The confusion matrix displays the number of correctly and incorrectly predicted spayed status for the female samples during the LOOCV process. The rows are the true sterilization status, while the columns are the predicted sterilization status by the SVM model. (c) The lasso model from sklearn is used to predict the weight of dogs.
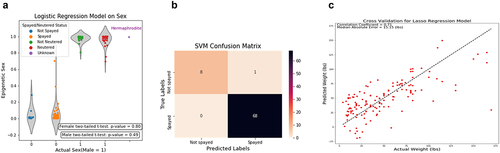
As our collection of dogs contained both sterilized (i.e., spayed or neutered) and intact dogs, we also tested whether the epigenetic sex prediction reported above were significantly different between the intact and sterilized dogs. Comparing the distributions of epigenetic sex values, we found no statistically significant differences between either male or female sterilized versus intact dogs (). This finding suggests that differential methylation at X chromosomes sites is not strongly influenced by hormonal levels that differ between sterilized and intact dogs However, we note that the variance of the sex prediction for sterilized dogs was significantly higher than for intact dogs (P < 1e-4 for a one-way F test), suggesting that there may be an increase in the variability of the methylation at sex specific sites in response to spaying or neutering.
Interestingly, one of the canids sequenced was an intersex grey wolf. Intersexuality occurs in domestic dogs but has also been described in wild grey wolves [Citation21,Citation22]. This individual reflected a rare discovery sampled via capture and handling efforts in the Yellowstone region, with over 1,200 individuals handled during the last Citation25years. Usually, we use the naming convention of a ‘M’ or ‘F’ behind the field ID number to denote sex, but this individual wolf received a ‘U’ for unknown sex. When this wolf was first captured and handled in January 2018, its age was estimated at 5–6 years. Although there was limited observational data for this wolf, there were a few documented facts. First, it travelled with a male packmate 1117 M and they seemed to act like a bonded male/female pair. Features of the intersex wolf included a vulva at the location where the preputial orifice would normally be located in a male and, it had an os penis, but no functional penis. The urinary system functioned like a female except that the vulva was on the belly rather than under the anus. It had one descended testicle in the scrotum while the other was retained in the abdomen. It also had a partially formed uterus, with a uterine horn on the right, half a uterine horn on the left, but no ovaries. Interestingly, the epigenetic sex prediction clearly classified this individual as a male. This result supports the notion that sex-specific hormonal and genitalia differences seem to have limited effects on epigenetic sex predictions.
Although the effects of sterilization on the epigenetic sex prediction seemed to be muted, we nonetheless asked if we could use the DNA methylation profiles to predict a dog’s sterilization status. To this end we trained a Support Vector Machine (SVM) on 77 female and 64 male dog samples using leave-one-out cross-validation. We found that while the SVM was unable to accurately predict the state of the males (supplementary Figure 4), it could very accurately predict the sterilization status of females (). We also carried out an analysis of associations of methylation values with sterilization status and identified two significant sites (Supplementary Figure 5, Supplementary Table II). One of these genes is NRG1 which has been reported to be regulated by oestrogen [Citation23], the other is SATB1, which has been associated with breast cancer in humans [Citation24]. This result may indicate that the female methylome is more susceptible to the hormonal changes induced by sterilization than a male methylome.
Lastly, we asked if the canid methylome is impacted by the weight of a dog. We used a similar approach as for age above, and constructed a penalized regression model for weight using leave-one-out cross-validation. We found that the weight of a dog could not be as accurately predicted as its age (). The model had a correlation coefficient of 0.7 and a median absolute error of 15 pounds. We noted that a few of the outliers were heavy breeds (> 150 lbs.) that are predicted to be of low weight during their first year of life, suggesting that the epigenetic weight of a dog may reach its final level only once the dog has reached adulthood. To test this observation, we trained a model on the weight times the square root of the dog’s age and found that it outperformed the previous model, supporting our notion that the effect of weight on the methylome may depend on age (Supplementary Fig 6). We also identified the loci whose methylation was most strongly associated with weight (Supplementary Figure 7, Supplementary Table III). Among these loci there were several proximal genes that had been associated with weight related phenotypes in previous studies: TFAP2B was significantly associated with body weight and height [Citation26], ADCY1 was significantly associated with IGF1 measurements, which in turn regulate body size [Citation27], C1QTNF7 was associated with brain stem volume [Citation28], and MBIP was associated with thyroid levels, which in turn affects body weight [Citation29].
Dog genetics and association with weight
While the focus of our study is on canid epigenetics, because we are sequencing DNA, we are also able to determine the genotypes of the dogs at the captured sites. Due to the nature of bisulphite converted DNA, some genotype information is lost at each cytosine, while it is preserved at other nucleotides. To circumvent this issue, we used a bisulphite-aware genotyping approach to extract the genotypes of all non-cytosine bases in the capture regions, which were then further refined to identify variable regions and SNPs. Using this approach, we identified approximately one thousand five hundred SNPs, or about one SNP for every three probes (see Methods).
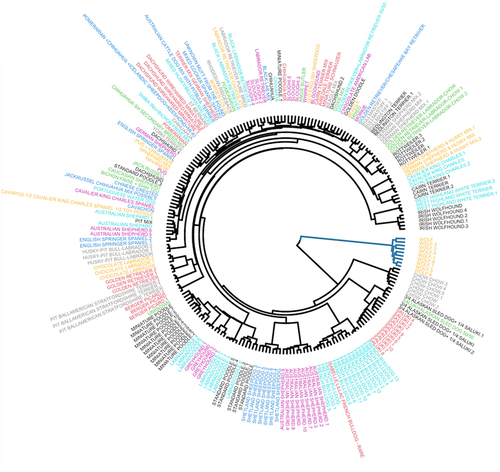
We used the SNP genotype data and constructed a phylogenetic tree of the samples (). We first noted that dogs of the same breed tended to group together, supporting our ability to correctly reconstruct breed relationships. Moreover, as expected, we observed that the wolves were an outgroup to the dogs. Among the dogs, we found that the chow-chow breed was the first diverged group from the grey wolves, followed by the saluki. These relationships are supported by previously published breed relationships based on SNP arrays [Citation32]. The remaining breeds resulted from more recent breeding and formed one large clade of several subclusters that represent functional breed groupings or history of breed formation.
Figure 3. Hierarchical tree and weight GWAS. Different breeds of dogs are shown on a hierarchical clustering tree based on their genotypes and each breed is assigned with a unique colour.
Among the traits measured only weight was considered to have a genetic component in our SNP data, as age, sex and sterilization status should not depend on genetics. We therefore conducted a genome wide association study (GWAS) to identify SNPs that are associated with weight (Supplementary Fig 8, Supplementary file 1). Only one SNP reached statistical significance after correction for multiple testing: chromosome 27: 45,420,051. The closest gene to this position is Hoxc6. This gene belongs to the homeobox family, members of which encode a highly conserved family of transcription factors that play an important role in morphogenesis in all multicellular organisms. However, this SNP has not been associated with dog weight in previous GWAS studies, but this may be due to the poor overlap between our limited number of target loci and the SNP panels on the existing arrays, and the fact that our study is likely underpowered with only 140 dogs.
Interactions between genotypes and DNA methylation
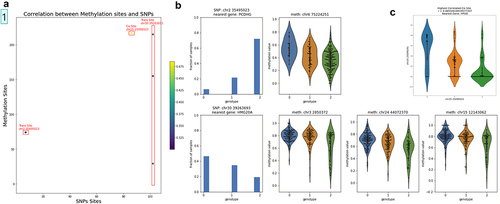
We next carried out an association study to identify significant correlations between genotypes and DNA methylation levels (). We identified only one significant cis association between the SNP at position CFA25:25,099,323 and the methylation of the probe at CFA25:25,099,291 (adjP<10−12; ). By contrast, we found four significant trans associations at a significance level of adjP<10−4 (). Of particular interest was the observation that only two SNPs were involved with the four significant associations, and that one of these SNPs marks a position that is a hotspot for DNA methylation regulation. The hotspot with the three associations was proximal to the gene encoding HMG20A (Supplementary Table IV). Although we do not have eQTL data, it is reasonable to assume that this SNP may influence the expression of this gene and that HMG20A in turn modulates DNA methylation levels via trans-regulation. HMG20A is a high mobility group (HMG) domain containing protein homologous to HMG20B, a core subunit of the Lys-specific demethylase 1/REST corepressor 1 (LSD1-CoREST) histone demethylase complex [Citation33, p. 20]. The LSD1 complex has been associated with the demethylation of H3K4 [Citation34]. Since de novo DNA methyltransferases are inhibited by H3K4me3 [Citation5], it is reasonable to assume that the regulation of the expression of HMG20A could affect the demethylation of H3K4 loci in trans and hence their DNA methylation levels.
Figure 4. Association of SNPs and methylation values in cis and trans. (a) SNPs were filtered for sites with variance greater than 0.3 and methylation sites were filtered for sites with variance greater than 0.02, resulting in 264 methylation sites and 118 SNPs. We identified 5 significantly correlated pairs of SNP and methylation sites using Pearson correlation and the Benjamini-Hochberg procedure with a false discovery rate of 0.1, only one of which is a cis pair. One SNP, at location chr30:39,263,693 is significantly correlated with three different methylation sites, all of which are trans. (b) Left-most column: histograms of genotypes across all samples for the two SNPs where significant trans correlations were found. Right 3 columns: violin plots of genotype vs methylation for the four significant trans correlations. Each row corresponds with one of the two SNPs that were found to have significant trans correlations. (c) Violin plot of genotype vs methylation values for the significant cis pair, which had a Pearson correlation coefficient of 0.485. The nearest gene to this cis pair is HPGD.
The effects of weight on epigenetic ageing
As shown above, variation in canid methylomes is associated with ageing, sex, weight, sterilization and genotypes. We next sought to determine whether the association between actual age and predicted age (or state) is moderated by these factors. To accomplish this, we generated linear models for both the epigenetic age and the epigenetic state using the other factors as moderators. We measured whether, for example, the epigenetic age could be modelled using the age of a dog plus the interaction between age and weight. We infer that any term other than age itself found to be significant in such models moderates the association between actual and epigenetic age. Using this approach we tested several moderators including weight, sex, sterilization, heterozygosity and runs of homozygosity.
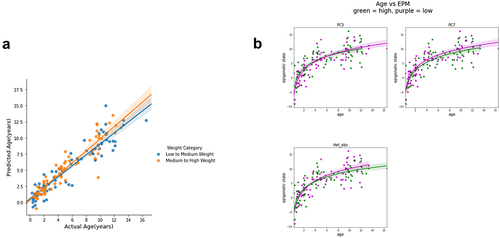
Of all of the factors we tested only weight significantly moderated the effect of age on epigenetic ageing (Supplementary Table V and VI). The effect of weight on epigenetic ages is illustrated in by dichotomizing the dog cohort into two groups based on weight and showing that they have different slopes, with the heavier dogs having the higher slope, or accelerated epigenetic ageing.
Figure 5. Weight moderates epigenetic age. (a) Weight values were sorted into the two categories, low-to-medium weight (blue) and medium-to-high weight (Orange), by using the median weight(42.3 lbs) as the cut-off, and the slopes of epigenetic age vs. actual age for the two weight groups are shown. (b) Age vs epigenetic state plots split by value of the 3 significant traits: PC5, PC7, and heterozygosity. The purple points are samples with values higher than the median and the green points are samples with values lower than the median.
To further investigate the influence of age and weight on DNA methylation we asked whether individual sites were affected by both age and weight. To answer this question, we used a multidimensional version of the Epigenetic Pacemaker, in which we allow more than one factor to impact the methylation of each site. We constructed a model with 196 sites, of which 90 were selected to be correlated with age, 88 with weight and 18 with sex (Supplementary Fig 9). We then fit the methylation of these sites using the multistate EPM (see Methods) and determined the age, weight and sex coefficients for each site. Finally, we generated a scatter plot of age and weight coefficients across these sites and found that most sites have non-zero coefficients for both age and weight, indicating that the methylation is influenced by both factors.
It is well documented that the lifespan of heavier breeds is shorter than small breeds dogs. This could be due to higher mortality rates associated with certain diseases. However, our result suggests that even at the molecular level, the methylation patterns of larger breeds show accelerated ageing compared to smaller breeds, and that at Citation12years heavier dogs have an epigenetic age acceleration of about two years compared to smaller dogs. Thus, it appears that the weight of dogs has a direct impact on the rate of epigenetic changes.
We conducted a similar analysis by modelling the factors that moderate the epigenetic state, rather than the epigenetic age. As described above, the epigenetic state is an estimate of the position of a dog along a time-dependent trajectory of DNA methylation that represents the entire lifespan of a dog. Unlike the epigenetic age which is a model that is optimized to predict the age of a dog, the epigenetic state is optimized to minimize the error in the predicted methylation levels of a limited number of sites that manifest age-associated DNA methylation level changes. In previous studies we have observed that the epigenetic state can be more impacted by external and internal factors than the epigenetic age [Citation35]. Consistent with this observation we find that the linear model of the epigenetic state has multiple significant genetic moderators including heterozygosity (see Methods) as well as two principal components of the genotypes (, Supplementary Table VII). Since we could not include individual SNPs in this analysis due to lack of statistical power to test over one thousand loci, we used principal component analysis to reduce the dimensionality of our genotype matrix. Using a greedy algorithm to find significant moderators of epigenetic states we identified two principal components, 5 and 7 (Supplementary Figure 10). Although it is often difficult to interpret these components, we did observe that component 7 was significantly anticorrelated with weight, and thus may be capturing weight dependent genetic effects (Supplementary Fig 11). The effects of these genetic moderators of the epigenetic state are shown in . These results further illustrate the interactions of the methylome, as characterized by the epigenetic state, with genetic factors.
Discussion
Unlike the four-letter sequence of germline DNA that is largely invariant across both spatial and temporal dimensions in an organism, the five-letter epigenetic code that includes methylcytosine shows great variability between cell types and during the lifespan of an organism. Changes in the methylome are driven by myriad signals that include environmental and physiological changes along with developmental programmes that are most influential early in life. Thus, unlike the genome, the methylome accumulates multiple changes during a lifespan and can be viewed as a historical record of an organism. Deciphering the factors that most strongly impact this record remains one of the central goals of epigenomics.
Most studies on ageing methylomes to date have been conducted on humans and have described associations between methylation, age and disease. Non-human studies have been carried out primarily in miceCitation31 and have many advantages over human studies as they can probe factors that influence ageing that are not easily accessible in humans. To this end, dogs are a valuable model organism for reconstructing the impact of environment and physiology on methylomes. The lifespan of dog breeds, which ranges from about a low of eight years through an average of 10–13 to a high of 18 is intermediate between that of humans and mice. Therefore, ageing timescales in dogs are much more similar to those of humans. Moreover, breeds show remarkable phenotypic plasticity compared to humans and are therefore ideal for studying the interactions between body size factors and DNA methylation. For example, the weight range for dog breeds varies by 40-fold, making it much larger than the range observed in human populations. Genetic variation between dog breeds and wolves likely represents approximately 20,000 years of evolution and domestication. While many modern dog breeds are genetically homogeneous, domestication followed by human driven selection has resulted in variants strongly associated with specific traits.
In this study we set out to measure the impact of age, sex, weight, sterilization and genetics, on the methylome in an attempt to characterize factors that influence the plasticity of the methylomes in canids. We profiled dog DNA from buccal swabs, as this tissue is easily accessible via non-invasive methods, and also included DNA from the blood of a small number of wolves in our study. Because of the ease of collection of buccal swabs our results should be easily validated and extended in future studies and possibly leading to DNA tests that can be offered to the public at large. However, our epigenetic age also accurately predicts the age of wolves, despite the fact that the DNA was extracted form blood instead of buccal swabs. Thus, the methods should be applicable also to studies of grey wolves where blood has been archived. Nonetheless, we acknowledge that the number of wolf samples is very limited in this study and our results serve as a proof of principle and do not allow us to systematically study differences in the epigenomes between dogs and wolves as was done in previous studies (Janowitz Koch et al., [Citation36].
To profile DNA methylation patterns, we used a targeted bisulphite sequencing approach. Despite rapid advances in the efficiency of DNA sequencing, it is still costly to generate whole genome bisulphite sequences for hundreds of samples. To reduce the sequencing depth needed, we designed a panel of probes that capture a few thousand loci in the genome. These were selected based on previous studies to identify loci whose methylation changes with age [Citation10]. We also included loci that are hyper conserved across mammals, as these have been shown to contain regulatory regions that are differentially methylated during development and between cell types [Citation37]. Although the panel we developed captures a very small faction of the CpG sites in the genome, they are strongly enriched for sites with variable methylation and are therefore suited for the study of factors that impact methylomes. Nonetheless, we acknowledge that the number of breeds contained in the data form these previous studies was limited, and therefore there is certainly an opportunity to expand the set of interesting CpGs as more DNA methylation datasets across a broad range dog breeds and ages become available.
In support of previous studies that investigated the changes in DNA methylation with age, we found that the age of a dog has a significant impact on its methylome. We were able to study the relationship between methylomes and ageing using two different approaches. In the first we built a model to predict the age of a dog from its methylation patterns and found that we could do so with an accuracy of approximately eight months. We also used a second approach called the Epigenetic Pacemaker, to directly model DNA methylation profiles in a time dependent fashion. This approach allows us to identify the epigenetic state of each individual along a trajectory that summarizes DNA methylation changes across a lifespan. With this approach we were able to confirm that DNA methylation changes are more rapid early in life and slow down as a dog ages, a trend that can be accurately approximated using a logarithmic function. Similar trends have also been observed in human studies [Citation18], and are consistent with the notion that DNA methylation changes rapidly during embryogenesis and childhood as the body shape of an organism is changing, and then slows down, but never stops changing as one ages. Other factors that may influence these trends is the progressive loss of certain cell types, such as stem cells or naïve lymphocytes, that occurs with exponentially decaying trends due to constant loss of a small percent of these cells throughout life.
We also find that DNA methylation profiles differs between males and females, and can be used to develop accurate predictors of sex. Similar sex predictors have also been constructed for humans and have proven to be highly accurate [Citation38]. Not surprisingly, most of the sites that contribute strongly to our sex prediction model are found on the sex chromosome. Females have two X chromosomes, one of which is epigenetically inactivated. The inactive sex chromosme has a distinct DNA methylation profile from the active one [Citation19]. Therefore, it is not surprising that the combination of the two female X chromosomes have slightly different DNA methylation patterns than the single male X chromosome. We were also able to test whether sex prediction using our DNA methylation-based classifier were influenced by sterilization. We found that the accuracy of predictions was not significantly impacted, but we did find a significant difference in the variance of the prediction for intact and sterilized animals, suggesting that sterilization does increase the variance of methylation in the sex chromosomes, even though the underlying patterns are still distinct between males and females. In support of this conclusion, we were able to train a classifier to predict sterilization, and found that we could accurately predict whether a dog was spayed, but not whether it was neutered. Thus, the hormonal changes induced by sterilization of females have significant impacts on the epigenome, even though sites that are differentially methylated between males and females are largely retained. The fact that we found more significant impacts from spaying than neutering might indicate that changes in female hormone state have a larger impact on the epigenome than changes in male hormone state, as has been observed in humans Citation30. We also examined the curious case of an intersex wolf. Despite this animal having both male and female genitalia, the epigenetic sex prediction model classified this individual as a male, further reinforcing the observation that epigenetic sex states are not strongly affected by hormonal changes that impact the development of genitalia.
We also find that the methylome of dogs is significantly influenced by their weight. By constructing an epigenetic predictor of dog weight, we are able to show that although not as accurately predicted as age, the epigenetic weight was very significantly associated with the weight, generating predictions with a median error of about fifteen pounds. Of interest was the observation that a few of the outliers in our model, whose epigenetic weight was significantly underpredicted, were less than one year old. As it is well known that the adult weight of a dog is not reached until after the age of one, this suggests that the effect of the adult weight on the epigenome may continue to change, even after the weight has stabilized.
Since both the weight and the age of the dog impact the epigenome, we also asked whether these two factors interact to moderate the association between real and epigenetic age. It is well established that the lifespan of heavier dogs tends to be shorter than smaller dogs [Citation39]. The lifespan of the smallest compared to the largest breeds can differ by a factor of two. There are many possible explanations for the effect of accelerated ageing in heavier breeds, and previous studies had suggested that there may be a corresponding increase in epigenetic ageing with dog weight [Citation10,Citation40]. In our cohort we observed that there was a significant association between epigenetic ageing rates and weight. As the accelerated ageing of large breeds is manifest in DNA methylation patterns, it appears to be an intrinsic molecular property of dog ageing rates. We still do not know why this is the case, but speculate that cellular ageing is accelerated in large dog breeds, thus leading to faster epigenetic ageing rates throughout a lifespan.
Although the epigenetic clock was only significantly affected by a dog’s age and weight, the epigenetic state of each dog proved to be influenced by multiple genetic factors. Since the epigenetic state is not trained to predict age, but rather attempts to model time dependent methylation changes, it is not surprising that this approach is more sensitive to genetic influences on the epigenome than an epigenetic clock. We found that two of the principal components that were derived from dog genotypes significantly interacted with age to modify the epigenetic state. One of these components, PC7, was also significantly associated with weight, and thus may capture some of the genetic variation that is related to breed size. Thus, the epigenetic pacemaker paradigm was able to capture multiple factors that interact with age to impact the epigenetic state of a dog, further demonstrating the complex link between genetics, and epigenetics.
In conclusion, we have shown that the epigenome of a dog is affected by myriad factors that can be identified using quantitative models of the age or of the methylation landscape itself. As the targeted bisulphite sequencing methodology we have developed allows us to extract both epigenetic and genetic information, this approach can be applied extensively across varied species to further elaborate interactions between epigenetics, genetics, physiology and environment. The quantitative modelling of these interactions will bring us closer to the ability to maximally extract information from the epigenome, so that we can complement static genetic data with dynamic epigenetic profiles to more fully characterize the phenotype of an organism from their DNA.
Materials and Methods
Canid Samples
A total of 217 DNA samples were collected from three different sources: 10 grey wolves were part of the Yellowstone National Park cohort. A total of 207 dogs were sampled from two populations. The first set of 151 dogs were sampled using buccal swabs purchased from DNA Genotek (Performagene PG-100 device). For each saliva sample the following details were collected: date of birth (accuracy to the month and year of the birth), breed, weight, sex, and spayed/neutered status. Samples from these dogs were collected with the owners’ signed consents. The samples were collected from dog parks and breeders and online volunteers who mailed in (Princeton IACUC approved protocol # 2098A).
The remaining 56 samples provided by the National Human Genome Research Institute (NHGR) of the National Institutes of Health were collected in accordance with all NHGRI Care and Use Protocols, with owner’s signed consent. Only samples of known breed and usually with AKC number were sampled for this study. Dogs were unrelated at the grandparent level. For each sample, age of the dog at collection, sex, breed, and was provided. A range of sizes and breed types (terriers, working dogs, spitz breed, etc.) were provided. Individual weights were not available on dog samples, hence breed standard weights were used based on American Kennel Club breed descriptions. Cheek swab samples were collected using PERFORMAgene kit (PG-100) from DNAGenotek and DNA was isolated according to the manufacturer instructions. Samples were stored at −80 degrees C. Some samples were provided by collaborating institutions.
We also analysed genomic DNA from 10 grey wolves (Canis lupus) from Yellowstone National Park . This population was founded in 1995 and 1996 when 41 individuals were reintroduced and has been heavily monitored since through annual capture/release seasons, daily telemetry, and direct (Princeton IACUC approved protocol # 2009A). Individual DNA was extracted from whole blood with the decimal age and sex of the individual known at the time of capture. All wolves were handled in accordance with recommendations from the American Society of Mammalogists (Sikes 2016) and approved by the National Park Service’s Institutional Animal Care and Use Committee. This population is genetically pedigreed and has been extensively studied with respect to social structure, reproduction, behaviour, disease, and genomics [e.g., Citation41–47].
All canid characteristics are described in Supplementary file 2.
Targeted Bisulphite sequencing
DNA was extracted from the buccal swabs using the vendor supplied protocol. Buccal swabs were incubated overnight at 50C degrees before DNA extraction.
We applied targeted bisulphite sequencing (TBS-seq) to characterize the methylomes of the 217 samples. The protocol is described in detail in [Citation48]. Briefly, 500 ng of extracted DNA were used for TBS-seq library preparation. Fragmented DNA was subject to end repair, dA-tailing and adapter ligation using the NEBNext Ultra II Library prep kit using custom pre-methylated adapters (IDT). Pools of 16 purified libraries were hybridized to the biotinylated probes according to the manufacturer’s protocol. Captured DNA was treated with bisulphite prior to PCR amplification using KAPA HiFi Uracil+(Roche) with the following conditions: 2 min at 98°C; 14 cycles of (98°C for 20 sec; 60°C for 30 sec; 72°C for 30 sec); 72°C for 5 minutes; hold at 4°C. Library QC was performed using the High-Sensitivity D1000 Assay on a 2200 Agilent TapeStation. Pools of 96 libraries were sequenced on a NovaSeq6000 (S1 lane) as paired-end 150 bases.
The probes used in the capture were designed using two criteria. We identified 2223 regions whose methylation was highly associated with age based on a previous study of canid methylomes using Reduced Representation Bisulphite Sequencing [Citation10]. The remaining 3573 probes were obtained from ultraconserved regions across mammals [Citation49]. The sequence of the probes used in this study can be found in Supplementary file 3.
Data Processing
Demultiplexed Fastq files were subject to adapter removal using cutadapt (v2.10) (Martin 2011) and aligned to the GRCh38 genome using BSBolt Align (v1.3.0) (Farrell et al. 2021). PCR duplicates were removed using samtools markdup function (samtools version 1.9) (Li et al. 2009) before calling methylation using BSBolt CallMethylation function. To generate the DNA methylation values for each probe region, we generated a weighted average of the methylation of CpGs within 100 bases of the probe centre, where the weights were determined based on sequence coverage. The methylation levels of each probe across each dog can be found in Supplementary file 4.
To generate genotype calls from the BAM files we first used the samtool pileup command to identify the aligned bases associated with each position within a probe. Due to bisulphite conversion, we ignored all positions that contained either cytosines or thymines and only retained positions that contained adenines and guanines. We then identified the associated genotype (either AA, AG or GG) based on the counts of each of the two bases, ignoring sites with coverage less than ten, and making heterozygous calls only for sites where the minor allele frequency was above ten percent.
Data Analysis
Sex Classifier – The machine learning model for predicting sex was trained using nested cross validation on the logistic regression model from scikit-learn. After removing samples with missing sex values and those that have high proportion of missing methylation values, there were 140 wolf and dog samples used for training. Methylation data were filtered so that sites with low coverage were removed, which left a total of 2420 sites. The hyperparameter tuning loop uses the LogisticRegressionCV function with 10-fold cross validation. The outer loop uses a leave-one-out cross-validation(LOOCV) method to predict the probability of each sample belonging to the two classes of sex when it’s in the test set, using the ‘predict_proba’ function implemented in scikit-learn’s logistic regression model.
Sterilization Classifier – To predict the sterilization status of the samples(separately for male and female samples), several models from scikit-learn were evaluated using LOOCV on 141 dog samples, such as ridge classifier, logistic regression, random forest classifier, and SVM. Methylation data were adjusted by removing sites with low-read, leaving a total of 2420 sites. For the male samples, the models performed poorly in predicting the intact samples. The best performance was achieved with the SVM model for females. A total of 77 female samples were used during the training process, with Citation9 intact and 68 spayed samples. To handle this imbalanced class distribution, the class_weight parameter in the SVM model was set to ‘balanced.’ A parameter grid was defined to tune the hyperparameters C and gamma. The values of C to be searched were 0.01, 0.1, 1, 10, and 100. The values of gamma to be searched were 0.001, 0.01, 0.1, and 1. The kernel parameter was set to the default ‘rbf’ kernel. Nested inside the leave-one-out cross-validation loop, the GridSearchCV function from scikit-learn was called to find the best parameter combination from the parameter grid defined above using a 10-fold cross-validation. The predicted class values were then retrieved and shown using a confusion matrix.
Epigenetic age prediction – Prediction of dog ages was generated using the Lasso LARS model from the scikit-learn machine learning package in Python (sklearn.linear_model.LassoLars). The methylation matrix was used as the predictor variable for the target variable of age, with and without square root transformation of age. Thirteen dogs were removed from the dataset due to high proportions of missing methylation values. The methylation sites were then filtered so that no missing values are retained. The matrix for generating predictions used 147 dogs from the two cohorts, excluding the wolves, and a total of 2358 methylation sites. Sklearn.model_selection.LeaveOneOut was used to generate individual predictions; each predicted dog represented the testing set and the training set were all other dogs.
Epigenetic Pacemaker – The Python package EpigeneticPacemaker (EpigeneticPacemaker.EpigeneticPacemaker) was used to generate predictions for each dog’s epigenetic state. The predictions relied on selecting methylation sites that were highly correlated with age, determined using the Pearson correlation coefficient. The minimum correlation threshold was set to be 0.6 which returned 124 sites. These sites were used to generate a plot of each dog’s predicted epigenetic state against their true age. Points were fitted to three possible trend lines – linear, logarithmic and square root – using Scipy (scipy.optimize.curve_fit).
We also utilized the Multistate Epigenetic Pacemaker (MSEPM), which is a multidimensional extension of the epigenetic pacemaker model. Under the EPM the methylation status of a single site can be modelled as mij = m0i + risj + εij. The MSEPM extends this formalism to multiple states where the observed methylation status for a single site is described by n epigenetic states, . Like the EPM, the MSEPM utilizes a conditional expectation maximization algorithm to first estimate the methylation site coefficients,
, and site intercepts m0i using ordinary least squares regression. The epigenetic states
are then updated using gradient descent with a residual sum of squares cost function across i modelled site coefficients for each n state. The optimization is finished when the difference between the observed and predicted methylation values between iterations is below a specified threshold or the maximum number of iterations is reached.
Moderation analysis – To identify factors that moderate the relationships between actual and predicted age we used linear models and computed the P value of each term. Multiple factors were tested in the Lasso LARS predictions of the epigenetic age model. We used 147 dogs to train the model. The moderators we tested were weight, sex (1 = female, 0 = male), sterilization (1 = sterilized, 0 = not sterilized), heterozygosity and inbreeding. The significance of each term was analysed using the Python package Statsmodels (statsmodels.regression.linear_model.OLS), with the matrix of factors input as the independent variables and the epigenetic age predictions as the dependent variable. The same approach was used to identify moderators of the epigenetic state.
Phylogenetic Tree – To generate the phylogenetic tree, the genotype matrix was first imputed using the R package ‘knncatImpute,’ which applies weighted k nearest neighbour. Next, the genetic distance was calculated by the method Nei Distance with the R package ‘NAM(Nested Association Mapping).’ Groups are generated using agglomerative hierarchical clustering analysis, using the ward.D method. Finally, the phylogenetic tree was drawn with the R packages ‘dendextend’ and ‘circlize.’
GWAS – Genome Wide Association Analysis was performed using the R package ‘statgenGWAS.’ The package implements the Generalized Least Square (GLS) method to generate the corresponding p-values. In this study, weight is the phenotype of interest, and the association score is calculated as the log_10(P-value). The resulting Manhattan plot was generated to visualize the significance of each SNP. To investigate the relationship between genotype and methylation we used the SciPy package pearson correlation function (scipy.stats.pearsonr) to find the correlation and p-values between SNPs and methylation sites. SNPs were filtered for sites with variance greater than 0.3 and methylation sites were filtered for sites with variance greater than 0.02, resulting in 264 methylation sites and 118 SNPs. We used the Benjamini-Hochberg procedure to find significantly correlated sites using a false discovery rate of 0.1, which identified 5 pairs as significantly correlated. The closest gene to each site in these 5 pairs were found using the UCSC genome browser (canFam4).
Heterozygosity – To investigate heterozygosity and runs of heterozygosity we utilized 1,656 SNP variants across 217 dogs using PLINK v1.90 [Citation50]. With the same SNP set, we estimated individual-level inbreeding coefficients (F) and runs of homozygosity (ROH) using the function detectRUNS v0.9.6 [Citation51] in R v3.6.0 as:
FROH = (∑LROH)/Lgenome
where LROH is the sum length of all ROHs detected in an individual and Lgenome is the length of the genome analysed. Due to the sparse density of SNPs across the genome, we used the consecutive window-free option [Citation52] and detected tracks up to 6Mb in length with the following parameters: minSNP = 10, ROHet = FALSE, maxGap = 109, minLengthBps = 100, maxOppRun = 1, maxMissRun = 1.
Supplemental Material
Download Zip (10.6 MB)Disclosure statement
No potential conflict of interest was reported by the author(s).
Data Availability Statement
The authors confirm that the data supporting the findings of this study are available within the article and its supplementary materials.
Supplementary material
Supplemental data for this article can be accessed online at https://doi.org/10.1080/15592294.2022.2069385
Additional information
Funding
References
- Freedman AH, Gronau I, Schweizer RM, et al. Genome sequencing highlights the dynamic early history of dogs. PLoS Genet. 2014;10(1):e1004016.
- Gilmore KM, Greer KA. Why is the dog an ideal model for aging research? Exp Gerontol. Aging in the Wild: Insights from Free-Living and Non-Model organisms. 2015;71:14–20.
- Sándor S, Kubinyi E. Genetic pathways of aging and their relevance in the dog as a natural model of human aging. Front Genet. 2019;10:10.
- Wang T, Ma J, Hogan AN, et al. Quantitative translation of dog-to-human aging by conserved remodeling of the DNA methylome. cels. 2020;11:176–185.e6.
- Fu K, Bonora G, Pellegrini M. Interactions between core histone marks and DNA methyltransferases predict DNA methylation patterns observed in human cells and tissues. Epigenetics. 2020;15(3):272–282.
- Mendelson MM, Marioni RE, Joehanes R, et al. Association of body mass index with DNA methylation and gene expression in blood cells and relations to cardiometabolic disease: a mendelian randomization approach. PLoS Med. 2017;14(1):e1002215.
- Shah S, Bonder MJ, Marioni RE, et al. Improving phenotypic prediction by combining genetic and epigenetic associations. Am J Hum Genet. 2015;97(1):75–85.
- Wahl S, Drong A, Lehne B, et al. Epigenome-wide association study of body mass index, and the adverse outcomes of adiposity. Nature. 2017;541(7635):81–86.
- Shi C, Zhang M, Tong M, et al. miR-148a is associated with obesity and modulates adipocyte differentiation of mesenchymal stem cells through wnt signaling. Sci Rep. 2015;5(1):9930.
- Thompson MJ, vonHoldt B, Horvath S, et al. An epigenetic aging clock for dogs and wolves. Aging (Albany NY). 2017;9(3):1055–1068.
- Plassais J, Kim J, Davis BW, et al. Whole genome sequencing of canids reveals genomic regions under selection and variants influencing morphology. Nat Commun. 2019;10(1):1489.
- Ponder KP, Melniczek JR, Xu L, et al. Therapeutic neonatal hepatic gene therapy in mucopolysaccharidosis VII dogs. Proc Natl Acad Sci U S A. 2002;99(20):13102–13107.
- Greer KA, Canterberry SC, Murphy KE. Statistical analysis regarding the effects of height and weight on life span of the domestic dog. Res Vet Sci. 2007;82(2):208–214.
- Kraus C, Pavard S, Promislow DEL. The size–life span trade-off decomposed: why large dogs die young. Am Nat. 2013;181(4):492–505.
- Yordy J, Kraus C, Hayward JJ, et al. Body size, inbreeding, and lifespan in domestic dogs. Conserv Genet. 2020;21(1):137–148.
- Hoffman JM, Creevy KE, Promislow DEL. Reproductive capability is associated with lifespan and cause of death in companion dogs. PLOS ONE. 2013;8(4):e61082.
- Farrell C, Snir S, Pellegrini M. The epigenetic pacemaker: modeling epigenetic states under an evolutionary framework. Bioinformatics. 2020;36(17):4662–4663.
- Snir S, Farrell C, Pellegrini M. Human epigenetic ageing is logarithmic with time across the entire lifespan. Epigenetics. 2019;14:912–926.
- Duncan CG, Grimm SA, Morgan DL, et al. Dosage compensation and DNA methylation landscape of the X chromosome in mouse liver. Sci Rep. 2018;8(1):10138.
- Koch IJ, Clark MM, Thompson MJ, et al. The concerted impact of domestication and transposon insertions on methylation patterns between dogs and grey wolves. Mol Ecol. 2016;25(8):1838–1855.
- Kang JT, Kim HJ, Oh HJ, et al. SRY-positive 78, XY ovotesticular disorder of sex development in a wolf cloned by nuclear transfer. J Vet Sci. 2012;13(2):211–213.
- Poth T, Breuer W, Walter B, et al. Disorders of sex development in the dog—Adoption of a new nomenclature and reclassification of reported cases. Anim Reprod Sci. 2010;121(3–4):197–207.
- Jeong W, Bae H, Lim W, et al. Differential expression of neuregulin 1 (NRG1) and candidate miRNA regulating NRG1 transcription in the chicken oviduct in response to hormonal changes. J Anim Sci. 2017 Sep;95(9):3885–3904.
- Hanker LC, Karn T, Mavrova-Risteska L, et al. SATB1 gene expression and breast cancer prognosis. Breast. 2011 Aug;20(4):309–313. 2010 Oct 25.
- Haskins ME, Desnick RJ, Diferrante N, et al. β-Glucuronidase deficiency in a dog: a model of human mucopolysaccharidosis VII. Pediatr Res. 1984;18(10):980–984.
- Richardson TG, Sanderson E, Elsworth B, et al. Use of genetic variation to separate the effects of early and later life adiposity on disease risk: mendelian randomisation study. BMJ. 2020 May 6;369:m1203
- Sinnott-Armstrong N, Tanigawa Y, Amar D, et al. Genetics of 35 blood and urine biomarkers in the UK Biobank. Nat Genet. 2021 Feb;53(2):185–194.
- Satizabal CL, Adams HHH, Hibar DP, et al. Genetic architecture of subcortical brain structures in 38,851 individuals. Nat Genet. 2019 Nov;51(11):1624–1636. Epub 2019 Oct 21.
- Taylor PN, Porcu E, Chew S, et al., UK0K. Consortium. Whole-genome sequence-based analysis of thyroid function. Nat Commun. 2015 Mar 6;6(1):5681.
- Thompson EE, Nicodemus-Johnson J, Kim KW, et al. Global DNA methylation changes spanning puberty are near predicted estrogen-responsive genes and enriched for genes involved in endocrine and immune processes. Clin Epigenetics. 2018;10(1):62.
- Thompson MJ, Chwiałkowska K, Rubbi L, et al. A multi-tissue full lifespan epigenetic clock for mice. Aging (Albany NY). 2018 Oct 21;1(10):2832–2854.
- Parker HG, Dreger DL, Rimbault M, et al. Genomic analyses reveal the influence of geographic origin, migration, and hybridization on modern dog breed development. Cell Rep. 2017;19(4):697–708.
- Rivero S, Ceballos-Chávez M, Bhattacharya SS, et al. HMG20A is required for SNAI1-mediated epithelial to mesenchymal transition. Oncogene. 2015;34(41):5264–5276.
- Kim S-A, Zhu J, Yennawar N, et al. Crystal structure of the LSD1/CoREST histone demethylase bound to its nucleosome substrate. Mol Cell. 2020;78(5):903–914.e4.
- Pinho GM, Martin JGA, Farrell C, Haghani A, Zoller JA, Zhang J, Snir S,Pellegrini M, Wayne RK, Blumstein DT, Horvath S,et al. Hibernation slows epigenetic aging in yellow-bellied marmots. Nat Ecol Evol . 2022 Apr;6(4):418-426. doi: 10.1101/2021.03.07.434299.
- Janowitz Koch I, Clark MM, Thompson MJ, et al.,
- Colwell M, Drown M, Showel K, et al. Evolutionary conservation of DNA methylation in CpG sites within ultraconserved noncoding elements. Epigenetics. 2018;13(1):49–60.
- Wang Y, Hannon E, Grant OA, et al. DNA methylation-based sex classifier to predict sex and identify sex chromosome aneuploidy. BMC Genomics. 2021;22(1):484.
- Michell AR. Longevity of British breeds of dog and its relationships with sex, size, cardiovascular variables and disease. Vet Rec. 1999;145(22):625–629.
- Lowe R, Barton C, Jenkins CA, et al. Ageing-associated DNA methylation dynamics are a molecular readout of lifespan variation among mammalian species. Genome Biol. 2018 Feb 16;19(1):22.
- Almberg ES, Mech LD, Smith DW, et al. A serological survey of infectious disease in yellowstone national park’s canid community. PLOS ONE. 2009;4(9):e7042.
- Cassidy KA, Mech LD, MacNulty DR, et al. Sexually dimorphic aggression indicates male gray wolves specialize in pack defense against conspecific groups. Behav Processes. 2017;136:64–72.
- Cubaynes S, MacNulty DR, Stahler DR, et al. Densitydependent intraspecific aggression regulates survival in northern Yellowstone wolves (Canis lupus). J Anim Ecol. 2014;83(6):1344–1356.
- Stahler DR, MacNulty DR, Wayne RK, et al. The adaptive value of morphological, behavioural and life-history traits in reproductive female wolves. J Anim Ecol. 2013;82(1):222–234.
- vonHoldt BM, DeCandia AL, Heppenheimer E, et al. Heritability of interpack aggression in a wild pedigreed population of North American grey wolves. Mol Ecol. 2020;29(10):1764–1775.
- vonHoldt BM, Stahler DR, Bangs EE, et al. A novel assessment of population structure and gene flow in grey wolf populations of the Northern Rocky Mountains of the United States. Mol Ecol. 2010;19(20):4412–4427.
- vonHoldt BM, Stahler DR, Smith DW, et al. The genealogy and genetic viability of reintroduced Yellowstone grey wolves. Mol Ecol. 2008;17(1):252–274.
- Morselli M, Farrell C, Rubbi L, et al. Targeted bisulfite sequencing for biomarker discovery. Methods. 2021;187:13–27.
- Faircloth BC, McCormack JE, Crawford NG, et al. Ultraconserved elements anchor thousands of genetic markers spanning multiple evolutionary timescales. Syst Biol. 2012;61(5):717–726.
- Chang CC, Chow CC, Tellier LC, et al. Second-generation PLINK: rising to the challenge of larger and richer datasets. GigaScience. 2015;4:4.
- Biscarini F, Cozzi P, Gaspa G, et al. detectRUNS: detect runs of homozygosity and runs of heterozygosity in diploid genomes. Undefined. 2018. https://cran.r-project.org/web/packages/detectRUNS/vignettes/detectRUNS.vignette.html
- Marras G, Gaspa G, Sorbolini S, et al. Analysis of runs of homozygosity and their relationship with inbreeding in five cattle breeds farmed in Italy. Anim Genet. 2015;46(2):110–121.