
 ?Mathematical formulae have been encoded as MathML and are displayed in this HTML version using MathJax in order to improve their display. Uncheck the box to turn MathJax off. This feature requires Javascript. Click on a formula to zoom.
ABSTRACT
Smoking and Heavy Alcohol Consumption (HAC) are established risk factors for myriad complex disorders of ageing. Yet many prior studies of Epigenetic Ageing (EA) have shown only modest effects of smoking and drinking on accelerated ageing. One potential reason for this conundrum might be the reliance of some prior EA studies on self-reported substance use, which may be unreliable in many samples. To test whether novel, non-self-reported indices would show a stronger association of smoking and HAC to EA, we used methylation sensitive digital PCR (MSdPCR) and data from 437 African American subjects from Wave 7 of the Family and Community Health Study Offspring Cohort to examine the effects of subjective and objective measures of smoking and HAC on 7 indices of EA. Because of limited overall correlations between the various EA indices, we examined patterns of association separately for each index. Consistent with expectations, MSdPCR assessments of smoking and HAC, but not self-reported alcohol consumption, were strongly correlated with accelerated EA. MSdPCR assessments of smoking and HAC accounted for 57% of GrimAge acceleration and the shared variance in GrimAge and DunedinPOAM accelerated EA. We conclude that MSdPCR assessments of smoking and HAC are valuable tools for understanding EA, represent directly targetable conditions for the prevention of premature ageing, and substantially improve upon self-reported assessment of smoking and HAC.
Introduction
Over the past decade, Epigenetic Ageing (EA) indices have emerged as a popular mechanism through which to examine the relationship of stressors, supports, and health behaviour on morbidity and mortality. The concept of EA was first introduced by Fraga and colleagues in 2005 [Citation1], and interest in EA began to accelerate with the introduction of the Hannum and Horvath indices of EA in 2013 [Citation2,Citation3]. Since then, numerous groups have introduced indices of EA focused on a range of biological outcomes in addition to chronological age, which was the focus of the initial EA measures, leading to considerable interest in determining the relative utility of each of these measures[Citation4]. In principle, EA measures should help identify risk and protective factors that would translate into guidance for the development of prevention programmes, with the expectation that findings based on more recent indices such as DunedinPOAM, DunedinPACE, or GrimAge should be particularly useful because they are designed to capture multi-system accelerated ageing and death, respectively. In addition, some EA measures have been introduced as direct-to-consumer measures for guiding health care[Citation5]. However, their performance as clinical tools has yet to be rigorously examined [Citation6,Citation7].
As measures of EA become more widely utilized in investigations of health outcomes, it has been noted that some commonly accepted risk factors show a different pattern of association with EA than with more generally accepted outcome measures. In particular, decades of studies have established smoking and excessive alcohol consumption as the first and third leading non-COVID19 related, preventable causes of premature morbidity and mortality [Citation8–10]. Despite this, a recent meta-analysis of studies of Epigenetic Ageing (EA) has shown only modest, if any, effects of smoking and drinking on EA indices of accelerated ageing and mortality[Citation4]. This lack of agreement with prior more conventional forms of epidemiological research has occasioned some controversy, potentially undermining confidence in current EA measures, or in the need for ongoing public health efforts to combat smoking and excessive alcohol consumption.
We propose that a potential reason for the lack of agreement between findings regarding the effect of smoking and excessive alcohol consumption on mortality and accelerated ageing in the more traditional medical literature vs. those derived from analyses using EA indices may be differences in the way smoking and excessive alcohol consumption are characterized. Traditional mortality estimates, particularly those conducted by the United States Department of Health and Human Services [Citation8,Citation11], typically assess smoking through a complex set of methods that includes biochemical verification to address potential underreporting [Citation12]. Likewise, the effects of alcohol on mortality use similar methods to address underreporting and are aided by government and healthcare system assessments of the role of alcohol in motor vehicle crashes and personal injuries[Citation13].
In contrast, objective quantification of cigarette and alcohol consumption in the large epidemiological studies used to examine the effects of smoking and HAC on EA is often lacking. For example, in the Framingham Heart Studies (FHS), all data with respect to alcohol and cigarette consumption for Wave 8 of the study, i.e., the wave at which epigenetic data is used in the construction of some recent EA indices, are self-reported [Citation14]. This creates a broad divergence in methods that could account for the apparent discrepancy in the impact of smoking and drinking on health outcomes between studies using more traditional outcomes and those using indices of EA. If self-report data are inaccurate or substantially underestimate the use in the sample, the observed associations with the resulting EA indices may be artificially suppressed. There is considerable reason for concern that this may happen in many samples. Although only 8% of FHS subjects whose DNA received genome-wide DNA methylation profiling self-reported current smoking at Wave 8, over 50% had probe-based assessment of cg05575921 methylation, a generally accepted biomarker of smoking, in the range suggestive of current and/or past smoking[Citation15]. Combined with prior studies, which show high rates of unreliable self-report of smoking, [Citation16–21] we believe that there is considerable reason to be concerned that underreporting could affect conclusions regarding the relationship of smoking and excessive alcohol consumption to accelerated EA, creating apparent inconsistencies in the literature.
New methylation digital PCR (MSdPCR) assays for assessing cigarette smoking and HAC may be useful for clarifying the relationship of substance use to accelerated ageing. Over the past several years, using a large number of well-characterized, biochemically verified subjects, we have developed MSdPCR assays capable of quantifying cigarette consumption and detecting the presence of HAC [Citation22–27]. The smoking assay, which assesses methylation at cg05575921, has an area under the curve (AUC) of 0.984 for detecting daily smoking and a dose-dependent demethylation response to increasing cigarette consumption that allows quantification of daily cigarette consumption [Citation26,Citation27]. Critically, because cg05575921 is not affected by non-combustible use of nicotine containing products, it is relatively specific for smoking [Citation28–30]. The Alcohol T Score (ATS) uses MSdPCR assessments of four loci to provide a metric predictive of HAC[Citation22]. This tool has an AUC of 0.96 for HAC and in direct blinded head-to-head comparisons, markedly outperforms assays of Carbohydrate Deficient Transferrin (CDT) – the current gold standard for detecting HAC [Citation31] – when predicting HAC[Citation23]. Further, because the MSdPCR assays are reference free, unlike array-based assays, they can be used to provide objective assessments of substance use in any sample without concern about the well-documented effects of probe normalization or DNA quality on the accuracy of methylation status [Citation32–35].
In this communication, we present the results of our subjective and objective assessment of smoking and alcohol consumption in subjects who participated in the seventh Wave of the Family and Community Health Study (FACHS). We then analyse the relationship of smoking and excessive alcohol consumption with EA as assessed by seven commonly used EA indices and examine associations with common variance in EA for rate of multi-systemic ageing and mortality using GRIM and DunedinPOAM, the two measures of EA that were most highly correlated.
Methods
All protocols and procedures used in this study were approved by Institutional Review Boards at the Universities of Connecticut, Georgia, and Iowa (IRB 201901770). The data presented herein are from the Offspring Cohort of Wave 7 (2015–16) of (FACHS-T) at the time of epigenetic assessment based on a blood draw.
Clinical data
The overall design and methods used in the FACHS-T study have been described previously[Citation36]. In brief, in Wave 7, after obtaining consent, each subject was interviewed with a structured interview that reviews key stressors and health variables, and then, s/he was phlebotomized to provide biomaterial for laboratory analyses. For the purposes of this study, smoking status was determined by asking the question ‘how many cigarettes have you smoked in the last 3 months?’ Those answering none were coded as non-smokers. Finally, HAC was determined by asking the question ‘During the past 12 months, how often have you had a lot to drink – that is 3 or more drinks at one time?’ Those answering one or more times per week were classified as unhealthy drinkers. Finally, the use of other combustible or non-combustible forms of tobacco containing products was assessed via two questions. The first question asked of respondents was as follows: ‘how many cigars, cigarillos, filtered cigars, tobacco-filled pipes, or bowls of hookah have you smoked during the past month?,’ while the second was ‘how many times have you used snus, dissolvable tobacco, moist snuff, dip, spit or chew during the past month?.’
Subjects were not required to answer all questions and were instructed to skip questions that they did not feel comfortable answering. Furthermore, sera or DNA may have been unavailable for certain subjects. As a result, the total number of responses or assessments for any given question or assay may be less than the total number of subjects included in these analyses.
Molecular data
Following clinical assessment, each of the subjects was phlebotomized to provide biomaterial for these studies. After processing into DNA and serum via our usual procedures, the samples were stored at −20°C and −80°C, respectively[Citation26].
ELISA
Enzyme-linked immunoassay (ELISA) assessments of serum cotinine were conducted using kits from AbNova (Taiwan) using our standard procedures [Citation26,Citation37]. Cotinine levels of 2 ng/ml or greater were regarded as evidence of current tobacco or cannabis use.
DNA methylation
Genome-wide DNA methylation assessments were conducted by the University of Minnesota Genome Center (http://genomics.umn.edu/) using the Infinium MethylationEpic Beadchip (Illumina, San Diego) according to the manufacturer’s protocol. The resulting IDAT files were securely transferred, and the data DASEN normalized using the MethyLumi [Citation38], WateRmelon [Citation39] and IlluminaHumanMethylationEPICanno.ilm10b2.hg19 [Citation40] R packages as per our previous protocols [Citation41]. Sample and probe-level quality control of the data were then conducted as previously described [Citation41]. In brief, samples were removed if more than 1% of their probes had detection p values of >0.05. Overall, data from 858,924 of the 866,091 probes in the array were retained.
Beta values for each site were calculated using the standard formula where U and M are the values of the unmethylated and methylated intensity probes (averaged over bead replicates) and α = 100 is a correction term to regularize probes with low total signal intensity [Citation42,Citation43].
This communication features the use of seven Epigenetic Ageing indices. The Hannum index, as it is commonly referred to, was the first index published and consists of 71 CpG probes [Citation3]. The Horvath Index was introduced 1 month later and consists of 353 CpG markers [Citation2]. Both of these indices correlate strongly with chronological age. The PhenoAge index, which was also derived by a consortium led by Levine and Horvath, was first described in 2018 and contains 513 markers that were developed using clinical measure and age so that PhenoAge would better predict individual differences in morbidity [Citation44]. In 2019, another Horvath led group introduced GrimAge, which relies on the input from 1030 CpG probes that forecast time-to-death due to all-cause mortality [Citation45]. The same year, the Horvath group also introduced the Telomere algorithm, which uses the input from 140 CpG sites to estimate the telomere length in kilobases (Kb), which in turn is associated with ageing[Citation46]. Finally, over the past 2 y, a group of investigators associated with the Dunedin Study introduced first the DunedinPOAM (2020), and then the DunedinPACE (2022) algorithms [Citation47,Citation48]. The DunedinPOAM, which consists of 46 CpG probes, and DunedinPACE, which includes 173 CpG sites, reportedly provide a ‘speedometer’ of ageing designed to reflect physiological change over the past 12 months, with values greater than one indicating accelerated biological ageing The values for the Hannum, Horvath, Levine, GrimAge, the GrimAge metric for calculating lifetime cigarette consumption (DNAmPACKYRS) and Telomere metrics were calculated using the publicly available online tool hosted by the Horvath Lab at the University of California Los Angeles (https://dnamage.genetics.ucla.edu/). The values for the DunedinPOAM and the DunedinPACE indices were calculated using the code supplied by the developers at https://github.com/danbelsky. Epigenetic age acceleration for Horvath, Hannum, PhenoAge, and GrimAge indices was calculated by using the unstandardized residual scores from the regression of epigenetic age on chronological age.
Adjusting for cell composition
Cell-type composition was estimated using the ‘EstimateCellCounts’ function in the ‘minfi’ Bioconductor package, which is based on thereference-based method developed by Houseman and colleagues [Citation49]. Using this approach, cell-type proportions in whole blood for CD4 + T cells, CD8 + T cells, natural killer cells, B cells, and monocytes were estimated. These cell-type proportions were then used to examine whether associations between DNAm-based ageing measures and predictors free of potentially confounding cell-type variation influence.
Methylation sensitive digital PCR (MSdPCR) assessment of cg05575921 methylation, a generally accepted biomarker of smoking, and Alcohol T Score (ATS), a recently introduced measure of Heavy Alcohol Consumption (HAC) were conducted using the same samples of DNA used in the conduct of genome-wide DNA methylation analyses [Citation22,Citation23,Citation27,Citation50]. The determination of DNA methylation at cg05575921 and the four loci (cg02583484, cg04987734, cg09935388, and cg04583842) used to form the Alcohol T Score (ATS) was conducted using primer probe sets from Behavioural Diagnostics (Coralville, IA) and both droplet digital PCR reagents and equipment from Bio-Rad (Hercules, CA) according to our previously described protocols [Citation26,Citation27]. Status at cg05575921 is expressed as ‘% methylation,’ with levels of <80% being strongly predictive of smoking [Citation27]. In contrast, the ATS, which is a summation of four z-scores of four loci (cg02583484, cg04987734, cg09935388, and cg04583842), is a zero-centred metric in abstinent populations [Citation22,Citation23]. Increasing values of the ATS are predictive of increasing alcohol consumption with ATS values of 3.5 and 5 being suggestive and predictive of HAC (6 or more drinks per day) [Citation23,Citation51].
Other data analysis
Data were analysed using JMP version 16 (SAS Institute, Cary, SC). Comparisons between groups with respect to continuous variables were conducted using Student’s T-tests and Regression. All reported R2 values are adjusted for the number of predictors and sample size. Please note that because complete serological, self-report, or methylation data may not be available for all subjects, the exact number of data points for each analysis examined may vary.
Results
The key demographic and self-report data for smoking and alcohol use are given in . In brief, N = 437 participants provided complete genome-wide methylation data and self-reported measures at Wave 7, 63% of whom are female. The age distribution of both males and females is tightly clustered around 29 y of age. Overall, 22% of the subjects reported smoking cigarettes in the past 3 months. Consistent with national trends, more males (26%) self-reported smoking cigarettes than females (20%). The use of forms of combustible tobacco such as cigars and cigarillos over the past month was also commonplace with 25% of males and 17% of females reporting use. But as opposed to cigarettes, which when used tend to be consumed frequently, 45% (43 of 96) of the subjects reported using cigars or cigarillos only once or twice in the past month. Co-use of cigarettes and other combustible forms of tobacco was frequent with 45 of the 96 subjects (47%) reporting other tobacco smoking also reporting smoking cigarettes. In contrast, the use of snus, chew, and other non-combustible forms of tobacco during the period of ascertainment (2014–2016) were infrequent.
Table 1. Wave 7 demographic and self report data.
Interestingly, more females (20%) than males (16%) reported the use of cannabis in the past year. Finally, using an operational definition of unhealthy or binge drinking as consuming three or more drinks at one sitting, over 54% of the sample denied unhealthy drinking in the past year. The majority of those who reported binge drinking reported binge drinking only once or twice over the past year. However, 39 subjects reported unhealthy drinking at least once a month, with 8 subjects reporting unhealthy drinking more than 2 times per week.
A summary of the results from the objective assessments of ageing and substance use is given in . The means of the four EA indices designed to provide a biological age, Hannum, Horvath, PhenoAge, and GrimAge, are all significantly different from the actual chronological age (paired t, all p < 0.0001). The Hannum and PhenoAge average slightly less than the chronological age 28.7 ± 0.8 y, while the average Horvath (35.9 ± 4.0) and GrimAge (44.9 ± 4.4) are 7 and 16 y greater. The results from the serum cotinine assessments demonstrate the frequent recent use of nicotine containing products. In contrast to the modest levels of self-reported smoking in the past 3 months (i.e., 20%), 52% of all serum samples were positive for cotinine, a key metabolite of nicotine. There was a marked gender difference in the distribution of cotinine values with 64% of males but only 45% of females having serum concentrations of 2 ng/ml or higher. Overall, 99 of these 214 serum-positive subjects did not report any tobacco product. Finally, the average levels of cg05575921, a generally accepted epigenetic measure of combustible tobacco use[Citation50], and ATS values, a newly-developed epigenetic index of alcohol use, are consistent with the ELISA findings and show that the overall consumption of cigarettes and alcohol are higher in males than females.
Table 2. Epigenetic ageing indices and objective measures of tobacco, cannabis, and alcohol use.
The distribution of the cg05575921 and ATS values in the FACHS T population is illustrated in with supplemental Figures 1 and 2 providing the same methylation data stratified by self-report status for smoking and drinking. Nearly 60% of females (158 of 269) have cg05575921 levels of 80% or higher suggestive of non-smoking status. In contrast, only 37% of males (59 of 165) have cg05575921 levels of 80% or more. Low methylation levels are highly associated with the current use of nicotine containing combustible products with approximately 90% of those with cg05575921 levels of <80% (180 of 203) having positive cotinine tests. Alarming numbers of both the male and female subjects have cg05575921 levels of 47% or less, which indicates a pack or more per day of current cigarette consumption.
Figure 1. The distribution of cg05575921 values in female and male subjects. In non-smoking subjects, the average cg05575921 value is 86.6% ± 2.9 with progressive demethylation occurring as a function of increased daily cigarette consumption.
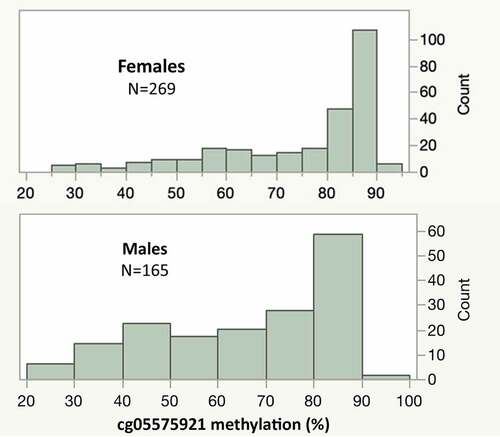
Figure 2. The distribution of alcohol T-scores (ATS) in male and female subjects. The mean of the ATS score is zero with increasing values representing increasing daily consumption of alcohol. Values higher than 3.5 (black arrow) are highly indicative of Heavy Alcohol Consumption.
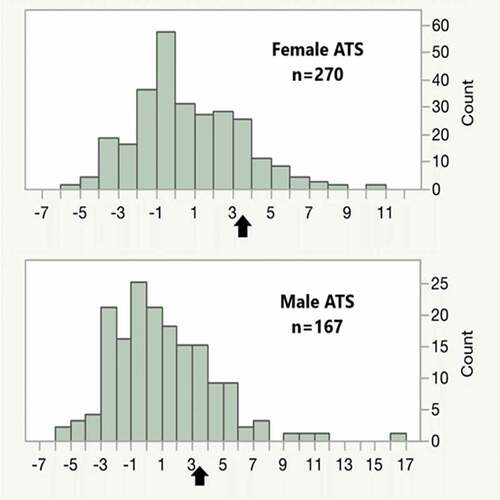
A similar pattern of greater skewing of ATS values in males is also seen in . The average ATS is zero in abstinent individuals with increasing amounts of current daily alcohol consumption being positively associated with ATS. Although most subjects have values less than 2, a significant number of subjects (N = 74; 17%), particularly males (N = 41), have ATS values of 3.5 or greater, which is indicative of current HAC. Consistent with prior findings, cg05575921 and ATS values are strongly correlated (r = −0.58).
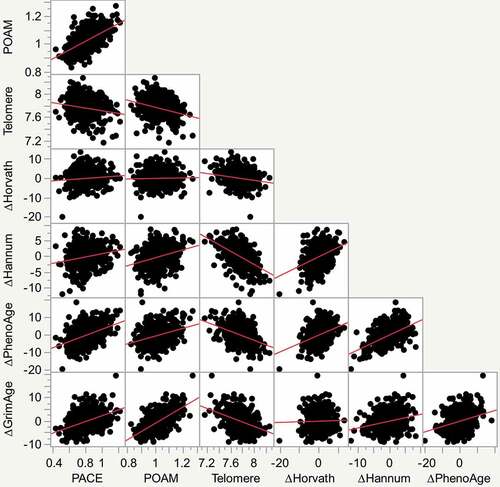
Pearson correlation coefficients for the relationship of the various EA indices to each other are given in while a scatterplot matrix of the relationships is given in . The Hannum index has an absolute correlation of 0.2 or greater with each of the other EA indices. In contrast, the original Horvath EA index is less broadly related to the other indices. The more recent indices show higher degrees of correlation, with the GrimAge and DunedinPOAM indices having the strongest correlation between one another in this group of subjects.
Table 3. Pearson correlation coefficients of the relationships of EA indices with one another.
Figure 3. Scatterplot matrix of the relationship of each of the indices of ageing or accelerated ageing to one another. From left to right on the X axis they are DunedinPACE, DunedinPOAM, Telomere, Horvath Accelerated Ageing, Hannum Accelerated Ageing and PhenoAge Accelerated Ageing. Individual units on the X and Y axis are those provided by the index formulas. Best fit lines are illustrated in red.
The relationships of the subjective and objective measures of cigarette and alcohol consumption to the EA indices and the GrimAge subscale (DNAmPACKYRS) for calculating lifetime cigarette consumption are given in . The original Horvath index was not related to any measure of cigarette or alcohol consumption, while the first Dunedin (POAM) and GrimAge indices were correlated with most measures of alcohol and cigarette use. Self-reported alcohol consumption was not related to any of the EA measures. Both self-reported use of just cigarettes and use of any form of combustible tobacco use showed somewhat stronger correlation to acceleration in POAM and the GrimAge indices than the other indices with a particularly more robust relationship to the GrimAge subscale for the lifetime pack-year consumption of cigarettes. Cotinine values were more strongly related to POAM, GrimAge, and GrimAge PY than was either form of self-reported smoking, whereas cg05575921 showed still greater correlations with POAM, GrimAge, and, in particular, GrimAge PY. Finally, in contrast to self-reported consumption of alcohol, ATS assessments of HAC showed robust and strong relationships to all EA indices and the GrimAge PY subscale except for the original Horvath index.
Table 4. Pearson correlation coefficients of the self and objective measures of cigarette and alcohol consumption to each of the seven indices.
The relationship of other tobacco product use to EA indices and digital methylation assessments is given in . Because the use of non-combusted tobacco products has previously been shown not to affect cg05575921 methylation and may have different health effects than combusted tobacco products [Citation29,Citation30], the effects of combusted and non-combusted forms of tobacco use were calculated separately. Like self-reported and cotinine positivity, the use of combusted, but not non-combusted non-cigarette products, was associated with cg05575921 methylation, POAM, and GrimAge acceleration. The use of non-combusted products was also significantly associated with the Telomere index values.
Table 5. Pearson correlation coefficients of the relationships of other tobacco products with methylation indices, cg05575921, and ATS values.
Our final set of analyses sought to quantify the relationship of digital methylation substance use assessments of smoking and alcohol use to the two most recent EA measures (GrimAge and POAM) reported to be estimators of mortality [Citation45,Citation48] and then determine whether those effects, if any, were additive or interactive. As a first step, we modelled ∆ GrimAge and POAM values as a function of dPCR assessments of cigarette and alcohol consumption. A simple additive linear regression model of cg05575921 and ATS values accounted for 46% and 57% of the changes in POAM (Adjusted R = 0.460, n = 425) and GrimAge (Adjusted R2 = 0.566, n = 425) values, respectively, with no evidence of interaction between the two epigenetic measures of substance use. The addition of POAM values to the additive model containing cg05575921 and ATS only modestly improves the amount of GrimAge variance predicted by the model (Adjusted R2 = 0.60, n = 425). Similarly, the addition of GrimAge to the additive model containing cg05575921 and ATS only modestly improves the amount of DunedinPOAM variance predicted from 46% (Adjusted R2 = 0.460, n = 425) to 50% (Adjusted R2 = 0.502, n = 425). Correction of analyses using imputed cell counts did not have any significant effects on the results for either set of regressions.
Discussion
The development of epigenetic measures of substance consumption and ageing have given us new lenses through which to view the impact of substance use on health and human ageing. In this communication, we show an association of smoking and drinking, as assessed by objective ELISA and MSdPCR assessments of methylation, with several recent measures of EA. In contrast, we find a very weak association of self-reported smoking and drinking with all EA measures. The relationship of smoking and drinking to EA is particularly weak for the earlier indices and is negligible for the earliest Horvath index. However, its relationship is much stronger with the more recently derived POAM and GrimAge indices. One reason for the divergence in strength of these associations of smoking assessments with the epigenetic ageing is suggested by the serological evidence that less than half of those with biochemical evidence of smoking actually self-reported that they smoked. There appears to be a similar or greater degree of underreporting of alcohol use. However, before discussing these findings, it is important to note several limitations of the current study. Most critically, the age range of this population is tightly clustered around 29 y of age and all the subjects are African American. Accordingly, there are potential limits to the generalizability of the current findings that call for examination of these findings in other samples.
The over-arching goals of the clinical and laboratory studies by our consortium are to design and test better preventive healthcare interventions. Therefore, we are very interested in identifying and prioritizing health-related behaviours, such as substance abuse, for this purpose. With those goals in mind, we conducted this set of analyses to better understand the relationship of various indexes of substance use to EA, particularly those indices of EA focused on likely deterioration in health outcomes or increased risk for mortality. The poor performance of self-report of cigarette and alcohol consumption in predicting EA in this at-risk population is not a surprise. In this sample, 22% of subjects reported smoking in the past 3 months, but 52% (214 of 409) are positive for cotinine – a product of nicotine metabolism. Exactly 50% have cg05575921 levels of less than 80%, which is predictive of recent or past smoking. In white blood cells, cg05575921 demethylates as a function of inhalation of products of combustion, especially polyaromatic hydrocarbons (PAH) [Citation52]. Therefore, because combusting cannabis also generates PAH, it is possible that some of the low cg05575921 levels could possibly be explained by smoking only cannabis. However, 90% of those with cg05575921 methylation levels of less than 80% also have current positive serum levels of cotinine, and cg05575921 levels are not affected by vaping[Citation29]. Therefore, it is highly likely that the majority of those with low cg05575921 levels are indeed tobacco smokers, with or without concurrent marijuana use. This level of unreliable self-report smoking is not without precedence. Prior publications by ourselves and others have shown high rates of unreliable self-report of smoking and/or alcohol use in a variety of populations[Citation16]. Most relevantly, several years ago, we found similar rates of underreporting of smoking in the parents of these subjects.22 We also found similar rates of unreliable self-report of smoking in the Framingham sample. Because the use of self-report is generally the first line of assessment, and often the only assessment of substance use in clinical and research settings, these findings underscore the importance of efforts to understand the factors influencing the likelihood of unreliable self-report, particularly underreporting. Increased understanding of factors predictive of underreporting substance use is likely to enhance the implementation of more sensitive patient care and reliable public health data.
The strong relationship of cg05575921 methylation with DunedinPOAM and GrimAge indices, as well as the strong relationship of the ATS with several of the newer EA indices, is striking. Jointly, cg05575921 and the ATS accounted for 46% and 57% of the variance in DunedinPOAM and GrimAge, respectively, and appear to account for almost all of the common variance in prediction of these two EA indices. This replicates our findings from the Framingham Heart Study [Citation15,Citation53], and suggests that the common variance in EA indices is often attributable to the shared effects of unhealthy drinking and cigarette smoking. Appreciating the strong, reproducible effects of substance use is critical to the formulation of strategies to increase healthy ageing because both smoking and HAC are well-recognized medical syndromes for which effective treatments are available. However, the first step to effective treatment is problem identification, which makes the issue of unreliable self-report, highlighted herein, particularly important. Addressing the issue of any addiction with patients is difficult. We hope that the introduction of reliable epigenetic indices may be helpful in changing the focus of the patient/clinician interaction about the need for change in smoking or drinking from a potentially adversarial discussion of a stigmatized habit to a discussion of how to best minimize a quantitative metric [Citation54,Citation55]. This may make the clinical discussion of reducing smoking and drinking more akin to a discussion of reducing elevated haemoglobin A1c (HbA1c), providing greater clinical traction with those afflicted by addiction.
Better understanding what aspects of the EA-related environment are captured by different EA indices is critical to the continuing formulation of improved indices. Correlations between the three latest indices, namely the DunedinPOAM and PACE, and the GrimAge algorithms (see ), are not particularly strong, further underscoring the likelihood that they are not all measures of a single underlying construct[Citation56]. To a certain extent, limited correlations across EA indices are understandable because the indices are designed and trained using different methods. For example, the earliest two clocks (Hannum and Horvath) were trained on chronological age only, whereas the later clocks were trained on various indicators of morbidity (DunedinPOAM and DunedinPACE) and a variety of mortality-related data (especially GrimAge). Furthermore, in an attempt to improve their assessments of the ‘Pace of Aging,’ cg05575921, and several other probes colinear with it found in DunedinPOAM were not included in DunedinPACE[Citation47]. Hence, some of the lack of concordance between the indices are perfectly understandable. At the same time, since the various indices of EA are often described in similar ways, the relatively low rate of shared variance for recent indices, ranging from 36% for POAM with GrimAge, to 16% of PACE with GrimAge, calls for careful reflection as to the nature of the aspects of morbidity and mortality that are being assessed. Alternatively, methodological issues may be to blame. In this regard, we note that Relton and colleagues have recently comprehensively reviewed the construction of DNA methylation predictors of health outcomes, identified a number of potential flaws in the construction of some prior indices, and suggested a set of best practices for the development of future indices[Citation57].
Consistent with our findings from the Framingham Heart Study [Citation15,Citation53], the current pattern of findings suggests that the common variance in EA indices is often attributable to the shared effects of unhealthy drinking and cigarette smoking, with only a small fraction of the shared variance of GrimAge with POAM being due to factors other than drinking or smoking. Some additional lack of correspondence between different measures of EA may be due to inclusion of loci that are strongly influenced by local SNP variation. For example, it may be that the Hannum group’s decision to remove many probes affected by local SNP variation [Citation3] accounts for the stronger correlations of this index with newer EA indices than is the case for the original Horvath index that has 125 probes that are thought to have significant GxMeth interactions according to the mQTL database [Citation58]. Removal of ethnic-specific genetic variation also helps to generalize indices across populations [Citation59]. Most subjects used to form and train both POAM and GrimAge are White. This is important because we have previously shown that cryptic genetic background effects in methylation arrays can bias prediction for African Americans [Citation59]. To better understand this, we suggest that in-depth comparisons of these indices in large cohorts of varying age and ethnicity are in order. By rigorously testing other constructs related to morbidity or mortality, it may be possible to identify other discrete health behaviours that are predictive of EA indices. Alternatively, because of genetic confounding, lack of adequately characterized cohorts and weak effect sizes, it may not be possible to identify robust clinical predictors of accelerated EA other than drinking or smoking. The problems posed by genetic confounding of signals from methylation arrays are now widely acknowledged [Citation60–62] and are thought to contribute to the potential racial bias of certain older EA indices [Citation59]. Fortunately, the newer generation of EA indices have attempted to minimize these effects by removing probes with known genetic confounding [Citation45]. Further, there may be potential for newer strategies using integrated genetic-epigenetic methods to adjust for genetic confounding, [Citation63,Citation64] and so better predict EA and other relevant health outcomes. However, at the current time, there does not appear to be a coherent body of research to demonstrate that any of the current EA indices predict distinct refined clinical outcomes, such as incident coronary heart disease, in a clinically meaningful manner.
Finally, understanding the relationship of HAC and smoking to the subsequent development of substance-induced disorders of ageing, such as diabetes, heart disease, and dementia, will be critical for optimal healthcare resource utilization. Although those with HAC have a substantial rate of short-term death and disability secondary to personal injuries and automotive accidents, most of the economic damage inflicted by smoking and drinking is secondary to their induction of other complex medical disorders. [Citation8–10]. By the time these syndromes, such as alcohol-related dementia and heart failure, develop in older age, the lifestyle choices in their earlier lives that led to these disorders may have ceased with the patient failing to recall, or choosing to underreport, their earlier presence. However, because the epigenetic signature of both alcohol and smoking regresses after cessation [Citation37,Citation65–67], if the blood sample of a subject is only drawn after the disease of ageing has manifested, the impact of adverse, but now forgotten, lifestyle habits of early adulthood on late-onset illness, as judged by DNA methylation, may be underestimated. However, this concern for the decay of signature may vary with respect to the stressor. For example, it is well established that the epigenetic signature of smoking may linger for many years [Citation65,Citation68]. Similarly, the same may be true for those associated with adverse childhood experiences[Citation69]. As a consequence, it will be important to follow cohorts, such as FACHS, but also those informative for other types of environmental stressors, over several decades, to provide a socially- and chronologically informed understanding of the development of diseases of ageing. Since we continue to collect additional waves of clinical and biological information on these subjects and sensitive and specific integrated genetic-epigenetic panels for heart disease have been developed[Citation63], we are optimistic that an objective, quantitative, and longitudinal understanding of the impact of substance use on critical health outcomes can be developed.
In summary, using cutting edge digital epigenetic tools, we show a profound impact of smoking and drinking on EA in our cohort. This effect was not detectable using self-report indices of smoking and drinking. We further show limited correlations, with some exceptions, of the various EA indices with one another and suggest that much of their shared variance is attributable to substance use. Finally, our studies highlight the need for the in-depth clinical characterizations including the use of objective biomarkers of substance use in studies of critical health outcomes.
Data availability
The genome-wide data included in this manuscript were prepared with funding from the United States National Institutes of Health (NIH). They are not yet publicly available but are being prepared for submission consistent with NIH Genomic Data Sharing policies.
Supplemental Material
Download MS Word (3.3 MB)Disclosure statement
No potential conflict of interest was reported by the author(s).
Supplementary material
Supplemental data for this article can be accessed online at https://doi.org/10.1080/15592294.2022.2100684
Additional information
Funding
References
- Fraga MF, Ballestar E, Paz MF, et al. Epigenetic differences arise during the lifetime of monozygotic twins. Proc Natl Acad Sci U S A. 2005;102:10604–10609.
- Horvath S. DNA methylation age of human tissues and cell types. Genome Biol. 2013;14:3156.
- Hannum G, Guinney J, Zhao L, et al. Genome-wide methylation profiles reveal quantitative views of human aging rates. Mol Cell. 2013;49:359–367.
- Oblak L, van der Zaag J, Higgins-Chen AT, et al. A systematic review of biological, social and environmental factors associated with epigenetic clock acceleration. Ageing Res Rev. 2021;69:101348.
- Dupras C, Beauchamp E, Joly Y. Selling direct-to-consumer epigenetic tests: are we ready? Nat Rev Genet. 2020;21:335–336.
- Mendelson MM. Epigenetic age acceleration: a biological doomsday clock for cardiovascular disease? Circ Genom Precis Med. 2018;11:e002089–e002089.
- Sarno F, Benincasa G, List M, et al. Clinical epigenetics settings for cancer and cardiovascular diseases: real-life applications of network medicine at the bedside. Clin Epigenetics. 2021;13:66.
- Centers for Disease Control and Prevention. Smoking-attributable mortality, years of potential life lost, and productivity losses – United States, 2000-2004. MMWR Morb Mortal Wkly Rep. 2008;57:1226–1228.
- Mokdad AH, Marks JS, Stroup DF, et al. Actual causes of death in the United States. Jama. 2000;291(2004):1238–1245.
- Kanny D, Brewer RD, Mesnick JB, et al. Vital signs: alcohol poisoning deaths—United States, 2010–2012. MMWR Morb Mortal Wkly Rep. 2015;63:1238.
- US Department of Health Human Services. The health consequences of smoking—50 years of progress: a report of the surgeon general. (Atlanta, GA: US Department of Health and Human Services, Centers for Disease, 2014).
- Zimmer DM. The accuracy of self-reported smoking among blacks. Rev Black Political Econ. 2018;45:166–180.
- Esser MB, Sherk A, Liu Y, et al. Deaths and years of potential life lost from excessive alcohol use—United States, 2011–2015. Morbidity Mortality Weekly Rep. 2020;69:981.
- Tsao CW, Vasan RS. Cohort profile: the Framingham Heart Study (FHS): overview of milestones in cardiovascular epidemiology. Int J Epidemiol. 2015;44:1800–1813.
- Philibert RA, Dogan MV, Mills JA, et al. AHRR methylation is a significant predictor of mortality risk in Framingham Heart Study. J Insur Med. 2019;48(1):79–89.
- Konen JC, Summerson JH, Bell RA, et al. Racial differences in symptoms and complications in adults with type 2 diabetes mellitus. Ethn Health. 1999;4:39–49.
- Centers for Disease Control and Prevention. National diabetes fact sheet: national estimates and general information in diabetes and prediabetes in the United States. Atlanta GA: U.S. Department of Health and Human Services, Centeres for Disease Control and Prevention; 2011.
- Gouin JP, Glaser R, Malarkey WB, et al. Chronic stress, daily stressors, and circulating inflammatory markers. Health Psychol. 2012;31:264–268.
- Black PH. The inflammatory response is an integral part of the stress response: implications for atherosclerosis, insulin resistance, type II diabetes and metabolic syndrome X. Brain Behav Immunol. 2003;17:350–364.
- Andersen AM, Philibert RA, Gibbons FX, et al. Accuracy and utility of an epigenetic biomarker for smoking in populations with varying rates of false self‐report. Am J Med Genet B Neuropsychiatr Genet. 2017;174:641–650.
- Kandel DB, Schaffran C, Griesler P, et al. Salivary cotinine concentration versus self-reported cigarette smoking: three patterns of inconsistency in adolescence. Nicotine Tob Res. 2006;8:525–537.
- Philibert R, Miller S, Noel A, et al. A four marker digital PCR toolkit for detecting heavy alcohol consumption and the effectiveness of its treatment. J Insur Med. 2019;48:90–102.
- Miller S, Mills JA, Long J, et al. A comparison of the predictive power of DNA methylation with carbohydrate deficient transferrin for heavy alcohol consumption. Epigenetics. 2020;16(9):969–979.
- Philibert R, Levin M, Privett M. Alcohol use, epigenetics & life insurance: quantifying the risk. On the Risk. 2021;37:72–77.
- Philibert R, Dogan M, Noel A, et al. Dose response and prediction characteristics of a methylation sensitive digital PCR assay for cigarette consumption in adults. Front Genet. 2018;9. DOI:10.3389/fgene.2018.00137.
- Philibert R, Dogan M, Beach SRH, et al. AHRR methylation predicts smoking status and smoking intensity in both saliva and blood DNA. Am J of Genet. 2019;183:51–60.
- Dawes K, Andersen A, Reimer R, et al. The relationship of smoking to cg05575921 methylation in blood and saliva DNA samples from several studies. Sci Rep. 2021;11:21627.
- Philibert R, Hollenbeck N, Andersen E, et al. A quantitative epigenetic approach for the assessment of cigarette consumption. Front Psychol. 2015;6. DOI:10.3389/fpsyg.2015.00656.
- Andersen A, Reimer R, Dawes K, et al. DNA methylation differentiates smoking from vaping and non-combustible tobacco use. Epigenetics. 2021;17:1–13.
- Besingi W, Johansson Å. Smoke related DNA methylation changes in the etiology of human disease. Hum Mol Genet. 2013;23(9):2290–2297.
- Bortolotti F, Sorio D, Bertaso A, et al. Analytical and diagnostic aspects of carbohydrate deficient transferrin (CDT): a critical review over years 2007–2017. J Pharm Biomed Anal. 2018;147:2–12.
- Pinheiro L, Emslie KR. Basic concepts and validation of digital PCR measurements. In: Karlin-Neumann G, Bizouarn F, editors. Digital PCR: methods and protocols. New York NY: Springer; 2018. p. 11–24.
- Heiss JA, Just AC. Identifying mislabeled and contaminated DNA methylation microarray data: an extended quality control toolset with examples from GEO. Clin Epigenetics. 2018;10:73.
- Ori A, Lu A, and Horvath S, et al. A systematic evaluation of 41 DNA methylation predictors across 101 data preprocessing and normalization strategies highlights considerable variation in algorithm performance. bioRxiv. 2021. https://www.biorxiv.org/content/10.1101/2021.09.29.462387v1
- Kruppa J, Sieg M, Richter G, et al. Estimands in epigenome-wide association studies. Clin Epigenetics. 2021;13:98.
- Brody GH, Ge X, Kim SY, et al. Neighborhood disadvantage moderates associations of parenting and older sibling problem attitudes and behavior with conduct disorders in African American children. J Consult Clin Psychol. 2003;71:211–222.
- Philibert R, Penaluna B, White T, et al. A pilot examination of the genome-wide DNA methylation signatures of subjects entering and exiting short-term alcohol dependence treatment programs. Epigenetics. 2014;9:1212–1219.
- Davis S, Bilke S. An Introduction to the methylumi package. Biocond Package. 2010;
- Wong CC, Pidsley R, Schalkwyk LC. The wateRmelon package. BMC genomics.2013;14(1):1–0.
- Illumina. Infinium human methylationEPIC array product files.
- Dogan MV, Xiang J, Beach SRH, et al. Ethnicity and smoking-associated DNA methylation changes at HIV co-receptor GPR15. Front Psychiatry. 2015;6:132.
- Teschendorff AE, Marabita F, Lechner M, et al. A beta-mixture quantile normalization method for correcting probe design bias in Illumina Infinium 450 k DNA methylation data. Bioinformatics. 2013;29:189–196.
- Pidsley R, Zotenko E, Peters TJ, et al. Critical evaluation of the Illumina MethylationEPIC BeadChip microarray for whole-genome DNA methylation profiling. Genome Biol. 2016;17:208.
- Levine ME, Lu AT, Quach A, et al. An epigenetic biomarker of aging for lifespan and healthspan. Aging (Albany NY). 2018;10:573.
- Lu AT, Lu AT, Quach A, et al. DNA methylation GrimAge strongly predicts lifespan and healthspan. Aging (Albany NY). 2019;11:303.
- Lu AT, Seeboth A, Tsai P-C, et al. DNA methylation-based estimator of telomere length. Aging (Albany NY). 2019;11:5895.
- Belsky DW, Caspi A, Corcoran DL, et al. DunedinPACE, a DNA methylation biomarker of the pace of aging. Elife. 2022;11:e73420.
- Belsky DW, Caspi A, Arseneault L, et al. Quantification of the pace of biological aging in humans through a blood test, the DunedinPoAm DNA methylation algorithm. Elife. 2020;9:e54870.
- Houseman EA, Accomando WP, Koestler DC, et al. DNA methylation arrays as surrogate measures of cell mixture distribution. BMC Bioinformatics. 2012;13:86.
- Gelernter J, Polimanti R. Genetics of substance use disorders in the era of big data. Nat Rev Genet. 2021;22(11):712–729.
- Dawes K, Sampson L, Reimer R, et al. Epigenetic analyses of alcohol consumption in combustible and non-combustible nicotine product users. Epigenomes. 2021;5:18.
- Philibert RA, Beach S, Brody GH. The DNA methylation signature of smoking: an archetype for the identification of biomarkers for behavioral illness. Genes and motivation subst. 2014; 109–127.
- Mills JA, Beach S, Dogan M, et al. A direct comparison of the relationship of epigenetic aging and epigenetic substance consumption markers to mortality in the Framingham Heart Study. Genes (Basel). 2019;10:51.
- McClure JB. Are biomarkers a useful aid in smoking cessation? A review and analysis of the literature. Behav Med. 2001;27:37–47.
- Subhani M, Knight H, Ryder S, et al. Does advice based on biomarkers of liver injury or non-invasive tests of liver fibrosis impact high-risk drinking behaviour: a systematic review with meta-analysis. Alcohol Alcohol. 2021;56:185–200.
- Bergsma T, Rogaeva E. DNA methylation clocks and their predictive capacity for aging phenotypes and healthspan. Neurosci insights. 2020;15:2633105520942221.
- Yousefi PD, Suderman M, Langdon R, et al. DNA methylation-based predictors of health: applications and statistical considerations. Nat Rev Genet. 2022;23(6):369–383.
- Gaunt TR, Shihab HA, Hemani G, et al. Systematic identification of genetic influences on methylation across the human life course. Genome Biol. 2016;17:1–14.
- Philibert R, Beach SRH, Lei M-K, et al. Array-based epigenetic aging indices may be racially biased. Genes (Basel). 2020;11:685.
- Pfeiffer L, Wahl S, Pilling LC, et al. DNA methylation of lipid-related genes affects blood lipid levels. Circulation. 2015;8:334–342.
- Hawe JS, Wilson R, Schmid KT, et al. Genetic variation influencing DNA methylation provides insights into molecular mechanisms regulating genomic function. Nat Genet. 2022;54:18–29.
- Lee SJ, Eunae Kim, Hakyung Kim, Shuai Li, John L. Hopper, and Joohon Sung. Twin and Family Studies of Epigenetics. In: DNA methylation changes specific to environmental exposures: the strengths of twin studies using cigarette smoking as an example. Elsevier, 2021; 277–284.
- Dogan MV, Knight S, Dogan TK, et al. External validation of integrated genetic-epigenetic biomarkers for predicting incident coronary heart disease. Epigenomics. 2021;13(14):1095–1112.
- Dawes K, Simons R, and Darbro B, et al. Additive and interactive genetically contextual effects of HbA1c on cg19693031 methylation in type 2 diabetes. Genes (Basel). Genes 2022, 13(4), 683.
- Guida F, Sandanger TM, Castagné R, et al. Dynamics of smoking-induced genome-wide methylation changes with time since smoking cessation. Hum Mol Genet. 2015;24:2349–2359.
- Wilson R, Wahl S, Pfeiffer L, et al. The dynamics of smoking-related disturbed methylation: a two time-point study of methylation change in smokers, non-smokers and former smokers. BMC Genomics. 2017;18:805.
- Witt SH, Frank J, Frischknecht U, et al. Acute alcohol withdrawal and recovery in men lead to profound changes in DNA methylation profiles: a longitudinal clinical study. Addiction. 2020;115:2034–2044.
- Takeuchi F, Takano K, and Yamamoto M, et al. Clinical implication of smoking-related aryl-hydrocarbon receptor repressor (AHRR) hypomethylation in Japanese adults. Circ J. 2022;84:CJ-21–0958.
- Tang R, Howe LD, Suderman M, et al. Adverse childhood experiences, DNA methylation age acceleration, and cortisol in UK children: a prospective population-based cohort study. Clin Epigenetics. 2020;12:55.