
ABSTRACT
Skeletal myogenesis is a highly ordered process finely regulated by various factors. Long non-coding RNAs play an important regulatory role in myogenesis via multiple mechanisms. In this study, we identified the lncRNA Gm10561, which was upregulated during myogenic differentiation and is highly expressed in skeletal muscle. Knockdown of Gm10561 inhibited the proliferation and differentiation of C2C12 myoblasts in vitro and muscle growth in vivo. Overexpression of Gm10561 promoted the proliferation and differentiation of both C2C12 myoblasts and porcine muscle satellite cells. Notably, lncRNA Gm10561 is localized in the cytoplasm and competitively bound to miR-432, which directly targets MEF2C and E2F3. It was confirmed that lncRNA Gm10561 regulates the proliferation and differentiation of myoblasts by acting as a sponge of miR-432 to modulate MEF2C and E2F3 expression. Thus, the lncRNA-Gm10561-miR-432-MEF2C/E2F3 axis plays an important role in myogenesis.
Introduction
Skeletal muscle accounts for 40% of the average body weight of adults and plays a crucial role in the preservation of independent locomotion and metabolic health of the whole body [Citation1]. Dysregulation of skeletal muscle results in various muscle diseases, including muscular atrophy, myosarcoma, and muscle metabolic disorder [Citation2–4]. During embryonic development, the skeletal muscle cells of the limbs and trunk, namely, myogenic progenitor cells, come from somites, which are transient embryonic structures derived from the paraxial mesoderm [Citation5]. Myogenic progenitor cells are regulated by a series of signalling pathways such as Wnt, Notch, and Sonic hedgehog, and marked by paired box 3 (Pax3) and paired box 7 (Pax7) genes [Citation6]. Pax3 is required for limb muscle formation; it affects not only the generation of myogenic progenitor cells in the somitic dermomyotome but also the migration of these cells into the limb area [Citation7]. Pax3 and Pax7 can induce expression of the myogenic regulatory factors (MRFs) MyoD and Myf5, thus stimulating the specification of muscle progenitor cells to committed myoblasts [Citation8–10]. Myoblasts then undergo proliferation, orderly arrangement, exit the cell cycle, begin to differentiate, and finally fuse together to form multinuclear fibres termed myotubes [Citation11]. The differentiation of myoblasts is activated by the MRFs MyoD, myogenin (MyoG), Myf5, and myogenic regulatory factor 4 (MRF4), as well as members of the myocyte enhancer factor-2 (MEF2) family, which are key transcription factors that bind muscle-specific gene promoters and activate their transcription [Citation11,Citation12]. Epigenetic regulations, such as DNA methylation, histone modification, and non-coding RNAs, also play crucial roles in myogenesis [Citation13–15].
Exploration of the mammalian genome has revealed a new class of RNA regulator: long non-coding RNA (lncRNAs) [Citation16–18]. Members of this class of RNA transcript are greater than 200 nucleotides and are usually not translated into proteins [Citation19]. Most lncRNAs are transcribed by RNA polymerase II and have tissue-specific expression patterns [Citation17,Citation20]. Increasing evidence has shown that lncRNAs play a pivotal regulatory role in multiple biological processes, including X chromosome silencing [Citation21], stem cell pluripotency [Citation22], haematopoiesis and immunity [Citation23], cell fate, and programming and reprogramming [Citation24]; they are also related to diverse diseases and cancers, such as cardiovascular diseases [Citation25], autoimmune diseases [Citation26], prostate cancer [Citation27], and breast cancer [Citation28]. To date, only a small number of lncRNAs have been well characterized, and a variety of regulatory mechanisms of these lncRNAs have been identified, including serving as signalling molecules [Citation29,Citation30], guides [Citation31], scaffolds [Citation32], and decoys [Citation33,Citation34]. In skeletal muscle, tens of thousands of lncRNAs have been identified with the help of high-throughput sequencing. However, only a few have been found to have important functions in skeletal muscle development. Among them, SYISL [Citation35], Neat1 [Citation36], Malat1 [Citation37], and Linc-YY1 [Citation38] regulate myogenesis by interacting with chromosome modification complexes. The lncRNAs lnc-mg [Citation34] and MAR1 [Citation39] regulate myogenesis by functioning as molecular sponges for miRNAs. The lncRNA Myolinc accelerates myogenesis by cis regulation of its neighbouring protein-coding gene Filip1 [Citation40]. The function and mechanism of most lncRNAs in myogenesis have not yet been explored.
To clarify transcriptional regulation and regulatory roles of lncRNAs in skeletal muscle cell differentiation. A recent study identified 385 differential expressed lncRNAs during C2C12 differentiation, whose expression were controlled by changes of chromatin state, using RNA-seq combined with ATAC-seq and ChIP-seq analysis. Gm10561 was one of the differentially expressed lncRNAs [Citation41]. However, the role of Gm10561 in myogenesis is unknown. To further detect the expression profile of Gm10561 and explore its function and molecule mechanism in the myogenesis. In this study, we observed that Gm10561 was upregulated during myogenic differentiation and its expression level in skeletal muscle was higher than that in other tissues. Functional studies shown that Gm10561 has a positive regulatory role in both C2C12 myoblast proliferation and differentiation. Mechanistically, Gm10561 acts as a molecular sponge of miR-432, thus promoting expression of MEF2C and E2F3. Our observations demonstrate that Gm10561 is a new positive regulator of myogenesis, and may help to better understand the lncRNA–miRNA–target-gene regulatory network in myogenesis.
Results
Expression pattern of lncRNA Gm10561
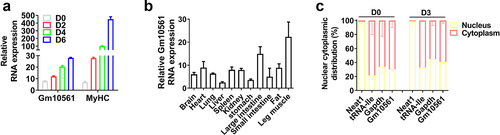
To investigate the role of Gm10561 myogenesis, we first characterized Gm10561. According to the National Center for Biotechnology Information (NCBI) database, there are three Gm10561 transcripts with the same 5’ and 3’ end; another lncRNA AK135004 also aligns with Gm10561, but the 5’ ends differed (Figure S1A). We predicted their protein coding ability using Coding Potential Calculator 2 (CPC2) software [Citation42], which showed that none had protein coding potential (Figure S1B). Then we detected the expression of Gm10561 in C2C12 cells during proliferation (day 0 [D0]) and differentiation on D2, D4, and D6. Gm10561 was upregulated during C2C12 differentiation, consistent with the expression pattern of the myogenic marker gene MyHC ( and Figure S1C). Then we examined the tissue expression pattern of Gm10561 by qPCR, which showed expression of Gm10561 is higher in leg muscle than other tissues (). Moreover, nuclear and cytoplasmic RNA fractionation demonstrated that Gm10561 is mainly located in the cytoplasm of proliferating myoblasts (69.51%) and differentiated myotubes (59.25%) (). These results imply that Gm10561 may have a regulatory role in myogenesis.
Figure 1. Expression pattern of lncRNA Gm10561. (a) qPCR showing that expression of Gm10561 was induced during myogenic differentiation. The myogenic marker MyHC was used as a positive control. (b) Relative expression of Gm10561 in 11 mice tissues (brain, heart, lung, liver, spleen, kidney, stomach, large intestine, small intestine, fat, leg muscle) as determined by qPCR. Gm10561 expression was highest in leg muscle. (c) Distribution of Gm10561 in the cytoplasm and nuclei of proliferating C2C12 cells (D0) and C2C12 cells differentiated for 3 days (D3). Relative RNA expression was normalized to the control gene β-actin. Data represent mean ± standard deviation (SD) of three independent biological replicates.
Gm10561 is a pro-myogenic factor that promotes myoblast proliferation and differentiation
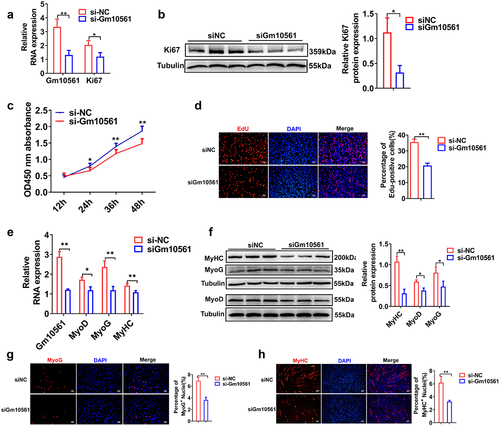
To investigate the role of Gm10561 in myogenesis, we used functional gain and loss methods to study the effects of Gm10561 on C2C12 myoblast proliferation and differentiation. We first performed Gm10561 knockdown experiments in C2C12 cells. We designed three small interfering RNAs (siRNAs) to knock down Gm10561 and found that siRNA-1361 had the highest interference efficiency; this siRNA was selected for further Gm10561 interference experiments (Figure S2A). The effects of Gm10561 on C2C12 proliferation were detected by qPCR, Western blotting, CCK-8 assay, and EdU staining. qPCR showed that Gm10561 expression was significantly knocked down by siRNA, and mRNA expression of the proliferation marker Ki67 was remarkably decreased by Gm10561 knockdown ( and Figure S2B). Western blotting showed that Gm10561 knockdown significantly reduced protein expression of Ki67 (). The CCK-8 assay showed that cell proliferation was dramatically inhibited after Gm10561 knockdown at 24, 36, and 48h (). EdU staining indicated a significant decrease in EdU incorporation following Gm10561 knockdown (). The effects of Gm10561 knockdown on C2C12 differentiation were also explored. qPCR showed that both mRNA and protein expression levels of the myogenic genes MyoD, MyoG, and MyHC were remarkably reduced after Gm10561 knockdown ( e and f). Further, immunofluorescence staining of MyoG and MyHC showed that knockdown of Gm10561 significantly reduced the proportion of MyoG+ and MyHC+ cells ( g and h). In addition, we found that mRNA expression levels of the slow fibre marker MyHC I and the fast fibre markers MyHC IIA and MyHC IIB were decreased after Gm10561 knockdown (Figure S2C). The above results indicate that Gm10561 knockdown represses both C2C12 proliferation and differentiation.
Figure 2. Knockdown of Gm10561 inhibited proliferation and differentiation of C2C12 myoblasts. (a) qPCR showing mRNA expression of Ki67 was significantly reduced by Gm10561 knockdown. (b) Western blotting showing Gm10561 knockdown remarkably reduced Ki67 protein levels. Expression was quantified using ImageJ software. (c) CCK-8 assay detected C2C12 cell proliferation following Gm10561 knockdown at 12, 24, 36, and 48 h. Gm10561 knockdown dramatically suppressed cell proliferation. (d) EdU staining showed that the proportion of EdU+ cells was decreased following Gm10561 knockdown. (e) qPCR showing that mRNA expression of MyoD, MyoG, and MyHC was significantly reduced by Gm10561 knockdown. (f) Western blotting showing that Gm10561 knockdown remarkably reduced MyoD, MyoG, and MyHC protein expression. Protein expression was quantified using ImageJ. (g and h) Immunofluorescence staining of MyoG and MyHC showed that the percentage of MyoG+ (g) and MyHC+ (h) cells was significantly inhibited by Gm10561 knockdown. Relative RNA and protein levels were standardized to β-actin and tubulin, respectively. Data represent mean ± SD of three independent biological replicates. *P < 0.05; **P < 0.01.
To further verify the function of Gm10561 in promoting myogenesis, Gm10561 overexpression experiments were performed in C2C12 myoblasts. We constructed overexpression vectors of AK135004 and the three transcripts of Gm10561, Gm10561v1, Gm10561v2, and Gm10561v3, and transfected them into C2C12 cells (Figure S3A). Both mRNA and protein expression levels of Ki67 were increased after Gm10561v1, Gm10561v2, Gm10561v3, and AK135004 overexpression (Figure S3B–D). The percentage of EdU+ cells was significantly increased after Gm10561v1, Gm10561v2, Gm10561v3, and AK135004 overexpression (Figure S3E and F). CCK-8 assay showed that cell proliferation was dramatically increased following overexpression of Gm10561v1, Gm10561v2, Gm10561v3, and AK135004 for 48 h (Figure S3G). The above results demonstrated that Gm10561v1, Gm10561v2, Gm10561v3, and AK135004 overexpression promotes myoblast proliferation. Likewise, Gm10561v1, Gm10561v2, Gm10561v3, and AK135004 overexpression accelerated myogenic differentiation, as shown by Western blotting and immunofluorescence of myogenic marker genes (Figure S4). Taken together, our results confirm that Gm10561 is a pro-myogenic factor that promotes myoblast proliferation and differentiation.
Restrained Gm10561 represses skeletal muscle growth in vivo
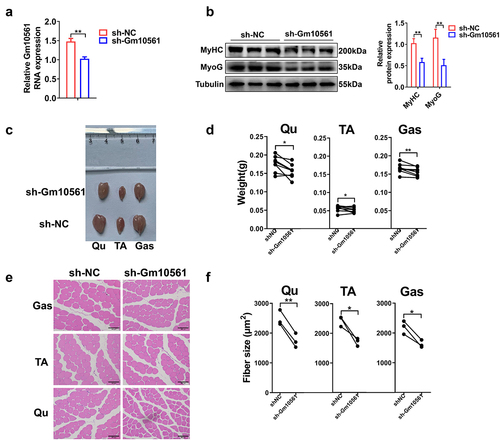
To further prove that Gm10561 affects skeletal muscle growth in vivo, we performed lentivirus-mediated Gm10561 gene knockdown. LV3-sh-Gm10561 or LV3-sh-NC were injected into the left or right hindlimbs of 6-week-old C57BL/6 mice, respectively. qPCR showed that expression of Gm10561 was significantly decreased in LV3-sh-Gm10561 group than control group (). Western blotting showed that protein expression of MyoG and MyHC was significantly reduced by Gm10561 knockdown (). We also photographed and weighed Qu, TA, and Gas muscles of the left and right hindlimbs. The volume and weight of the Qu, TA, and Gas muscles in the Gm10561 knockdown group were decreased compared to those of the control group ( c and d). Mean cross‐sectional areas of individual myofibers were analysed by haematoxylin and eosin staining. The cross‐sectional areas of individual myofibers of the Qu, TA, and Gas muscles in the Gm10561 knockdown group were smaller than those in the control group ( e and f). These findings verified that Gm10561 could promote skeletal muscle growth in vivo.
Figure 3. Gm10561 knockdown inhibited skeletal muscle growth in vivo. (a) qPCR showing that the expression of Gm10561 was significantly knocked down by LV-sh-Gm10561 particle injection. (b) Western blotting showing that protein expression of MyoG and MyHC was decreased following LV-sh-Gm10561 particle injection. Protein expression was quantified using ImageJ. (c) Representative images of the Qu, TA, and Gas muscles of the LV3-sh-Gm10561 and LV3-sh-NC groups (N = 10). (d) Weights of the Qu, TA, and Gas muscles of the LV3-sh-Gm10561 and LV3-sh-NC groups. The weights of three muscles were decreased by LV3-sh-Gm10561 injection (N = 10). (e) Representative images of haematoxylin and eosin staining of the Qu, TA, and Gas muscles of the LV3-sh-Gm10561 and LV3-sh-NC groups (N = 3). (f) Fibre sizes of the Qu, TA, and Gas muscles in (e). Fibre size were smaller in the LV3-sh-Gm10561 group compared to the LV3-sh-NC group. Relative RNA and protein levels were standardized to β-actin and tubulin, respectively. Data represent mean ± SD of three independent biological replicates. *P < 0.05; **P < 0.01.
Overexpression of Gm10561 promotes PSC proliferation and differentiation
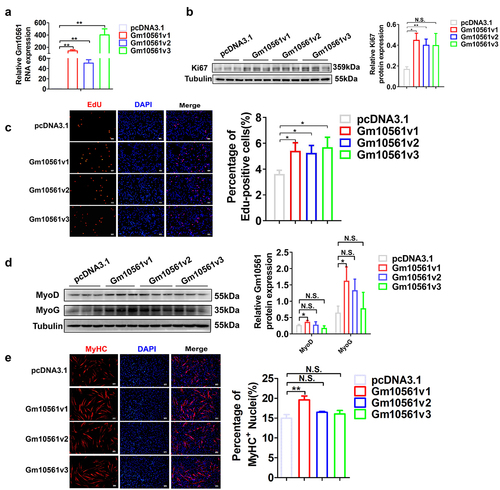
Although lncRNAs generally exhibit low sequence conservation, some lncRNAs are functionally conserved across species [Citation43]. To investigate whether Gm10561 has a conserved function in myogenesis between mice and pigs, we performed Gm10561 overexpression experiments in porcine muscle satellite cells (PSCs). All three transcripts of Gm10561 were overexpressed in PSCs (). Gm10561 overexpression led to remarkably enhanced Ki67 protein expression () and EdU+ cell population (), indicating Gm10561 overexpression promoted PSC proliferation. Overexpression of Gm10561v1, but not Gm10561v2 and Gm10561v3, increased MyoD and MyoG protein levels () and the percentage of MyHC+ cells (), indicating only Gm10561v1 overexpression accelerated PSC differentiation. These results suggest that the function of Gm10561v1 in myoblast proliferation and myogenic differentiation may be conserved between mice and pigs. Thus, Gm10561v1 has been abbreviated as Gm10561 and used for further mechanistic research.
Figure 4. Overexpression of Gm10561 promoted proliferation and differentiation of PSCs. (a) qPCR showing that all three transcripts of Gm10561 were successfully overexpressed in PSCs. (b) Western blotting showing that expression of Ki67 was significantly increased following Gm10561v1, Gm10561v2, and Gm10561v3 overexpression. Expression was quantified using ImageJ. (c) EdU staining of PSCs. The proportion of EdU+ cells was significantly increased following Gm10561v1, Gm10561v2, and Gm10561v3 overexpression. (d) Western blotting of MyoD and MyoG expression in PSCs. Protein expression of MyoD and MyoG was significantly increased after Gm10561v1 overexpression, but not after Gm10561v2 and Gm10561v3 overexpression. Expression was quantified using ImageJ. (e) Representative images of MyHC immunofluorescence staining of PSCs. Gm10561v1 overexpression, but not that of Gm10561v2 and Gm10561v3, significantly increased the proportion of MyHC+ cells. Relative RNA and protein levels were standardized to β-actin and tubulin, respectively. Data represent mean ± SD of three independent biological replicates. N.S., not significant; *P < 0.05; **P < 0.01.
Gm10561 acts as a ceRNA of miR-432 and modulates MEF2C and E2F3 expression
The pro-myogenic role of Gm10561 prompted us to further delineate the underlying molecular mechanism. We first explored Gm10561 downstream target genes using RNA sequencing and globally analysed changes in gene expression after knockdown of Gm10561 in C2C12 myoblasts differentiated for 2 days. Compared to the control group, 133 differentially expressed genes (DEGs) (95 downregulated and 38 upregulated) were identified in the Gm10561 knockdown group (fold change ≥ 2, P < 0.05) ( and Table S4). Gene Ontology (GO) enrichment analysis indicated that DEGs were involved in muscle-related processes, such as muscle contraction, myofibril assembly, and muscle cell differentiation ( and Table S5). Kyoto Encyclopaedia of Genes and Genomes (KEGG) pathway enrichment analysis of DEGs showed that they participated in signalling pathways such as cardiac muscle contraction, hypertrophic cardiomyopathy, and calcium signalling ( and Table S5). Among these DEGs, some have a known function in the regulation of myogenesis, such as MEF2C, Myh3, Myh7, Tnnc2, and MyoZ2.
Figure 5. Gm10561 competes with miR-432 to bind MEF2C and E2F3. (a) Heat map of the most differentially expressed mRNAs between the Gm10561 knockdown groups and the NC control group (fold change ≥ 2; P < 0.05). (b) GO term analysis of DEGs of Gm10561. (c) KEGG enrichment analysis of DEGs of Gm10561. (d) qPCR of the RNA immunoprecipitation assay showed that Gm10561 can interact with Ago2 in C2C12 myoblasts. (e) Luciferase reporter assay of Luc‐Gm10561 in C2C12 myoblasts showed that miR‐432 overexpression reduced luciferase activities. (f) Luciferase reporter assay of Luc‐Gm10561 and Luc‐Gm10561-Mut in C2C12 myoblasts showed that Gm10561 specifically bound miR-432. (g) Venn analysis to obtain the intersection of genes downregulated by Gm10561 knockdown and miR-432 target genes predicted by RNAhybrid and TargetScan. (h) Luciferase reporter assay of Luc‐MEF2C 3’ UTR and Luc‐MEF2C 3’ UTR-Mut in C2C12 myoblasts showed that miR-432 specifically bound the MEF2C 3’ UTR. (i) Luciferase reporter assays of Luc‐MEF2C‐3’ UTR in C2C12 myoblasts showed that Gm10561 competes with the MEF2C‐3′ UTR to bind miR‐432. (j) Luciferase reporter assays of Luc‐E2F3‐3’ UTR in C2C12 myoblasts showed that Gm10561 competes with the E2F3‐3′ UTR to bind miR‐432. Data represent mean ± SD of three independent biological replicates. N.S., not significant; *P < 0.05; **P < 0.01.
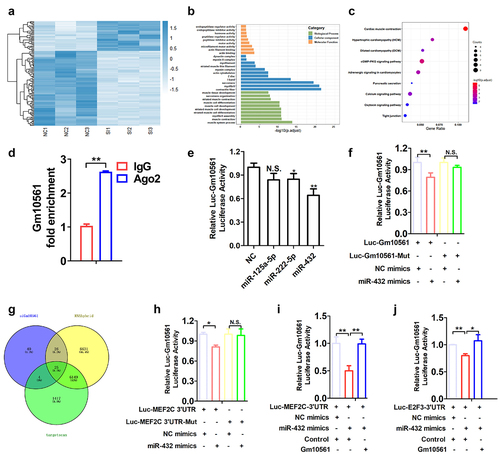
Nucleocytoplasmic localization of Gm10561 showed that it was primarily located in the cytoplasm (), indicating Gm10561 may function as a competing endogenous RNA (ceRNA) for miRNA. To confirm the association between Gm10561 and miRNA-protein complex, we performed RNA Immunoprecipitation (RIP) analysis on Ago2 protein, which is the core component of miRNA-induced silencing complex [Citation44]. The result showed that Gm10561 was significantly enriched in Ago2 group, indicating Gm10561 can interact with the Ago2‐based miRNA‐induced repression complex (). We selected three myogenesis‐related miRNAs and predicted binding sites in the Gm10561 sequence and miRNA seed regions using RNAhybrid software (https://bibiserv.cebitec.uni-bielefeld.de/rnahybrid/) (Table S6). To confirm targeting of these miRNAs by Gm10561, we cloned the full‐length sequence of Gm10561 into the downstream region of the luciferase reporter gene to generate the Luc‐Gm10561 vector, and co-transfected Luc‐Gm10561 with miRNAs into C2C12 cells. miR-432 reduced luciferase activity to the greatest extent (); Previous study reported that miR-432 inhibits C2C12 myoblast proliferation and differentiation [Citation45], opposite of Gm10561 function, indicating Gm10561 may act as a ceRNA for miR-432. To further validate the competing sponging mechanism, we built a wild-type luciferase construct of Gm10561 (Luc-Gm10561) and a Gm10561 mutant luciferase construct in which the putative miR-432 binding site was mutated (Luc-Gm10561-Mut). The dual luciferase reporter assay result showed that overexpression of miR-432 significantly reduced the luciferase activity of Luc-Gm10561, but had no effect on the luciferase activity of Luc-Gm10561-Mut in C2C12 cells (), indicating Gm10561 is a direct target of miR-432.
To further investigate downstream targets, we predicted the target genes of miR-432 using RNAhybrid (http://bibiserv.techfak.uni-bielefeld.de/rnahybrid/) and TargetScan (http://www.targetscan.org/vert/). The above results were analysed together with the genes downregulated following Gm10561 knockdown from our RNA-seq data using Venn analysis. A total of 25 candidate target genes were obtained by Venn analysis (). We selected MEF2C, a well‐established regulator of muscle development [Citation46], as a candidate target of Gm10561 and miR-432, for further study. To confirm that miR-432 directly targets MEF2C, we constructed a wild-type luciferase construct of MEF2C-3′UTR (Luc-MEF2C-3′UTR) and a MEF2C-3′UTR mutant luciferase construct in which the putative miR-432 binding site was mutated (Luc-MEF2C-3′UTR-Mut). The luciferase activity of Luc-MEF2C-3′UTR was significantly reduced by miR-432 overexpression but had no effect on Luc-MEF2C-3′UTR-Mut in C2C12 cells (). E2F3 is a known target of miR-432 in muscle cells [Citation45], and it has a role in promoting C2C12 myoblasts proliferation [Citation47,Citation48]. We investigated whether Gm10561 could competitively bind miR‐432 with MEF2C and E2F3. Transfection of miR-432 mimics remarkably inhibited the luciferase activity of Luc-MEF2C-3′UTR and Luc-E2F3–3′UTR, while the inhibitory effects of miR-432 on Luc-MEF2C-3′UTR and Luc-E2F3–3′UTR luciferase activity were attenuated following co-transfection with the Gm10561 overexpression vector ( i and j).
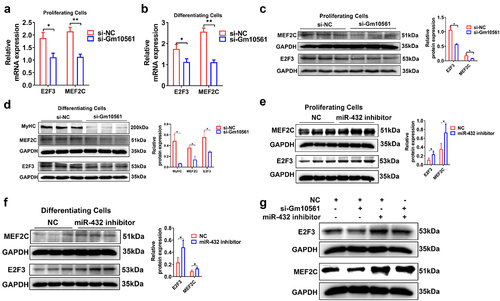
Next, we tested the effects of Gm10561 and miR-432 on MEF2C and E2F3. qPCR and Western blotting showed that Gm10561 knockdown significantly inhibited MEF2C and E2F3 mRNA and protein expression during proliferation and differentiation ( a–d). miR-432 knockdown in C2C12 cells enhanced MEF2C and E2F3 protein expression during proliferation and differentiation ( e and f and Figure S5A), while miR-432 overexpression had the opposite effect (Figure S5B-D). These results suggest that Gm10561 and miR-432 have opposite effects on MEF2C and E2F3. Next, we performed a co-transfection experiment using Gm10561 siRNA and miR-432 inhibitor in C2C12 cells. Transfection of miR-432 inhibitor increased protein levels of MEF2C and E2F3, but not when co-transfected with the Gm10561 siRNA (). Taken together, these results indicate that Gm10561 regulates the expression of MEF2C and E2F3 by acting as a ceRNA for miR-432.
Figure 6. Gm10561 regulates MEF2C and E2F3 by targeting miR-432. (a and b) qPCR showing that mRNA expression of MEF2C and E2F3 was significantly reduced by Gm10561 knockdown in proliferating C2C12 myoblasts (a) and C2C12 myoblasts differentiated at 3 days (b). (c and d) Western blotting showing that Gm10561 knockdown decreased MEF2C and E2F3 protein expression in proliferating C2C12 myoblasts (c) and C2C12 myoblasts differentiated at 3 days (d). Expression was quantified using ImageJ. (e and f) Western blotting showing that expression of MEF2C and E2F3 was significantly increased by miR-432 inhibitor transfection in proliferating C2C12 myoblasts (e) and C2C12 myoblasts differentiated at 3 days (f). Expression was quantified using ImageJ. (g) Western blotting showing that Gm10561 knockdown inhibited MEF2C and E2F3 expression in C2C12 myoblasts, but not when co-transfected with miR-432 inhibitor. Relative RNA and protein levels were standardized to β-actin and GAPDH, respectively. Data represent mean ± SD of three independent biological replicates. *P < 0.05; **P < 0.01.
Gm10561 facilitates myogenesis by sponging miR‐432
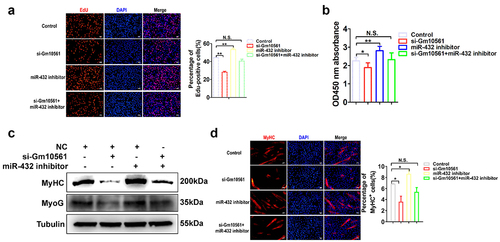
To further verify the function of Gm10561 as a ceRNA for miR-432 in the regulation of myoblast proliferation and differentiation, we performed co-transfection experiments using Gm10561 siRNA and miR-432 inhibitor in C2C12 myoblasts. Transfection of Gm10561 siRNA significantly reduced the proportion of EdU+ cells and cell proliferation. Following transfection with the miR-432 inhibitor, Gm10561 knockdown did not reduce the percentage of EdU+ cells () or cell proliferation (). Furthermore, Gm10561 knockdown remarkably inhibited the protein expression of MyoG and MyHC, but not when co-transfected with miR-432 inhibitor (). Immunofluorescence staining of MyHC also showed that Gm10561 knockdown notably repressed MyHC expression, but not when co-transfected with miR-432 inhibitor (). Overall, these results indicate that Gm10561 facilitates myoblast proliferation and differentiation by acting as a ceRNA for miR-432.
Figure 7. Gm10561 contributes to myogenesis by sponging miR-432. (a) EdU staining showed that the proportion of EdU+ cells was decreased following Gm10561 knockdown in C2C12 myoblasts. When co-transfected with miR-432 inhibitor, Gm10561 knockdown did not reduce the proportion of EdU+ cells. (b) CCK-8 assay detected C2C12 cell proliferation following Gm10561 knockdown for 48h. Gm10561 knockdown suppressed cell proliferation, but not when co-transfected with miR-432 inhibitor. (c) Western blotting showing that Gm10561 knockdown decreased MyoG and MyHC expression, but not when co-transfected with miR-432 inhibitor in C2C12 myotubes. (d) Immunofluorescence staining of MyHC showed that the proportion of MyHC+ cells was decreased following Gm10561 knockdown in C2C12 myotubes. When co-transfected with miR-432 inhibitor, Gm10561 knockdown did not decrease the proportion of MyHC+ cells. Protein expression was normalized to tubulin. Data represent mean ± SD of three independent biological replicates. N.S., not significant; *P < 0.05; **P < 0.01.
Discussion
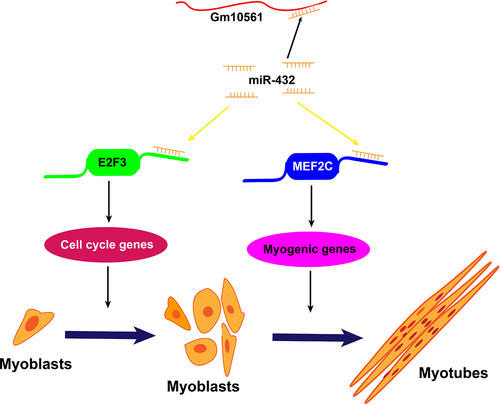
Skeletal muscle is essential for physiological function, force generation, movement, and metabolic performance; as a result, it affects quality of life, chronic diseases, and agricultural animal meat production. Its development is a complex process regulated by multiple signalling pathways in which myogenesis, which includes myoblast proliferation and differentiation, is a vital process. Elucidating the molecular mechanisms of myogenesis will help determine therapeutic targets for muscle disease and improve the quantity and quality of agricultural meat. Although an increasing number of studies have shown that lncRNAs play a vital role in skeletal muscle development, the role of lncRNA Gm10561 in myoblast proliferation and differentiation remains unclear. This study investigated the function of Gm10561 in myogenesis, and explored the interaction and regulatory relationships among Gm10561, miR-432, and downstream targets MEF2C and E2F3. We found that lncRNA Gm10561 regulated the expression of MEF2C and E2F3 by sponging miR-432, thereby accelerating myoblast proliferation and differentiation ().
Figure 8. Model of Gm10561 sponging of miR-432 to accelerate myogenesis. In this model, miR-432 directly targets the 3’ UTR of E2F3 and MEF2C mRNAs to inhibit their expression. E2F3 is known to promote the proliferation of myoblasts, MEF2C is known to promote the differentiation of myoblasts. In proliferating myoblasts, Gm10561 sponges miR-432 to weaken the inhibition of miR-432 on E2F3, and promote E2F3 expression, resulting in enhanced myoblast proliferation. Upon differentiation, Gm10561 sponges miR-432 to attenuate the suppression of miR-432 on MEF2C, increase the expression of MEF2C, and thus promote myoblast differentiation.
Some lncRNAs play functional roles in myoblast proliferation and differentiation, such as lnc-ORA [Citation49], IGF2 AS [Citation50], SMUL [Citation51], and lncIRS1 [Citation52]. In this study, we found that the expression of Gm10561 was upregulated during C2C12 differentiation, consistent with a previous report [Citation41]. Knockdown of Gm10561 remarkably suppressed proliferation and differentiation of C2C12 myoblasts, while Gm10561 overexpression had the opposite effect. Moreover, Gm10561 knockdown in vivo reduced muscle mass and the cross‐sectional area of individual myofibers, suggesting that Gm10561 positively regulates skeletal muscle development.
lncRNAs generally have low sequence conservation compared to mRNAs, although some lncRNAs with low sequence conservation are functionally conserved across species [Citation43]. For example, human JPX and its mouse homolog Jpx differ in both nucleotide sequence and RNA secondary structure; however, both can bind CTCE and play an essential role in X chromosome inactivation [Citation53]. In this study, we did not identify sequence homologues of Gm10561 in humans and pigs; however, when we overexpressed Gm10561 in porcine muscle satellite cells, it resulted in the same effect as overexpression in mouse C2C12 myoblasts, indicating that the function of Gm10561 in myogenesis may be conserved between mice and pigs. Despite loss of primary sequence homology and secondary structure, lncRNAs can have similar functions. A marsupial lncRNA, Rsx, has a functional equivalent, Xist, in regulating X chromosome inactivation, although Rsx has no obvious sequence homology with Xist [Citation53–55]. Thus, lncRNA functions and mechanisms may transcend their primary sequences. Further efforts should be made to clarify the relationship between lncRNA function and the primary sequence.
lncRNAs play regulatory roles not only in the nucleus at the transcriptional level but in the cytoplasm at the post-transcriptional level, suggesting that the subcellular localization of lncRNAs is closely associated with their regulatory mechanism [Citation56]. ceRNA regulatory networks are an important mechanism for cytoplasmic localized lncRNAs [Citation57–59], indicating that cytoplasmic lncRNAs may function as ceRNAs for miRNAs to regulate downstream mRNAs. We found that Gm10561 is primarily localized in the cytoplasm of proliferating myoblasts and differentiated myotubes. We predicted possible miRNAs that may bind Gm10561 and identified miR-432, which negatively modulates myoblast proliferation and differentiation by targeting E2F3 and P55PIK [Citation45]. We also found an interaction among Gm10561, miR-432, and downstream targets E2F3 and MEF2C. E2F3 is a member of the E2F family, which is important in mammalian cell proliferation [Citation60]. Previous studies have demonstrated that E2F3 can promote C2C12 myoblasts proliferation [Citation47,Citation48]. MEF2C, a member of the myocyte enhancer factor-2 (MEF2) transcription factor family, is essential for muscle cell differentiation and sarcomere integrity maintenance [Citation46,Citation61], It can bind the control regions of muscle-specific genes to activate their expression, thus promote myogenic differentiation [Citation62]. Previous studies have shown that activation of MEF2C can induce C2C12 myoblast differentiation [Citation63,Citation64]. Co-transfection assays indicated that Gm10561 regulates E2F3 and MEF2C expression by sponging miR-432 to absorb the effects of miR-432. Therefore, we concluded that Gm10561 promotes myogenesis by competitively binding E2F3 and MEF2C. Nucleocytoplasmic localization showed that some Gm10561 was localized to the nucleus. Given that lncRNAs modulate gene expression through various mechanisms, nuclear lncRNAs may influence chromosome states or bind transcription factors or RNA binding proteins [Citation65]. Thus, Gm10561 may also regulate myogenesis in additional ways.
In conclusion, we described the function and mechanism of the lncRNA Gm10561 in myogenesis. Functionally, Gm10561 promoted the proliferation and differentiation of myoblasts in vitro and skeletal muscle growth in vivo, and Gm10561 overexpression accelerated PSC proliferation and differentiation. Mechanistically, Gm10561 functions as a ceRNA of miR-432 to regulate the expression of MEF2C and E2F3, thus facilitating development of skeletal muscle.
Materials and methods
Animals
C57BL/6 mice were purchased from Guangdong Medical Laboratory Animal Center. Piglet for isolating porcine skeletal muscle satellite cells were obtained from the breeding pig farm of Guangdong Wen’s Foodstuffs Group Co., Ltd. (Yunfu, China). All animal procedures are carried out according to good laboratory practice guidelines and animals were provided with sufficient water and nutritious food. Animal feeding and tests were performed following the National Research Council Guide for the Care and Use of Laboratory Animals and approved by the Animal Care and Use Committee of the South China Agricultural University, Guangzhou, China.
C2C12 myoblasts culture
Mouse myoblasts C2C12 were purchased from the Chinese Academy of Sciences Cell Bank and cultured in a cell incubator of humid environment at 37°C containing 5% CO2. For proliferation culture, the cells were provided with high-glucose Dulbecco’s modified Eagle’s medium (DMEM) containing 10% foetal bovine serum (FBS; Gibco, Australia). To induce differentiation, the culture medium of C2C12 cells was replaced with DMEM supplemented with 2% horse serum (Gibco, Australia).
Porcine muscle satellite cells isolation and culture
Porcine muscle satellite cells (PSCs) were isolated from leg muscles of Duroc gilts within one week according to previous report [Citation66]. Simply, the muscles were cut into pieces, and digested in 2 mg/mL collagenase I (Sigma, USA) at 37°C for 2 h. Digestion was terminated with RPMI 1640 medium (Gibco, Australia) supplemented with 20% FBS (Gibco, Australia) and 1% penicillin-streptomycin (Gibco). Then the cells were in turn filtered through 100-, 200-, and 400-mesh sieves, and wash twice with RPMI 1640. To remove fibroblasts, cells were differential adhesion cultured in RPMI 1640 medium containing 20% FBS, 1% non-essential amino acids (Gibco), 1% GlutaMAX (Gibco), 0.5% chicken embryo extract (Gemini Bio, United States), 4 ng/ml basic fibroblast growth factor (Life Technologies, United States), and 1% penicillin-streptomycin on an uncoated plate for 2 h at 37°C and 5% CO2. Then purified cells were transferred to a collagen‐coated cell culture plates for proliferating culture. To induce differentiation, the culture medium of PSCs was replaced with RPMI 1640 supplemented with 2% horse serum (Gibco, Australia) when the confluence was reached by about 70%.
Plasmid construction, siRNA synthesis, microRNA synthesis
To construct Gm10561v1, Gm10561v2, Gm10561v3 and AK135004 overexpression plasmids, the full lengths of Gm10561v1, Gm10561v2, Gm10561v3 and AK135004 gene were amplified by PCR using Tks GflexTM DNA polymerase (Takara, Japan) and cloned into pcDNA3.1 vector. For dual-luciferase reporter vector construction, full-length Gm10561v1, about 400-bp wild-type and mutant sequences of the 3′ untranslated region (UTR) of E2F3 and MEF2C containing the miR‐432 binding site were amplified by PCR and inserted into pmirGLO Dual‐Luciferase miRNA Target Expression Vector (Promega, USA). The primers used above were listed in Table S1.
Gm10561 siRNA, negative control(NC), miR-432 inhibitor, NC inhibitor, miR-432 mimics, NC mimics were designed and synthesized by GenePharma (Shanghai, China). All oligonucleotide sequences above were listed in Table S2.
Cell transfection
Transfection of C2C12 myoblasts and porcine muscle satellite cells with oligonucleotides or plasmids was conducted with Lipofectamine 3000 reagent (Invitrogen, USA) in accordance with the manufacturer’s protocol.
RNA extraction, cDNA synthesis, and quantitative polymerase chain reaction(qPCR)
Total RNA of cells and tissues were obtained using Trizol reagent (Invitrogen, USA) in accordance with the manufacturer’s instructions. RNA concentration and quality were measured by Nanodrop 2000 (Thermo Fisher Scientific, USA). Complementary DNA (cDNA) synthesis for mRNA and lncRNA was performed using random primer, cDNA synthesis for miR-432 and U6 was conducted using specific stem-loop primer. All cDNA was synthetized by Evo M-MLV RT Kit (AG, China). qPCR was carried out using PowerUpTM SYBRTM Green Master Mix (Thermo Fisher Scientific, USA) on an ABI QuantStudio 7 Flex (Thermo Fisher Scientific, USA) system. Relative RNA expression was analysed using the Ct (2−ΔΔCt) method. The β-actin and U6 were used as internal controls for mRNA and miRNA, respectively. All qPCR primers used in this study were listed in Table S3.
Nuclear and cytoplasmic RNA fractionation
C2C12 cells were washed twice in pre-cooling PBS and digested into individual cells with trypsin. After wash twice with pre-cooling PBS, cells were lysed in nuclear-cytoplasmic lysis buffer (50 Mm Tri-Hcl Ph 8.0, 140 mM Nacl, 1.5 mM Mgcl2, 0.5% IGEPAL®CA-630, 1 U/μL RNase inhibitor, 1 mM DTT) for 5 min on ice. Then cells were centrifuged at 500 g for 3 min, the supernatant was collected and centrifuged again at 14,000 g for 1 min, the supernatant was then collected as the cytoplasmic fraction. The remaining precipitate for the first centrifugation was resuspended in nuclear-cytoplasmic lysis buffer, after centrifugation, the supernatant was discarded and the precipitate was collected as nuclear fraction. Then the cytoplasmic fraction and nuclear fraction were extracted using Trizol reagent (Invitrogen, USA).
Cell counting Kit‐8 (CCK‐8) assays
Cells were seeded in a 96-well plate, transfection was performed when the cells density reach about 50%, the CCK-8 assay was conducted using the CCK-8 Cell Counting Kit (BOSTER, China) following manufacturer’s instructions after 12, 24, 36, and 48h transfection. The cell proliferation ability was monitored by measuring the absorbance at 450 nm in a SYNERGY H1 microplate reader (PioTek, USA).
5‐ethynyl‐2′‐deoxyuridine (EdU) staining
EdU staining was performed using BeyoClick™ EdU Cell Proliferation Kit (Beyotime, China) following manufacturer’s instructions. Briefly, cells were fixed in 4% paraformaldehyde, and permeabilized in 0.5% Triton X-100, then the cells were stained with Click Additive Solution at dark for 30 min, the nuclei were stained with 4’,6-diamidino-2-phenylindole (DAPI) solution. Images were captured with a Nikon ECLIPSE Ti microscope, and the ImageJ software was used to calculate the proportion of EdU positive cells.
Western blotting
Total protein of cells and tissues were lysed in RIPA buffer containing 1% PMSF (Beyotime Biotechnology, China), and heated at 95°C for 5 min in 6× protein loading buffer. Western blotting was performed as previous described [Citation10]. The primary antibodies were as follows: MyoD (sc-377460; 1:1000; Santa Cruz Biotechnology), MyoG (sc-12732; 1:200; Santa Cruz Biotechnology), MyHC (sc-376157; 1:3000; Santa Cruz Biotechnology), E2F3 (A8811; 1:1000; ABclonal), MEF2C (GB111249; 1:500; Servicebio), β-Tubulin (GB11017B; 1:1000; Servicebio), GAPDH (abs132004; 1:3000; Absin). The secondary antibodies were Goat Anti-Mouse IgG (A0216; 1:3000; Beyotime) and Goat Anti-Rabbit IgG (A0208; 1:3000; Beyotime). Intensity of the protein bands were visualized by ImageJ, and relative protein expression level was normalized to that of β-Tubulin or GAPDH.
Cell immunofluorescence staining
Cells were immobilized with 4% paraformaldehyde after 48 or 72 h transfection, and permeabilized in 0.5% Triton X-100. The cells were blocked in QuickBlock™ Blocking Buffer (Beyotime, China) for 2 h in 37°C, and then incubated with primary antibody including MyoG (sc-12732; 1:100; Santa Cruz Biotechnology), MyHC (sc-376157; 1:200; Santa Cruz Biotechnology) overnight. The next day, cells were washed with PBS and incubated with a secondary antibody Cy3-labelled Goat Anti-Mouse IgG (A0521; Beyotime). DAPI reagent was used to stain the nuclei. Images of at least three random field of view were captured using a Nikon ECLIPSE Ti microscope. The differentiation index was obtained by calculating a ratio of MyHC+ nuclei in the total nuclei.
Lentivirus infection
The interference lentivirus LV3-sh-Gm10561 and LV3-sh-NC were produced by GenePharma (Shanghai, China) at a titre of 1 × 10⁹ TU/mL. The injection was performed in ten 6-week-old male C57BL/6 mice. In detail, the lentivirus was diluted with PBS to a final titre of 5 × 10⁸ TU/mL before injection. Each mouse was injected with a final volume of 100 μL LV3-sh-Gm10561 or LV3-sh-NC control lentivirus in the left or right of the hind legs, respectively. The injection was performed in quadriceps (Qu), tibialis anterior (TA) and gastrocnemius (Gas) muscles of the hind legs once a week for one month. One week after the last injection, mice were sacrificed, and the weight of each mouse and its Qu, TA, Gas muscles were weighed and recorded. The Qu, TA, Gas muscles were immediately put into liquid nitrogen and then stored in −80°C for RNA and protein extraction or fixed in 4% paraformaldehyde for histology staining.
Haematoxylin and eosin (H&E) staining
The Qu, TA, Gas muscles were fixed in 4% paraformaldehyde, embedded into paraffin, and cut into 4 μm thin slices of cross sections. H&E staining of muscle sections was performed following previous described [Citation34]. At least three random field images of cross-sectional areas of single muscle fibres were taken using a Nikon ECLIPSE Ci microscope, and images were analysed using the ImageJ software.
Dual‐luciferase reporter assay
To verified that Gm10561 or MEF2C interact with miR-432, the wild-type and mutant pmirGLO Dual‐Luciferase miRNA Target Expression Vector of Gm10561 or MEF2C were co-transfected into C2C12 cells with miR-432 mimics, respectively. To detect whether Gm10561 affects the binding of MEF2C or E2F3 to miR-432, the wild-type pmirGLO Dual‐Luciferase miRNA Target Expression Vector of MEF2C or E2F3 was co-transfected into C2C12 cells with miR-432 mimics and Gm10561 overexpression vector. After transfection for 48 h, the dual-luciferase reporter assay was performed using Dual Luciferase Reporter Gene Assay Kit (YEASEN, shanghai, China), and the luciferase activities of firefly and renilla were measured using a SYNERGY H1 microplate reader (PioTek, USA).
RNA immunoprecipitation (RIP) assay
To confirm the sponge effect of Gm10561 on miR-432, we performed RNA immunoprecipitation assay of Ago2, which is a key effector of miRNA mediated gene silencing [Citation44], using EZ-Magna RIP Kit (Millipore, Billerica, MA, USA) according to the manufacturer’s instructions. Briefly, C2C12 myoblasts were lysed with RIP lysis buffer, then the cell lysates were incubated with A/G magnetic beads conjugated with 5 ug antibody (Ago2, Abcam, ab32381; IgG, Millipore) for RNA immunoprecipitation. Further, the immunoprecipitated RNA was isolated and purified. The detection of co-precipitated RNAs was performed using qRT-PCR.
RNA sequencing and data analysis
RNA of Gm10561 knockdown and control groups in C2C12 cells was extracted using Trizol reagent. RNA concentration and quality were measured by Nanodrop 2000 (Thermo Fisher Scientific, USA), and RNA integrity evaluated by agarose gel electrophoresis. The library was prepared, constructed, and sequenced on Illumina high throughput sequencing platform novaseq 6000 (Novogene, Beijing, China). The raw data was cleaned by removing adaptor sequences, reads containing more than 5% Ns, short reads, and low-quality reads with quality score < 20 to obtain the qualified clean data. The clean reads were mapped to mouse reference genome (mm10) using Hisat2 [Citation67], and assembled with StringTie (v2.1.1) [Citation68] to construct and identify transcripts. The gene read counts were calculated by featureCounts [Citation69] and normalized to the transcripts per kilobase million (TPM). Differential gene expression analysis between Gm10561 knockdown and control groups was performed using the R package DESeq2 [Citation70]. Differentially expressed genes were identified based on log2 fold change (log2FC) ≥|1| and p-value < 0.05. To figure out the functions of each protein-coding gene, we performed Gene ontology (GO) analyses and Kyoto Encyclopaedia of Genes and Genomes (KEGG) pathway analyses using PANTHER [Citation71] and KOBAS-I [Citation72], respectively. A p value < 0.05 were considered significant for GO terms and pathways categories.
Statistical analysis
Data are presented as means ± standard deviation (SD) for at least triplicates. Differences between different groups were analyzed by two-tailed Student’s t-test. A p-value < 0.05 was considered to be statistically significant. The significance was marked as * P < 0.05 and ** P < 0.01.
Author contributions
SW and BT performed the experiments, interpreted results, and wrote manuscript and they were approved the manuscript to be published. LX, JZ and XZ helped perform some experiments and they were approved the manuscript to be published. LH, ZL, GC, and EZ participated in the design of the project and revised the manuscript and they were approved the manuscript to be published. TG and ZW conceived the project, revised manuscript and final approval of manuscript.
Supplemental Material
Download Zip (3.9 MB)Data availability statement
The authors confirm that the data supporting the findings of this study are available within the article and/or its supplementary materials. The sequencing data for RNA-seq in this study have been uploaded to online repositories. The name of the repository and accession number can be found below: https://www.ncbi.nlm.nih.gov/bioproject/PRJNA851100/, PRJNA851100.
Disclosure statement
No potential conflict of interest was reported by the author(s).
Supplementary material
Supplemental data for this article can be accessed online at https://doi.org/10.1080/15592294.2022.2105052
Additional information
Funding
Related Research Data
References
- Mills RJ, Parker BL, Monnot P, et al. Development of a human skeletal micro muscle platform with pacing capabilities. Biomaterials. 2019;198:217–227.
- Bowen TS, Schuler G, Adams V. Skeletal muscle wasting in cachexia and sarcopenia: molecular pathophysiology and impact of exercise training. J Cachexia Sarcopenia Muscle. 2015;6:197–207.
- Godfrey R, Quinlivan R. Skeletal muscle disorders of glycogenolysis and glycolysis. Nat Rev Neurol. 2016;12:393–402.
- Zhang Y, Li Y, Hu Q, et al. The lncRNA H19 alleviates muscular dystrophy by stabilizing dystrophin. Nat Cell Biol. 2020;22:1332–1345.
- Chal J, Pourquie O. Making muscle: skeletal myogenesis in vivo and in vitro. Development. 2017;144:2104–2122.
- Musumeci G, Castrogiovanni P, Coleman R, et al. Somitogenesis: from somite to skeletal muscle. Acta Histochem. 2015;117:313–328.
- Bober E, Franz T, Arnold HH, et al. Pax-3 is required for the development of limb muscles: a possible role for the migration of dermomyotomal muscle progenitor cells. Development. 1994;120:603–612.
- Maroto M, Reshef R, Munsterberg AE, et al. Ectopic Pax-3 activates MyoD and Myf-5 expression in embryonic mesoderm and neural tissue. Cell. 1997;89:139–148.
- Buckingham M, Relaix F. The role of Pax genes in the development of tissues and organs: pax3 and Pax7 regulate muscle progenitor cell functions. Annu Rev Cell Dev Biol. 2007;23:645–673.
- Wang S, Xu X, Liu Y, et al. RIP-Seq of EZH2 Identifies TCONS-00036665 as a regulator of myogenesis in pigs. Front Cell Dev Biol. 2020;8:618617.
- Parker MH, Seale P, Rudnicki MA. Looking back to the embryo: defining transcriptional networks in adult myogenesis. Nat Rev Genet. 2003;4:497–507.
- Naya FJ, Olson E. MEF2: a transcriptional target for signaling pathways controlling skeletal muscle growth and differentiation. Curr Opin Cell Biol. 1999;11:683–688.
- Yang Y, Fan X, Yan J, et al. A comprehensive epigenome atlas reveals DNA methylation regulating skeletal muscle development. Nucleic Acids Res. 2021;49:1313–1329.
- Zhu X, Lan B, Yi X, et al. HRP2-DPF3a-BAF complex coordinates histone modification and chromatin remodeling to regulate myogenic gene transcription. Nucleic Acids Res. 2020;48:6563–6582.
- Luo H, Lv W, Tong Q, et al. Functional non-coding RNA during embryonic myogenesis and postnatal muscle development and disease. Front Cell Dev Biol. 2021;9:628339.
- Carninci P, Kasukawa T, Katayama S, et al. The transcriptional landscape of the mammalian genome. Science. 2005;309:1559–1563.
- Derrien T, Johnson R, Bussotti G, et al. The GENCODE v7 catalog of human long noncoding RNAs: analysis of their gene structure, evolution, and expression. Genome Res. 2012;22:1775–1789.
- Dong A, Preusch CB, So WK, et al. A long noncoding RNA, LncMyoD, modulates chromatin accessibility to regulate muscle stem cell myogenic lineage progression. Proc Natl Acad Sci U S A. 2020;117:32464–32475.
- Ponting CP, Oliver PL, Reik W. Evolution and functions of long noncoding RNAs. Cell. 2009;136:629–641.
- Jia H, Osak M, Bogu GK, et al. Genome-wide computational identification and manual annotation of human long noncoding RNA genes. RNA. 2010;16:1478–1487.
- Brockdorff N, Ashworth A, Kay GF, et al. Conservation of position and exclusive expression of mouse Xist from the inactive X chromosome. Nature. 1991;351:329–331.
- Ye B, Liu B, Yang L, et al. LncKdm2b controls self-renewal of embryonic stem cells via activating expression of transcription factor Zbtb3. EMBO J. 2018;37. DOI:10.15252/embj.201797174
- Satpathy AT, Chang HY. Long noncoding RNA in hematopoiesis and immunity. Immunity. 2015;42:792–804.
- Flynn RA, Chang HY. Long noncoding RNAs in cell-fate programming and reprogramming. Cell Stem Cell. 2014;14(6):752–761.
- Li M, Duan L, Li Y, et al. Long noncoding RNA/circular noncoding RNA-miRNA-mRNA axes in cardiovascular diseases. Life Sci. 2019;233:116440.
- Lodde V, Murgia G, Simula ER, et al. Long noncoding RNAs and circular RNAs in autoimmune diseases. Biomolecules. 2020;10:1044.
- Hua JT, Chen S, He HH. Landscape of noncoding RNA in prostate cancer. Trends Genet. 2019;35:840–851.
- Yousefi H, Maheronnaghsh M, Molaei F, et al. Long noncoding RNAs and exosomal lncRNAs: classification, and mechanisms in breast cancer metastasis and drug resistance. Oncogene. 2020;39:953–974.
- Clemson CM, McNeil JA, Willard HF, et al. XIST RNA paints the inactive X chromosome at interphase: evidence for a novel RNA involved in nuclear/chromosome structure. J Cell Biol. 1996;132:259–275.
- Nagano T, Mitchell JA, Sanz LA, et al. The air noncoding RNA epigenetically silences transcription by targeting G9a to chromatin. Science. 2008;322(5908):1717–1720.
- Wang KC, Chang HY. Molecular mechanisms of long noncoding RNAs. Mol Cell. 2011;43:904–914.
- Tsai MC, Manor O, Wan Y, et al. Long noncoding RNA as modular scaffold of histone modification complexes. Science. 2010;329:689–693.
- Kino T, Hurt DE, Ichijo T, et al. Noncoding RNA gas5 is a growth arrest- and starvation-associated repressor of the glucocorticoid receptor. Sci Signal. 2010;3:ra8.
- Zhu M, Liu J, Xiao J, et al. Lnc-mg is a long non-coding RNA that promotes myogenesis. Nat Commun. 2017;8:14718.
- Jin JJ, Lv W, Xia P, et al. Long noncoding RNA SYISL regulates myogenesis by interacting with polycomb repressive complex 2. Proc Natl Acad Sci U S A. 2018;115:E9802–E9811.
- Wang S, Zuo H, Jin J, et al. Long noncoding RNA Neat1 modulates myogenesis by recruiting Ezh2. Cell Death Dis. 2019;10:505.
- Chen X, He L, Zhao Y, et al. Malat1 regulates myogenic differentiation and muscle regeneration through modulating MyoD transcriptional activity. Cell Discov. 2017;3:17002.
- Zhou L, Sun K, Zhao Y, et al. Linc-YY1 promotes myogenic differentiation and muscle regeneration through an interaction with the transcription factor YY1. Nat Commun. 2015;6:10026.
- Zhang ZK, Li J, Guan D, et al. A newly identified lncRNA MAR1 acts as a miR-487b sponge to promote skeletal muscle differentiation and regeneration. J Cachexia Sarcopenia Muscle. 2018;9:613–626.
- Militello G, Hosen MR, Ponomareva Y, et al. A novel long non-coding RNA Myolinc regulates myogenesis through TDP-43 and Filip1. J Mol Cell Biol. 2018;10:102–117.
- Qi X, Hu M, Xiang Y, et al. LncRNAs are regulated by chromatin states and affect the skeletal muscle cell differentiation. Cell Prolif. 2020;53:e12879.
- Kang Y-J, Yang D-C, Kong L, et al. CPC2: a fast and accurate coding potential calculator based on sequence intrinsic features. Nucleic Acids Res. 2017;45:W12–W16.
- Ransohoff JD, Wei Y, Khavari PA. The functions and unique features of long intergenic non-coding RNA. Nat Rev Mol Cell Biol. 2018;19:143–157.
- Zhang H, Wang Y, Dou J, et al. Acetylation of AGO2 promotes cancer progression by increasing oncogenic miR-19b biogenesis. Oncogene. 2019;38:1410–1431.
- Ma M, Wang X, Chen X, et al. MicroRNA-432 targeting E2F3 and P55PIK inhibits myogenesis through PI3K/AKT/mTOR signaling pathway. RNA Biol. 2017;14:347–360.
- Potthoff MJ, Arnold MA, McAnally J, et al. Regulation of skeletal muscle sarcomere integrity and postnatal muscle function by Mef2c. Mol Cell Biol. 2007;27:8143–8151.
- Gan M, Du J, Shen L, et al. miR-152 regulates the proliferation and differentiation of C2C12 myoblasts by targeting E2F3. Vitro Cell Dev Biol Anim. 2018;54:304–310.
- Song C, Wu G, Xiang A, et al. Over-expression of miR-125a-5p inhibits proliferation in C2C12 myoblasts by targeting E2F3. Acta Biochim Biophys Sin. 2015;47:244–249.
- Cai R, Zhang Q, Wang Y, et al. Lnc-ORA interacts with microRNA-532-3p and IGF2BP2 to inhibit skeletal muscle myogenesis. J Biol Chem. 2021;296:100376.
- Song C, Yang Z, Jiang R, et al. lncRNA IGF2 AS regulates bovine myogenesis through different pathways. Mol Ther Nucleic Acids. 2020;21:874–884.
- Cai B, Li Z, Ma M, et al. Long noncoding RNA SMUL suppresses SMURF2 production-mediated muscle atrophy via nonsense-mediated mRNA decay. Mol Ther Nucleic Acids. 2021;23:512–526.
- Li Z, Cai B, Abdalla BA, et al. LncIRS1 controls muscle atrophy via sponging miR-15 family to activate IGF1-PI3K/AKT pathway. J Cachexia Sarcopenia Muscle. 2019;10:391–410.
- Karner H, Webb CH, Carmona S, et al. Functional conservation of LncRNA JPX despite sequence and structural divergence. J Mol Biol. 2020;432:283–300.
- Grant J, Mahadevaiah SK, Khil P, et al. Rsx is a metatherian RNA with Xist-like properties in X-chromosome inactivation. Nature. 2012;487:254–258.
- Sado T, Brockdorff N. Advances in understanding chromosome silencing by the long non-coding RNA Xist. Philos Trans R Soc Lond B Biol Sci. 2013;368:20110325.
- Kopp F, Mendell JT. Functional classification and experimental dissection of long noncoding RNAs. Cell. 2018;172:393–407.
- Zheng ZQ, Li ZX, Zhou GQ, et al. Long noncoding RNA FAM225A promotes nasopharyngeal carcinoma tumorigenesis and metastasis by acting as ceRNA to sponge miR-590-3p/miR-1275 and upregulate ITGB3. Cancer Res. 2019;79:4612–4626.
- Bai Y, Long J, Liu Z, et al. Comprehensive analysis of a ceRNA network reveals potential prognostic cytoplasmic lncRNAs involved in HCC progression. J Cell Physiol. 2019;234(10):18837–18848.
- Feng Y, Xu W, Zhang W, et al. LncRNA DCRF regulates cardiomyocyte autophagy by targeting miR-551b-5p in diabetic cardiomyopathy. Theranostics. 2019;9:4558–4566.
- Leone G, DeGregori J, Yan Z, et al. E2F3 activity is regulated during the cell cycle and is required for the induction of S phase. Genes Dev. 1998;12:2120–2130.
- Lilly B, Zhao B, Ranganayakulu G, et al. Requirement of MADS domain transcription factor D-MEF2 for muscle formation in Drosophila. Science. 1995;267:688–693.
- Lin Q, Schwarz J, Bucana C, et al. Control of mouse cardiac morphogenesis and myogenesis by transcription factor MEF2C. Science. 1997;276:1404–1407.
- Gagan J, Dey BK, Layer R, et al. Notch3 and Mef2c proteins are mutually antagonistic via Mkp1 protein and miR-1/206 microRNAs in differentiating myoblasts. J Biol Chem. 2012;287:40360–40370.
- Zetser A, Gredinger E, Bengal E. p38 mitogen-activated protein kinase pathway promotes skeletal muscle differentiation. Participation of the Mef2c transcription factor. J Biol Chem. 1999;274:5193–5200.
- Chen LL. Linking Long Noncoding RNA Localization and Function. Trends Biochem Sci. 2016;41:761–772.
- Wang S, Sun Y, Ren R, et al. H3K27me3 depletion during differentiation promotes myogenic transcription in porcine satellite cells. Genes. 2019;10:231.
- Kim D, Langmead B, Salzberg SL. HISAT: a fast spliced aligner with low memory requirements. Nat Methods. 2015;12:357–360.
- Pertea M, Pertea GM, Antonescu CM, et al. StringTie enables improved reconstruction of a transcriptome from RNA-seq reads. Nat Biotechnol. 2015;33:290–295.
- Liao Y, Smyth GK, Shi W. featureCounts: an efficient general purpose program for assigning sequence reads to genomic features. Bioinformatics. 2014;30:923–930.
- Love MI, Huber W, Anders S. Moderated estimation of fold change and dispersion for RNA-seq data with DESeq2. Genome Biol. 2014;15:550.
- Mi H, Huang X, Muruganujan A, et al. PANTHER version 11: expanded annotation data from gene ontology and reactome pathways, and data analysis tool enhancements. Nucleic Acids Res. 2017;45:D183–D189.
- Bu D, Luo H, Huo P, et al. KOBAS-i: intelligent prioritization and exploratory visualization of biological functions for gene enrichment analysis. Nucleic Acids Res. 2021;49:W317–W325.