
 ?Mathematical formulae have been encoded as MathML and are displayed in this HTML version using MathJax in order to improve their display. Uncheck the box to turn MathJax off. This feature requires Javascript. Click on a formula to zoom.
ABSTRACT
Differentially methylated regions (DMRs) are genomic regions with specific methylation patterns across multiple loci that are associated with a phenotype. We examined the genome-wide false positive (GFP) rates of five widely used DMR methods: comb-p, Bumphunter, DMRcate, mCSEA and coMethDMR using both Illumina HumanMethylation450 (450 K) and MethylationEPIC (EPIC) data and simulated continuous and dichotomous null phenotypes (i.e., generated independently of methylation data). coMethDMR provided well-controlled GFP rates (~5%) except when analysing skewed continuous phenotypes. DMRcate generally had well-controlled GFP rates when applied to 450 K data except for the skewed continuous phenotype and EPIC data only for the normally distributed continuous phenotype. GFP rates for mCSEA were at least 0.096 and comb-p yielded GFP rates above 0.34. Bumphunter had high GFP rates of at least 0.35 across conditions, reaching as high as 0.95. Analysis of the performance of these methods in specific regions of the genome found that regions with higher correlation across loci had higher regional false positive rates on average across methods. Based on the false positive rates, coMethDMR is the most recommended analysis method, and DMRcate had acceptable performance when analysing 450 K data. However, as both could display higher levels of FPs for skewed continuous distributions, a normalizing transformation of skewed continuous phenotypes is suggested. This study highlights the importance of genome-wide simulations when evaluating the performance of DMR-analysis methods.
Introduction
Background
DNA methylation is an epigenetic mechanism that usually occurs at CpG sites in the eukaryotic genome. It is involved in many cellular processes, including embryonic development, genomic imprinting, X-chromosome inactivation, and preservation of chromosome stability [Citation1]. DNA methylation plays a critical role in regulating gene expression. Studies have linked DNA methylation to various human diseases, such as cancer [Citation2,Citation3], schizophrenia [Citation4] and PTSD [Citation5,Citation6].
Sequencing and array-based techniques are both used to quantitatively measure methylation patterns. Although whole-genome bisulphite sequencing (WGBS) is the most comprehensive approach, it may be cost-prohibitive for large epigenome-wide association studies (EWASs). Microarrays offer a more affordable alternative for measuring methylation across the genome. The Infinium HumanMethylation450 BeadChip (450 K chip) and the Infinium Methylation EPIC BeadChip (EPIC chip) are two commonly used platforms though the 450 K chips have been discontinued by the manufacturer and replaced by the EPIC chips. The 450 K chip measures methylation proportions at 485,577 cytosine positions across the genome, whereas the EPIC chip covers 853,307 CpG sites [Citation7]. The EPIC chip was designed to place probes in regulatory regions that lacked coverage on the 450 K chip, by placing a single representative probe in each region [Citation8]. The EPIC chip design also excluded probes from some regulatory regions when there was a high correlation between adjacent CpG sites measured on the 450 K chip. Both the placing of probes within new regulatory regions and the trimming of redundant probes lead to a lower correlation between probes assessed on the EPIC chip relative to the 450 K chip. Both arrays have enabled substantial growth in EWASs that investigate methylation in a wide range of phenotypes.
Differentially methylated regions (DMRs) are genomic regions with methylation patterns spanning multiple CpG sites that are associated with a phenotype. As methylation at nearby CpG sites tend to be correlated [Citation9], studying sets of sites rather than individual sites may yield stronger associations and higher power to detect differences in methylation. Additionally, it may increase statistical power by reducing the multiple-testing correction burden [Citation10]. Several supervised and unsupervised statistical approaches and tools exist for identifying DMRs. Supervised methods test phenotype associations at single CpG sites and subsequently define genomic regions based on a method-specific function of effect size estimates, then compute regional significance with multiple testing corrections to find DMRs [Citation11]. By contrast, unsupervised methods examine pre-defined genomic regions based on array annotations and test for associations between a phenotype and CpGs within those pre-defined regions [Citation11]. Commonly used supervised methods include Bumphunter [Citation12], comb-p [Citation13], DMRcate [Citation14], and Probe Lasso [Citation15]. Unsupervised methods include mCSEA [Citation16], coMethDMR [Citation17], and GlobalP [Citation18].
A few prior publications have reported comparisons of several commonly used DMR methods. Mallik et al. [Citation11] evaluated four supervised methods (DMRcate, Bumphunter, Probe Lasso and comb-p) using 450 K arrays under 60 different parameter settings, and found that all four approaches had well-controlled type I error rates but their power widely varied as a function of the parameter settings. However, the conclusions from Mallik’s study were based on simulations with 3,063 CpG clusters of adjacent CpG probes and were not genome-wide. Chen et al. [Citation19] reviewed several supervised and unsupervised DMR technologies that were developed for sequence- and array-based methylation data. They noted that each method had good performance in the simulation with original parameters settings and could be complementary to each other and they recommended using multiple methods to identify DMRs. While Chen’s study included an extensive review, they only evaluated the performance of two approaches (ICDMR [Citation20] and QDMR [Citation21]) using the custom-designed NimbleGen microarrays (CHARM human array) and did not perform null simulations. Lent et al. [Citation18] compared DMRs identified by DMRcate, Bumphunter, and comb-p to those identified by GlobalP on 450 K array data. They found that GlobalP detected two additional DMRs not identified by DMRcate and comb-p, but Bumphunter showed no overlapping DMRs with the other three methods. Due to the computational burdens involved, Lent’s study only performed genome-wide null simulations on GlobalP to evaluate the type I error rate. As far as we know, no comprehensive comparisons of false positive rates (FPRs) have been made based on genome-wide simulation studies with methylation data.
In this study, we compared the performance of five popular array-based DMR methods (Bumphunter, comb-p, DMRcate, mCSEA and coMethDMR) evaluating type I errors (FPs) and computation burden across the two commonly available array types: 450 K and EPIC. Methods for analysing sequence-based data were not considered in this study. A summary of each method can be found in . The evaluation was based on the FPRs and computation burden in peak memory and cumulative running time, using simulated null phenotypes and autosomal genome-wide data from 450 K and EPIC arrays. We also examined the association between regional characteristics (e.g., size and number of CpGs) and FPRs. Because the FPRs of genomic regions including DMRs reported by method might depend on different patterns of regional characteristics, for example, the degree of correlation between CpG methylation within a region.
Table 1. Summary of DMR methods.
DMR methods
Bumphunter
Bumphunter [Citation12] identifies DMRs via genomic array data by first linearly regressing methylation of individual CpG sites on the phenotype, measured confounders (e.g., sex and age), and unmeasured confounders due to batch effects estimated via surrogate variable analysis (SVA) [Citation22]. Loess [Citation23] is applied across CpGs to produce smoothed phenotype effect size estimates. Bumphunter views the effect size estimates as a straight line along the genome with bumps and aims to capture those bumps as candidate regions. Candidate regions are captured based on smoothed estimates that exceed a user-predetermined threshold. Permutation tests are then conducted to compute empirical p-values, together with both a false discovery rate (FDR) correction and a family-wise error rate (FWER) correction [Citation24]. Bootstrap [Citation25] is also available as a less time-consuming substitute for permutations and is recommended especially when any covariates are included in the analysis.
Bumphunter is implemented in multiple R packages, such as bumphunter, ChAMP and minfi [Citation26]. All these three packages can be applied to 450 K data, and we adopted minfi in this study to evaluate the performance of Bumphunter. The minfi pipeline can be extended to support the EPIC array by downcoding an EPIC array to a virtual 450 K array, where probes that differ between the two arrays are dropped [Citation27]. To mirror the empirical situations, when implementing Bumphunter as well as other DMR methods, we used default or recommended parameter settings as summarized in . A smoothing function was enabled as recommended by Jaffe et al. using smooth = T and smoothFunction = loessByCluster [Citation12]. The bootstrap method was chosen with B = 1000, and other default settings were also used by specifying maxGap = 500 and pickCutoffQ = 0.99. Regions with at least two probes were retained, which was also applied to other methods. We noticed that not all packages enabled using a smoothing function for Bumphunter, thus we also performed Bumphunter without using smoothed estimates (denoted as BumphunterNS to differentiate from Bumphunter using a smoothing function).
Table 2. Summary of DMR Implementations.
Comb-p
The comb-p method [Citation13] identifies DMRs based on EWAS summary statistics, to be specific, p-values at each CpG site on the chromosome. It was built based on the method developed by Kechris [Citation28]. The method first computes autocorrection function (ACF) between p-values to estimate the pattern of correlation between probes across the genome based on distance. The Stouffer-Liptak-Kechris (SLK) correction is applied to each original p-value, which adjusts the p-value using the Stouffer–Liptak method [Citation29,Citation30] to its neighbouring p-values as weighted according to the ACF. Then, comb-p uses the peak-finding algorithm to find enrichment regions with SLK-corrected p-values. Once the regions are identified, the regional significance is computed using original p-values with Stouffer-Liptak correction and with a further Šidák correction [Citation31] to account for multiple testing.
The comb-p program is a command-line tool and is implemented in python, which takes BED files of p-values as input. We used comb-p parameters (–seed 0.001, – dist 200 and – region-filter-p 0.1) based on the authors’ illustrated example dated as of January 2021 on Github (https://github.com/brentp/combined-pvalues). The seed option is to specify the cut-off of the p-value to start a region and the dist option is to extend a region if another p-value is found within this distance. The initial input of p-values in this study was obtained by running linear models and empirical Bayes methods using the R package limma.
DMRcate
DMRcate [Citation14] can identify DMRs from the human genome using WGBS and Illumina Infinium Array (450 K and EPIC) data. DMRcate first computes an EWAS of the phenotype of interest using a linear model, and then computes the square of the per-CpG t-statistic and applies Gaussian smoothing within a given bandwidth, . Then, DMRcate models the smoothed test statistics using Satterthwaite methods [Citation32] and computes p-values at each CpG using this model with Benjamini-Hochberg false discovery rate (FDR) correction [Citation33]. CpG sites with FDR-adjusted p-values smaller than a given threshold (usually 0.05) will be retained, and nearby significant CpG sites will be collapsed as regions using the same bandwidth,
. The minimum FDR-adjusted p-value in the region is reported as representative. DMRcate is implemented in the R package DMRcate. We used the default value of 0.05 as the cut-off for selecting significant CpG sites and calling DMRs.
mCSEA (methylated CpGs set enrichment analysis)
The mCSEA method [Citation16] identifies DMRs from Illumina array data (450 K/EPIC) and was designed to identify subtle but consistent methylation differences related to complex phenotypes. It was built based on a Gene Set Enrichment Analysis (GSEA) method [Citation34] and modifies pre-defined gene sets in the GSEA-based analysis to be sets of CpG sites in the pre-defined regions. Three types of pre-defined regions (CpG islands (CGI), gene bodies and promoters) are offered, and user-defined regions are allowed. GSEA determines the significance of pre-defined gene sets by selecting the top and bottom tails of gene sets from the ranking list. To be specific, for each given gene set, GSEA calculates an enrichment score (ES) through a weighted Kolmogorov-Smirnov-like statistic [Citation35] and uses permutations to compute the empirical nominal p-value of the ES. FDR is applied to account for multiple hypothesis testing. Similarly, mCSEA first ranks all CpG sites based on the t-statistic assessing the association between methylation and phenotype from linear models using the R package limma or a pre-sorted list. It then performs an enrichment analysis on GpG sites in pre-defined regions by applying the GSEA as implemented in the R package fgsea. Regions with CpG sites over-represented in the ordered list of sites would be detected as DMRs. mCSEA is implemented in the R package mCSEA. Analyses were tested on all three available pre-defined regions (regionsTypes = c(‘promoters,’ ‘genes,’ ‘CGI’)).
coMethDMR
Gomez [Citation17] presents an unsupervised method to identify DMRs by additionally selecting co-methylated regions (i.e., collections of correlated sites) within a genome-wide class of CpGs without using any outcome information. Given the chosen regions, clusters of CpG probes are extracted by default with at least three CpGs and a max gap of up to 200 bp between any two consecutive probes. The co-methylated sub-regions are further selected by keeping all of the contiguous CpGs with rdrop statistics greater than a pre-determined threshold (0.4 by default). As described by Gomez [Citation17], ‘The rdrop statistics are the leave-one-out correlations between CpG with the sum of methylation levels in all other CpGs using methylation M-values.’ The coMethDMR then applies a mixed-effects model to test groups of CpGs against continuous phenotype. Both a random coefficient mixed model and a simple linear mixed model are available to choose from, where the former additionally includes random probe effects (i.e., how each CpG varies concerning the group mean). FDR-corrected p-values are reported to account for multiple testing.
The method coMethDMR is implemented in the R package coMethDMR and offers two pre-defined regions (genic and intergenic) on Illumina arrays. The default values were applied for both the rdrop statistics cut-off (rDropThresh_num = 0.4) and the minimum number of CpGs to be considered a ‘region’ when selecting co-methylated sub-regions (minCpGs = 3). The proposed random coefficient mixed model (modelType = ‘randCoef’) was used for all analyses.
Methods
Study population
To maintain the correlations among covariates and among CpG sites, we used real covariates and corresponding methylation array data from several studies with simulated phenotypes. Methylation data were obtained from two datasets based on the 450 K and one based on EPIC chips.
For the 450 K array, we used the GEO data GSE56046 from the MESA Epigenomics and Transcriptomics Study [Citation36], denoted as the 450 K-Mono. This dataset had 1202 subjects and is publicly available at https://www.ncbi.nlm.nih.gov/geo/query/acc.cgi?acc=GSE56046. Its DNA methylation was measured on purified CD14+ monocytes derived from peripheral blood at 485,577 CpG sites passing quality control filters. To reduce the potential batch effects for the dichotomous phenotype, we used a chip-balanced design for both arrays, which allowed us to assign an equal number of cases to each chip [Citation37]. To apply this experimental design, we only adopted full chips where no samples on a chip were dropped due to quality issues or missing data. The 450 K-Mono dataset contains 44 full chips with 12 subjects on each. We randomly selected eight full chips (12 samples per chip, 96 subjects total). The same chips were used in different simulations, which were also true for other data cohorts.
The second dataset denoted as the 450 K-WB was based on a study from the National Center for PTSD (NCPTSD) and involved 466 veterans and their intimate partners, which has been implemented with a PTSD consortium pipeline for quality control (QC) [Citation38,Citation39]. One subject was dropped due to missing age. Methylation was measured from whole blood at 453,466 CpG sites passing QC filters. To investigate the performance of cohorts using 450 K arrays without a balanced chip design, a total of 96 subjects were randomly selected regardless of chip ids.
For the EPIC array, the data were from the Translational Research Center for TBI and Stress Disorders (TRACTS) cohort (denoted as the EPIC-WB), which also followed the same pipeline for the NCPTSD cohort [Citation40,Citation41]. The EPIC-WB dataset included 541 subjects, and its whole blood methylation data include 819,877 CpG sites passing QC filters. Eleven subjects were dropped due to missing covariates. Among 530 subjects, there are 17 full EPIC chips with eight subjects on each available. For EPIC-WB we utilized a chip-balanced design, and, as the EPIC array only assesses eight samples per chip, 12 full chips were randomly selected to get the same total number of 96 subjects.
Covariates
In 450 K-Mono, as in the original publication [Citation36], we included age, a combination factor (race, sex, and study site) and, to control for residual sample contamination in the purified monocytes, separate enrichment scores computed for B cells, T cells, natural killer (NK) cells and neutrophils. In 450 K-WB, we used age, sex, ancestry information (PC1-3) and whole blood cell proportions (CD4+ and CD8 + T cells, NK cells, B cells, monocytes) as covariates. In EPIC-WB, we used age, sex, ancestry information (PC1-3) and blood cell proportions (CD4+ and CD8 + T cells, NK cells, B cells, monocytes) as covariates. Continuous covariates were all standardized to z-scores in this study.
Data pre-processing and QC
Details of the processing of the 450 K-Mono methylation data and generation of covariates downloaded from the GEO website are described in [Citation36]. In short, data were normalized using the R package lumi. Individual probes with methylation levels 10% samples failing a 5% detection p-value threshold were dropped. We did not discard probes based on the presence of nearby SNPs. Besides, data were checked for mismatches in sex and ancestry, and outliers using multidimensional scaling plots. More information about the pre-processing and QC of 450 K-Mono methylation data could be found elsewhere in [Citation36]. The separate enrichment scores for each blood cell type (B cells, T cells, NK cells, neutrophils) were generated by GSEA.
In the 450 K-WB, and EPIC-WB cohorts, the R packages CpGassoc and ChAMP were then used for data cleaning. Individual probes were set to missing if they did not satisfy a detection p-value threshold of 0.001. Data with missingness was filtered on CpG sites (>10%) and subjects (>5%). No probes were filtered for low signal intensity. Cross hybridizing probes between autosomes and sex chromosomes were excluded [Citation42]. We did not discard probes based on the presence of nearby SNPs. Normalization was implemented using the beta mixture quantile dilation method (BMIQ) [Citation43] in the R package watermelon, and the batch correction was performed using an empirical Bayes batch-correction method (ComBat) [Citation44]. The proportions of white blood cell counts were estimated from the methylation data, including CD4+ and CD8 + T cells, NK cells, B cells and monocytes using the R package minfi [Citation26,Citation27].
Computational burden
To get an estimate of the relative computational burden, we performed each DMR method once on 450 K-Mono and EPIC-WB data. The same 96 subjects in the analyses and a simulated continuous phenotype from the standard normal distribution were used. Both the cumulative running time of the main functions called by the method and its allocation of peak memory occurred were collected. The estimates were computed using the shared compute nodes at the Boston University Shared Computing Cluster (SCC). The SCC is a Linux cluster suitable for high-performance computing. To have comparable computational estimates, analyses used the same sandybridge CPU architecture and the same Intel Xeon E5-2670 processor, an 8-core processor with a base frequency of 2.60 GHz and with a max Turbo frequency of 3.30 GHz.
Simulations studies
To compare how FPRs would be affected by phenotype distributions, we simulated four different types of phenotypes independently of DNA methylation data 1,000 times for 450 K-Mono, EPIC-WB and 450 K-WB, respectively. We generated 1) a continuous phenotype from the standard normal distribution (normal phenotype), 2) a skewed continuous phenotype from the Chi-squared distribution with one degree of freedom (skewed continuous phenotype), 3) a dichotomous phenotype with 50% cases, and 4) a dichotomous phenotype with 25% cases as a comparison to allow for unequal cases and controls. For 450 K-Mono and EPIC-WB, our simulated dichotomous phenotypes were chip-balanced, i.e., each chip contains half cases and half controls, or 25% cases and 75% controls. To investigate the performance of the methods in the unbalanced assignment of cases and controls on chips, for the dichotomous on 450 K-WB, case and control status was assigned for the whole cohort of 96 subjects without respect to chips. Due to the extremely high computational burden in Bumphunter, we only simulated 100 times for the standard normal continuous and dichotomous 50% balanced phenotype on 450 K-Mono and EPIC-WB and replicated BumphunterNS on the same settings to get comparable estimates.
Genome-wide false positive (GFP) rate
The performance of each method was evaluated in terms of the genome-wide false positive rate (GFP), computed as:
The adjusted p-values which accounted for multiple testing as reported for each method were used to represent genome-wide significance. The cut-off of 0.05 was chosen as the significance threshold. Therefore, methods yielding genome-wide significant DMRs approximately 5% of the time have appropriate FP control. Exact binomial confidence intervals were computed using the binom.test() function in R.
Regional false positive (RFP) rate
We next explored whether some regions had patterns of RFP rates that depended on the genomic characteristics of the region or pattern of CpGs assessed by the chip (e.g., number of CpGs assessed, size of the region), which could vary by method. We evaluated these relationships for all the methods and whether or not their GFP rates were well controlled at or near the 5% level. This is important, as, even for methods with an overall well-controlled false positive rate, there may be certain types of regions that are more prone to false positives, or for which significance is often never observed, which may indicate a lack of power. Conversely, even in methods for which the false positive rate is not well controlled, with a GFP well above 0.05, there may be certain types of regions that are more prone to false positives and others which are less prone to false positives. Previously reported DMRs in regions with characteristics that, for a particular method, are found to produce false positives at a high rate may warrant further scrutiny. To investigate each method’s performance across genomic regions, we examined the relationship between the characteristics of each region and a regional false positive (RFP) rate calculated based on the nominal significance (uncorrected p < 0.05). As DMRcate only reports genome-wide significant regions and output very few regions from the null simulations, it was not considered for this evaluation. Besides, we did not present BumphunterNS in the regional analyses since using smoothed estimates were suggested by Bumphunter developers.
For each region, the RFP rate can be computed as
The supervised methods do not use pre-defined regions, and simulations usually output regions with varying starting and ending positions. Therefore, to correlate the performance of methods to particular genomic characteristics, we aggregated the results for fixed regions of the genome, and then annotated the number of times the results of the supervised method intersected with one of these fixed genomic regions. Each autosome is manually divided into 500 bp segments, and the RFP and regional characteristics were calculated for each of these ‘fixed’ regions. This allows us to compare regional statistics across different supervised methods. Each fixed region is classified as a false positive only once per simulation regardless of how many output DMRs it overlaps with. For fixed regions, we applied the same rule of retaining regions with at least two probes.
Regional characteristics
We assessed the relationship between RFP rates and five regional statistics summarizing the characteristics of a region and the probes in it: 1) average absolute pairwise correlation between all probes in the region (AAC), 2) number of probes, 3) median distance to the closet flanking probes (MDF), which is a measure of probe density, 4) region size in bp, and 5) average variance of beta-values for all probes in the region, a measure of regional variability. Beta-value is a numeric measure of methylation level, ranging from 0 to 1 [Citation45].
A univariate generalized linear model with a logit function was then applied to measure the association between RFP rates as the outcome on the bounded continuous scale between 0 and 1 and each of the five regional statistics [Citation46]. Heatmaps were used to present the relationship between regional statistics and RFP for each method. The comb-p method output a limited number of regions compared to others, but its heatmap was still included for completeness. To further assist in visualizing the relationship between regional statistics and FPRs, loess curves were added to the heatmap.
Results
Computational burden
presents the relative computational burden for each of the methods. For one genome-wide run on 450 K-Mono and EPIC-WB data, respectively, Bumphunter required 111.02 GB and 129.76 GB for the peak memory and 16.79 hours and 26.01 hours to finish, while BumphunterNS only needed 37.86 and 52.01 GB and 1.08 and 3.17 hours as a contrast. The method comb-p only needed less than 6 GB and less than 3 minutes on both. Other methods all used a moderate amount of peak memory ranging from 24.96 to 28.07 GB on 450 K-Mono and 16.79 to 19.94 GB on EPIC-WB.
Table 3. Summary of Relative Computation Burden.
Genome-wide false positive rate
Our null simulations showed a wide disparity between DMR methods in terms of GFP rates. On the 450 K-Mono array, for the normal phenotype, coMethDMR and DMRcate had the best performance with all well-controlled GFPs (<0.05) (). The GFP rates were 0.045 and 0.041 for coMethDMR on its pre-defined genic and intergenic regions, respectively, and 0.041 for DMRcate. The performance of comb-p, mCSEA (CGI, genes, promoters) and Bumphunter all had GFP rates well exceeding 0.05. Among those, Bumphunter surprisingly identified DMRs with genome-wide significance in almost every simulation, resulting in a high GFP rate of 0.88 (95% CI: 0.80–0.94). Without using smoothed estimates, the GFP rate of BumphunterNS was still high at 0.81 (95% CI: 0.72–0.88). When using the skewed continuous phenotype, all methods except mCSEA had increased GPF rates compared to using the normal phenotype (). coMethDMR and DMRcate did not provide controlled GFP rates for the skewed continuous phenotype. The GFP rate in coMethDMR increased to 0.24 (95% CI: 0.21–0.27) compared to 0.045 (95% CI: 0.033–0.060) on the genic, and 0.14 (95% CI: 0.12–0.17) compared to 0.041 (95% CI: 0.030–0.055) on the intergenic. The GFP rate in DMRcate increased to 0.53 (95% CI: 0.50–0.56) from 0.041 (95% CI: 0.030–0.055). The performance of comb-p was also poor, offering a GFP rate of 0.69 (95% CI: 0.66–0.72) compared to 0.49 (95% CI: 0.45–0.52) in the normal phenotype. The GFP rates in mCSEA were almost identical using the normal or the skewed continuous phenotype.
Figure 1. The Genome-wide False Positive Rates on 450 K-Mono: a. Normal Phenotype, b. Dichotomous Phenotype with 50% Cases, C. Skewed Continuous Phenotype.
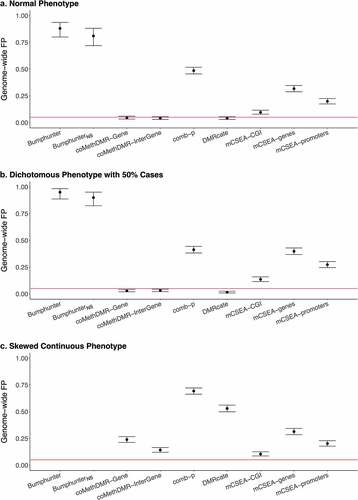
For the dichotomous phenotype with 50% cases, coMethDMR and DMRcate performed best with similar GFP rates compared to those reported for the normal phenotype (). The GFP rates were 0.029 and 0.031 for coMethDMR in genic and intergenic regions and 0.015 for DMRcate (Supplementary Table 1A). Both comb-p and mCSEA (CGI, genes, promoters) had GFP rates all above 0.1. The GFP rates could be as high as 0.41 for comb-p and 0.40 for mCSEA using genes as the pre-defined regions. The GFP rates in mCSEA using promoters and CGI were slightly better compared to that using genes but still not well controlled (0.27 for promoters and 0.14 for CGI). Bumphunter again provided the highest GFP rate of 0.95 (95% CI: 0.89–0.98) and BumphunterNS had the second highest GFP rate of 0.90 (95% CI: 0.82–0.95).
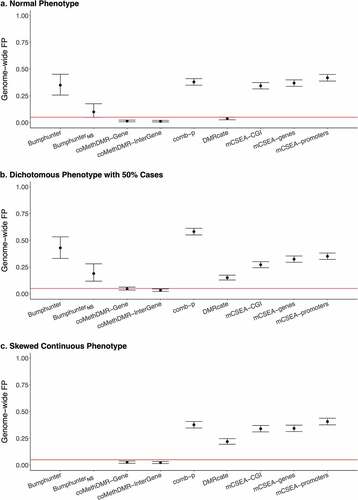
On the EPIC-WB array, coMethDMR consistently exhibited well-controlled GFP rates across all three phenotypes (). DMRcate only provided controlled GFP rate of 0.037 (95% CI: 0.026–0.051) in the normal phenotype, but not in the skewed continuous (0.22, 95% CI: 0.19–0.25) or the dichotomous (0.15, 95% CI: 0.13–0.17; Supplementary Table 1B). The comb-p method consistently generated high GFP rates, around 0.40 in the normal and the skewed continuous and 0.60 in the dichotomous phenotype simulations. Bumphunter was still highly inflated but output relatively lower GFP rates compared to that on 450 K-Mono. In Bumphunter, the GFP rates were 0.35 (95% CI: 0.26–0.45) for the normal phenotype simulations and 0.43 (95% CI: 0.33–0.53) for the dichotomous. For BumphunterNS, when not using a smoothed function, the GFP rates reduced but still slightly inflated at 0.10 (0.049–0.18) and 0.19 (0.12–0.28) for the normal and dichotomous phenotypes. The GFP rates in mCSEA varied from 0.27 to 0.42 across the three pre-defined region types.
Figure 2. The Genome-wide False Positive Rates on EPIC-WB: a. Normal Phenotype, b. Dichotomous Phenotype with 50% Cases, C. Skewed Continuous Phenotype.
On both 450 K-Mono and EPIC-WB, the results for the dichotomous with 25% cases were very similar to that for the dichotomous with 50% cases (Supplementary Figure 1A-B), except that DMRcate became more inflated on EPIC-WB. The number of regions being reported from each method with or without significance was also provided. (Supplementary Table 2).
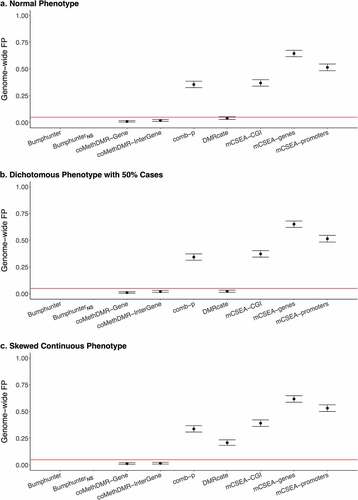
Additionally, methods were examined using the 450 K-WB data with whole-blood methylation ( and Supplementary Table 1C). Compared to 450 K-Mono where methylation was measured predominately on monocytes, across three phenotypes except the skew continuous, coMethDMR and DMRcate performed similarly, and comb-p slightly performed better but still with high GFP rates (0.34–0.36). For the skewed continuous, coMethDMR, comb-p and DMRcate all got lower GFP rates but only coMethDMR provided controlled GFP rates. Regardless of phenotype types, mCSEA had consistently high GFP rates varying between 0.37 and 0.65.
Figure 3. The Genome-wide False Positive Rates on 450 K-WB: a. Normal Phenotype, b. Dichotomous Phenotype with 50% Cases, C. Skewed Continuous Phenotype.
Regional characteristics and false positive rates
We compared the associations between RFP rates and five regional statistics (AAC, number of probes, average variance, region size and MDF) of each DMR method across different phenotypes and arrays (Supplementary Table 3).
In general, for coMethDMR, the AAC and average variance were significantly and positively associated with RFP rates on EPIC-WB and 450 K-WB, and the number of probes was significantly positively associated on EPIC-WB. However, none of the associations on 450 K-Mono was nominally significant except the positive association between RFP rates and AAC on the dichotomous with 25% cases (p-value = 0.043). AAC had the largest absolute standardized estimate among all available regional statistics, which was also true in mCSEA. We then visualized how RFP rates interacted with AAC for the normal phenotype on 450 K-Mono and EPIC-WB (). The normal phenotype was illustrated as the example here as the patterns for the dichotomous phenotype with 50% cases are very similar (Supplementary Figure 2). In , the RFP rates increased as AAC increased on both 450 K-Mono and EPIC-WB, but the trend tilted more on EPIC-WB. Most regions had AACs below 0.05 which were consistent with the low GFP rates in coMethDMR. On 450 K-Mono, the plot was radially distributed, and more regions were concentrated in the middle. The regions on EPIC-WB were heavily concentrated in the lower left, and more regions had smaller AACs. From Supplementary Figures 3A and 4A, we did not observe clear patterns against RFP rates for the other four regional statistics (number of probes, MDF, region size, and average variance).
Figure 4. Regional False Positive Rates vs Average Absolute Pairwise Correlations on 450 K-Mono and EPIC-WB for the Normal Phenotype with Overall Trend Indicated by a Loess Curve in Red: A. coMethDMR, B. mCSEA, C. Bumphunter, D. comb-p.
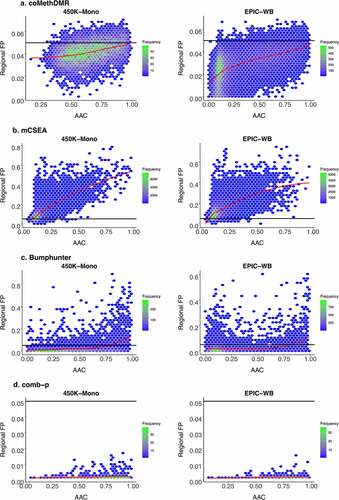
In mCSEA, its AAC, number of probes and average variance were significantly and positively associated with RFP rates, while MDF was negatively significant for all arrays. The regional size was positively significant for all four phenotypes on 450 K-WB only. In , the RFP rates in mCSEA increased along with AAC on the normal phenotype for both 450 K-Mono and EPIC-WB, and the patterns did not show much disparity between arrays. For both arrays, regions were more clustered with smaller AACs, and most regions had RFP rates above 0.05. Besides, some regions tended to always have nominal significance with RFP rates as high as 0.79 and 0.74 on 450 K-Mono and EPIC-WB for the normal phenotype, and 0.81 and 0.73 for the dichotomous phenotype with 50% cases.
In Bumphunter, we only evaluated the normal phenotype and dichotomous phenotype with 50% of cases on 450 K-Mono and EPIC-WB. The AAC and average variance were significant and positively associated with RFP rates on both arrays, and the number of probes was significantly positively associated on 450 K-Mono only. In , most regions had RFP rates above 0.05 which were consistent with their high GFP rates. For both arrays, regions tended to have smaller AACs and the pattern was more clearly observed on EPIC-WB than 450 K-Mono. Besides, the RFP rates increased as AACs increased on both arrays. Some regions had RFP rates as high as 0.68 and 0.60 on 450 K-Mono and EPIC-WB for the normal phenotype, and 0.69 on both arrays for the dichotomous with 50% cases. Also concerning, many of the regions never appeared as significant DMRs, with RFP = 0 for 59.91% and 51.28% regions for the normal and 58.04% and 50.70% for the dichotomous with 50% cases on 450 K-Mono and EPIC-WB. We did not observe distinct regional features distinguishing those regions with RFP = 0. The plot for comb-p should be used with caution as it was included mainly for completeness (). The numbers of original regions (not fixed regions) output by comb-p were much fewer compared to the other methods, and those original regions were all nominally significant for the normal and the dichotomous with 50% cases on both 450 K-Mono and EPIC-WB (Supplementary Table 2A and 2B). Among those reported regions in comb-p, they tended to be clustered towards bigger AACs. In comb-p, none of its associations were significant, and the increasing trends of RFP rates still existed but were flatter compared to other methods based on the limited number of regions reported for comb-p.
Discussion
This study evaluated the GFP control at the level of 0.05 for five array-based DMR methods: comb-p, Bumphunter, DMRcate, mCSEA and coMethDMR on Illumina 450 K and EPIC arrays. We also investigated how genomic patterns of RFP rates affected GFP rates by studying the associations between RFP rates and five regional statistics including correlation, number of probes, probe density, region size, and probe variability.
Our null simulations indicated good performance for coMethDMR and DMRcate in several situations. coMethDMR generally provided consistently well-controlled GFP rates (<0.05) across all predefined regions regardless of the varieties in all arrays and phenotypes, except the skewed continuous phenotype on 450 K-Mono. DMRcate performed well on 450 K-Mono except for the skewed continuous phenotype, but it only performed well on EPIC-WB for the normal phenotype. The only difference between 450 K-Mono and 450 K-WB was coMethDMR’s performance on the skewed continuous phenotype. The method coMethDMR provided controlled GFP rates for the skewed continuous simulation for 450 K-WB but not on 450 K-Mono. Based on these results, we recommend the use of coMethDMR given GFP rates as the criteria on both 450 K and EPIC data and, as an alternate method, DMRcate performed well on 450 K. Both methods worked well on normally distributed continuous phenotypes, although GFP rates were increased substantially in our analyses of skewed continuous distributions. We recommend that normal transformations of non-normal continuous phenotypes be used to control GFP rates in practice. Common normal transformation methods include square root, cubic root and logarithm transformations for positively skewed (or right-skewed) data, and square and cubit transformations for negatively skewed (or left-skewed) data. A rank-based inverse normal transform can also be applied to nonnormally distributed phenotypes, using the function RankNorm() which has been implemented in the R package RNOmni. For computational burden, DMRcate was superior in running time required, while it took hours for coMethDMR to finish. To reduce running time, one could parallelize jobs, increase the number of compute nodes or switch to using high-performance nodes as appropriate, though parallelizing jobs often comes with an increase of peak memory used. Both coMethDMR and DMRcate used a moderate amount of peak memory.
We could not recommend the other three analysis packages for usage in the scenarios evaluated in this paper. Of these three, mCSEA had the best performance, and the computational costs of mCSEA were reasonable. With the chip-balanced design on 450 K-Mono and EPIC-WB, mCSEA had reasonable performance, but rates were above 0.096 across generating conditions. We also noted some sensitivity to unbalanced chip design in mCSEA which was not apparent in the other analysis methods. We also observed some irregularities in the pre-defined regions used in mCSEA. Some probes within the same regions were somehow found on different chromosomes, based on the Illumina annotations. Resolving the issue of inaccurate pre-defined regions might help mCSEA control its GFP rates.
The other two supervised methods, Bumphunter and comb-p, did not yield satisfactory GFP rates. Bumphunter and BumphunterNS both had high GFP rates >0.1 across all simulation conditions and up to 0.95 in one generating condition. We also noted that Bumphunter required the biggest peak memory and most cumulative running time, which could be demanding, even for high-performance computing clusters, although disabling smoothing (BumphunterNS) greatly reduced computing requirements. Again, parallelizing Bumphunter runs across multiple cores could also be used to reduce runtime, although we did not evaluate this here, as we wanted to get an estimate of the overall computational burden that was comparable across methods. The GFP rates of comb-p were also more than the target 5% rate and greater than 0.34 across all chip and phenotype combinations investigated. Based on these results, we cannot recommend the use of these two methods for EWASs. These high FPR rates are inflated enough that they may warrant re-evaluation of previously published DMR results obtained using these two methods. In general, supervised methods tended to have worse performance in GFP rates for all four phenotypes and three arrays (, 2 1 1). It had previously been noted that was usually more challenging for supervised methods to maintain control of type I error, as the same data were used twice to both define the regions and their significance [Citation47].
We noted that while some methods were better or worse performing overall, not all regions were equally likely to produce a false positive. In general, across methods, there was a tendency for increased false positive rates as the correlation between probes (as measured by the AAC) increased (). The implications of this differed by the method. For the method with well-controlled false positive rates (coMethDMR), this might imply that method tended to be conservative in regions where most of the probes were independent, or near independent. However, for the methods with poorly controlled false positive rates (mCSEA, Bumphunter), this would indicate that a previously reported DMR in a high-correlation region should be viewed with additional scepticism. Another consequence of this observation was that, in general, false positive rates were lower for the EPIC chip than for the 450 K chip, as the EPIC chip has a lower correlation on average between adjacent probes as a function of the chip design [Citation8,Citation48]. However, as each method defines regions using different criteria, this impact was not observed uniformly across methods. For example, no clear difference was observed in comb-p, as the low-correlation regions were not represented in the output for either chip, and the average correlation across reported regions for the EPIC chip was elevated. Although we expected more regions with lower correlations from EPIC chips, the low-correlation regions in comb-p were not well represented in the output from either chip. This was evident when looking at the average correlations for the EPIC regions, which were higher than for other methods.
This study had several limitations. The performance of methods we examined could be impacted greatly by the parameter settings [Citation11], but we did not find published studies that include suggested parameter settings for genome-wide analyses. Optimizing parameter settings was beyond the scope of this study. Therefore, the default or recommended parameters settings were used for each method, or the settings from the authors’ illustrated examples were substituted if the previous information was not available. It is quite possible that a motivated researcher would be able to identify parameters for the methods that perform better than we have indicated here. However, our investigation should make clear that any such optimization should include a rigorous evaluation of false positive rates based on genome-wide simulations. R scripts for running genome-wide null simulations using each evaluated DMR method are available on GitHub (https://github.com/ggzheng/DMR_NullSimulations). The scripts include notes on the steps needed to clean and run simulations using the publicly available monocyte data examined here. It can be used with minor modifications to analyse other datasets or adapted to perform simulations using other DMR methods. Also, the performance was evaluated mainly based on GFP rates but not on power or other criteria. Though coMethDMR and DMRcate generally guaranteed controlled GFP rates, their ability to identify truly significant DMRs should be evaluated in the future. Another limitation of this study is that only three datasets were used in the simulations. The three data sets we used in this study had substantial heterogeneity in age ranges, proportions of women participants, different tissue types, and methylation array types. Within each tissue type, the genome-wide nature of the examination leads to an evaluation of many different types of regions in terms of the number of probes, the correlation between probes, probe spacing, etc. Variations between datasets may likely shift the proportion of regions with particular characteristics, for example, the shift from 450 K to EPIC probes increased the number of probes and decreased the correlation between adjacent probes on average. However, for methods that exhibited considerable inflation, such as Bumphunter and mCSEA, the inflation was not restricted simply to one particular type of region. That is, inflation was observed across a wide variety of regions, although it was true that a high correlation between probes tended to increase correlation somewhat. In addition, coMethDMR appeared quite robust in terms of GFP rate control across different simulating conditions and within regions with different types of characteristics under each condition. We would encourage users who are concerned about analyses of a particular type of data in DMR analyses, who are interested in evaluating a new DMR analysis method, or who are interested in exploring additional parameter options for the methods which we evaluated to modify the supplied simulation code to fit their particular needs and to perform a genome-wide null simulation.
Ethics Declarations
This study was done with appropriate oversight by VA Boston Healthcare System R&D Committee. The approval number is 1,578,157-4. The NCPTSD and TRACTS data were also obtained from an approved VA data repository with appropriate oversight by the committee.
Funder Information
This work was funded by I01BX003477, a VA BLR&D grant to MW Logue, R21MH102834 to MW Miller, 1R01MH108826 to AK Smith/MW Logue/Nievergelt/Uddin, and the Translational Research Center for TBI and Stress Disorders (TRACTS), a VA Rehabilitation Research and Development (RR&D) Traumatic Brain Injury Center of Excellence (B9254-C) at VA Boston Healthcare System. The views expressed in this article are those of the authors and do not necessarily reflect the position or policy of the Department of Veterans Affairs, the Department of Defense or the US Government.
Supplemental Material
Download MS Word (1.5 MB)Disclosure statement
No potential conflict of interest was reported by the author(s).
Data Availability Statement
The GEO data GSE56046 that support the findings of this study are openly available in the MESA Epigenomics and Transcriptomics Study at https://www.ncbi.nlm.nih.gov/geo/query/acc.cgi?acc=GSE56046.
Qualified investigators can apply to the PTSD Genetics (NCPTSD) and TRACTS data repositories to gain access to these data via a Data Use Agreement. Please contact Drs. Miller and McGlinchey regarding access to PTSD Genetics and TRACTS data repositories, respectively.
Supplementary material
Supplemental data for this article can be accessed online at https://doi.org/10.1080/15592294.2022.2115600
Additional information
Funding
References
- Phillips T. The role of methylation in gene expression. Nat Educ. 2008;1(1):116.
- Kulis M, Esteller M. DNA methylation and cancer. Adv Genet. 2010;70:27–56.
- Ehrlich M. DNA methylation in cancer: too much, but also too little. Oncogene. 2002;21(35):5400–5413.
- Grayson DR, Guidotti A. The dynamics of DNA methylation in schizophrenia and related psychiatric disorders. Neuropsychopharmacology. 2013;38(1):138–166.
- Logue MW, Miller MW, Wolf EJ, et al. An epigenome-wide association study of posttraumatic stress disorder in US veterans implicates several new DNA methylation loci. Clin Epigenetics. 2020;12(1):46.
- Katrinli S, Zheng Y, Gautam A, et al. PTSD is associated with increased DNA methylation across regions of HLA-DPB1 and SPATC1L. Brain Behav Immun. 2021;91:429–436.
- Moran S, Arribas C, Esteller M. Validation of a DNA methylation microarray for 850,000 CpG sites of the human genome enriched in enhancer sequences. Epigenomics. 2016;8(3):389–399.
- Pidsley R, Zotenko E, Peters TJ, et al. Critical evaluation of the illumina methylationEPIC BeadChip microarray for whole-genome DNA methylation profiling. Genome Biol. 2016;17(1):208.
- Affinito O, Palumbo D, Fierro A, et al. Nucleotide distance influences co-methylation between nearby CpG sites. Genomics. 2020;112(1):144–150.
- Gu H, Bock C, Mikkelsen TS, et al. Genome-scale DNA methylation mapping of clinical samples at single-nucleotide resolution. Nat Methods. 2010;7(2):133–136.
- Mallik S, Odom, Gj, Gao, Z et al, et al. An evaluation of supervised methods for identifying differentially methylated regions in Illumina methylation arrays. Brief Bioinform; 2018 https://doi.org/10.1093/bib/bby085.
- Jaffe AE, Murakami P, Lee H, et al. Bump hunting to identify differentially methylated regions in epigenetic epidemiology studies. Int J Epidemiol. 2012;41(1):200–209.
- Pedersen BS, Schwartz DA, Yang IV, et al. Comb-p: software for combining, analyzing, grouping and correcting spatially correlated P-values. Bioinformatics. 2012;28(22):2986–2988.
- Peters TJ, Buckley, MJ, Statham, AL et al, et al. De novo identification of differentially methylated regions in the human genome. Vol. 8. Epigenetics Chromatin; 2015. p. 6 https://doi.org/10.1186/1756-8935-8-6.
- Butcher LM, Beck S. Probe Lasso: a novel method to rope in differentially methylated regions with 450K DNA methylation data. Vol. 72. Methods; 2015. p. 21–28 https://doi.org/10.1016/j.ymeth.2014.10.036.
- Martorell-Marugan J, Gonzalez-Rumayor V, Carmona-Saez P. mCSEA: detecting subtle differentially methylated regions. Bioinformatics. 2019;35(18):3257–3262.
- Gomez L, Odom, GJ, Young, JI et al, et al. coMethDMR: accurate identification of co-methylated and differentially methylated regions in epigenome-wide association studies with continuous phenotypes 47 . Nucleic Acids Res; 2019 e98 https://doi.org/10.1093/nar/gkz590 .
- Lent S, Xu H, Wang L, et al. Comparison of novel and existing methods for detecting differentially methylated regions. BMC Genet. 2018;19(Suppl 1):84.
- Chen DP, Lin YC, Fann CS. Methods for identifying differentially methylated regions for sequence- and array-based data. Brief Funct Genomics. 2016;15(6):485–490.
- Hsiao CL, Hsieh, AR, Lian, IB et al, et al. A novel method for identification and quantification of consistently differentially methylated regions. PLoS One. 2014;9(5):e97513.
- Zhang Y, Liu H, Lv J, et al. QDMR: a quantitative method for identification of differentially methylated regions by entropy. Nucleic Acids Res. 2011;39(9):e58.
- Leek JT, Storey JD. Capturing heterogeneity in gene expression studies by surrogate variable analysis. PLoS Genet. 2007;3(9):1724–1735.
- Cleveland WS. Robust locally weighted regression and smoothing scatterplots. J Am Stat Assoc. 1979;74(368):829–836.
- Shaffer JP. Multiple Hypothesis-Testing. Annu Rev Psychol. 1995;46:561–584.
- Efron B, Tibshirani R. An introduction to the bootstrap. Monographs on statistics and applied probability. Vol. xvi. New York: Chapman & Hall; 1993. p. 436.
- Aryee MJ, Jaffe AE, Corrada-Bravo H, et al. Minfi: a flexible and comprehensive bioconductor package for the analysis of infinium DNA methylation microarrays. Bioinformatics. 2014;30(10):1363–1369.
- Fortin JP, Triche TJ, Hansen KD. Preprocessing, normalization and integration of the illumina humanMethylationEPIC array with minfi. Bioinformatics. 2017;33(4):558–560.
- Kechris KJ, Biehs B, Kornberg TB. Generalizing moving averages for tiling arrays using combined p-value statistics. Stat Appl Genet Mol Biol. 2010;9:Article29.
- Stouffer SA, Suchman, EA, DeVinney, LC et al. The American soldier Osborn, Frederick. In: Studies in social psychology in World War II 1 . Princeton: Princeton University Press; 1949 45 .
- Liptak T. On the combination of independent tests. Magyar Tudomanyos. Akademia Matematikai Kutato Intezetenek Kozlemenyei. 1958;3:171–197.
- Šidák Z. Rectangular confidence region for the means of multivariate normal distributions. J Am Stat Assoc. 1967;62(318):626–633.
- Satterthwaite FE. An approximate distribution of estimates of variance components. Biometrics. 1946;2(6):110–114.
- Benjamini Y, Drai D, Elmer G, et al. Controlling the false discovery rate in behavior genetics research. Behav Brain Res. 2001;125(1–2):279–284.
- Subramanian A, Tamayo P, Mootha VK, et al. Gene set enrichment analysis: a knowledge-based approach for interpreting genome-wide expression profiles. Proc Natl Acad Sci U S A. 2005;102(43):15545–15550.
- Hollander M, Wolfe DA. Nonparametric statistical methods. In: Wiley series in probability and statistics Texts and references section. 2nd ed. Vol. xiv. New York: Wiley;1999. p. 787.
- Reynolds LM, Taylor, JR, Ding, J et al, et al. Age-related variations in the methylome associated with gene expression in human monocytes and T cells. Vol. 5. Nat Commun; 2014. p. 5366 https://doi.org/10.1038/ncomms6366.
- Leek JT, Scharpf RB, Bravo HC, et al. Tackling the widespread and critical impact of batch effects in high-throughput data. Nat Rev Genet. 2010;11(10):733–739.
- Sadeh N, Wolf EJ, Logue MW, et al. Epigenetic variation at SKA2 predicts suicide phenotypes and internalizing psychopathology. Depression and Anxiety. 2016;33(4):308–315.
- Ratanatharathorn A, Boks MP, Maihofer AX, et al. Epigenome-wide association of PTSD from heterogeneous cohorts with a common multi-site analysis pipeline. Am J Med Genet B Neuropsychiatr Genet. 2017;174(6):619–630.
- Logue MW, Smith AK, Wolf EJ, et al. The correlation of methylation levels measured using Illumina 450K and EPIC BeadChips in blood samples. Epigenomics. 2017;9(11):1363–1371.
- Sadeh N, Spielberg JM, Logue MW, et al. SKA2 methylation is associated with decreased prefrontal cortical thickness and greater PTSD severity among trauma-exposed veterans. Mol Psychiatry. 2016;21(3):357–363.
- Chen YA, Lemire M, Choufani S, et al. Discovery of cross-reactive probes and polymorphic CpGs in the illumina infinium humanMethylation450 microarray. Epigenetics. 2013;8(2):203–209.
- Teschendorff AE, Marabita F, Lechner M, et al. A beta-mixture quantile normalization method for correcting probe design bias in Illumina Infinium 450 k DNA methylation data. Bioinformatics. 2013;29(2):189–196.
- Johnson WE, Li C, Rabinovic A. Adjusting batch effects in microarray expression data using empirical Bayes methods. Biostatistics. 2007;8(1):118–127.
- Du P, Zhang, X, Huang, CC et al, et al. Comparison of Beta-value and M-value methods for quantifying methylation levels by microarray analysis. Vol. 11. BMC Bioinformatics; 2010. p. 587 https://doi.org/10.1186/1471-2105-11-587.
- Johnson NL. Systems of frequency curves generated by methods of translation. Biometrika. 1949;36(Pt. 1–2):149–176.
- Lun AT, Smyth GK. De novo detection of differentially bound regions for ChIP-seq data using peaks and windows: controlling error rates correctly. Nucleic Acids Res. 2014;42(11):e95.
- Zhou Z, Lunetta KL, Smith AK, et al. Correction for multiple testing in candidate-gene methylation studies. Epigenomics. 2019;11(9):1089–1105.