
ABSTRACT
Epigenetic machinery contributes to gene regulation in eukaryotic species. However, the machinery including more than 600 epigenetic regulator (ER) genes responsible for reading, writing, and erasing histone modifications and DNA modifications remains largely uncharacterized across species. We compile a comprehensive list of ERs based on an evolutionary analysis across 23 species, which is the most comprehensive ER list in various species until recently. We further perform comparative transcriptomic analyses across different tissues in humans, mice, as well as other amniote species. We observe a consistent tissue-of-origin expression specificity pattern of duplicated ER genes across species and suggest links between expression specificity and ER gene evolution as well as ER function. Additional analyses further suggest that ER duplication can generate tissue-specific ER genes with the same epigenetic substrates, which may be closely related to their regulatory specificity in tissue development. Our work can serve as a foundation to better comprehend the tissue-specific expression patterns of ER genes from an evolutionary perspective and also the functional implications of ERs in tissue-specific epigenetic regulation.
Introduction
Epigenetics, a study of heritable traits that are not encoded in DNA sequences, has become as the key to dissect the regulatory mechanism behind cell phenotype. Researchers have found hundreds of Epigenetic regulators (ERs) that can read, write, erase specific cytosine or histone residues and remodellers in a cell context-dependent fashion [Citation1]. Chromatin regulators, the major component of ERs, include many well-studied proteins/enzymes, which can be generally categorized as DNA methylators (methyltransferases), histone modifiers (methyltransferases/demethylases, histone acetyltransferases/deacetylases) and chromatin remodellers [Citation1]. For example, histone acetyltransferases and deacetylases can add and remove acetyl-groups to/from lysine on histone N-terminal tails [Citation2]. The ER genes may involve in the proper regulation of the downstream gene expression, which is necessary for the maintenance of cell development and tissue function [Citation3]. The regulatory roles of specific ERs in tissue, cell development, and cancer progression were reported before in specific tissues or diseases [Citation4–7]. However, a comprehensive collection and comparative expression characterization of ER genes across species is still lacking.
Several databases hosting epigenetic regulators or chromatin regulators are already available, for instance, EpiFactors [Citation8], dbEM [Citation9] and CR2Cancer [Citation10] databases contain a comprehensive ER gene list in human cancer and associated omics annotations. In addition, Xu et al. collected hundreds of histone acetylation and methylation regulators across eight species from literature and built a database WERAM [Citation11]. However, no comprehensive database including all kinds of epigenetic regulators (DNA/histone mark readers/writers/erasers/remodellers) across representative species in Eukaryota exists until recently.
Previously, the expression of ERs was mainly characterized in cancer and neurological diseases. For example, Boukas et al. characterized 295 ER genes based on loss-of-function variation data and found that the ER genes were generally intolerant to loss-of-function variation [Citation12]. Many ER genes in their study were co-expressed within multiple tissues in The Genotype-Tissue Expression (GTEx) project. Hu et al. characterized the genomic alterations of 73 histone acetylation regulatory genes based on the Cancer Genome Atlas (TCGA) gene expression and copy number alteration data [Citation13]. The limitation of Hu et al.’s study is that they only focused on histone acetylation regulators. Instead, Lu et al. performed an integrative investigation of comprehensive human ER genes based on somatic mutations, gene expression, miRNA regulation in cancer, as well as epigenetic modifications and protein–protein interaction (PPI) network data, and characterized cancer-specific ER genes and non-cancer-specific ER genes using functional data [Citation14]. They also found that specific ER genes were associated with cancer subtypes. Altogether, a comprehensive compilation as well as systematic expression and evolutionary analyses of ERs in normal tissues and major species is still necessary.
In this study, we compiled a comprehensive list of ERs and identified the evolutionary history of human ER genes based on 23 species from major phylogenetic clades. Our functional genomic analyses revealed that the identified duplicated gene and ancestor gene pairs kept similar expression and function. We also analysed the gene expression patterns of the compiled ER genes in human and mouse as well as in ten amniote species and demonstrated that the ER genes exhibited a clear tissue-specific gene expression pattern. Our analyses also suggest that ER duplication events can generate tissue-specific ER genes with same epigenetic substrates, but may be associated with distinct regulatory function. Taken together, our work reported an overall more correlated expression pattern than would be expected as well as an unanticipated consistent tissue-of-origin expression specificity for specific ER genes across species and tissues, which may serve as a foundation for understanding the link between gene evolution and epigenetic regulation in the future.
Materials and methods
Data sets
In this paper, the data of human mRNA expression levels as measured by TPM (transcripts per kilobase million) were retrieved from the resources as follows: (1) the mRNA expression datasets from the GTEx project [Citation15] for the human tissues; (2) the mRNA expression datasets from the ENCODE project for the mouse tissues [Citation16]; (3) the mRNA expression levels from ten species in amniotes from the study of Brawand et al. [Citation17].
Compilation of human Epigenetic regulators (ERs)
The list of human ER genes together with ER type annotations was obtained from a previous study [Citation14]. We kept ERs with known ‘histone_type’ or ‘Methylator_type,’ resulting in 690 human ERs. The ER gene list and the functional annotations (e.g., histone mark reader) were available in Supplementary Table S1. The analyses done in this paper were restricted to the human ERs and the orthologs in other species. For convenience, gene names in other species were mapped to human gene names.
Duplication event identification
We chose 25 representative species including 23 Eukaryal species, and two evolutionary outgroups (bacteria and archaea) to perform phylogenetic analyses. The species were chosen to make sure at least one species was selected in major phylogenetic clades. We downloaded the complete proteome FASTA files for the 25 species from the UniProt website [Citation18]. We also retrieved hidden Markov model (HMM) profiles of the 45 representative epigenetic domains from the pFAM database [Citation19], the selection of the representative epigenetic domains was based on a previous paper [Citation12]. Each HMM profile was then used to search the proteomes from different species by hmmsearch function (parameters: – notextw – noali – seed 1) from HMMER software v3.3.2. Proteins that were above default threshold were collected as putative ERs. Finally, we compiled a table of ER ortholog proteins (Supplementary Table S2), which included additional ortholog protein annotations that were missed by our compilation but can be rescued by UniProt annotation. OrthoFinder [Citation20] was used to predict duplication events for each species and epigenetic domain (parameters: -M msa -A mafft -f). Phylogenetic trees were visualized by FigTree software v1.4.4.
Tissue expression specificity analysis
Tissue expression specificity analysis was done by calculating TPM values based on the human mRNA expression datasets from the GTEx and ENCODE projects. We discarded three tissues (whole blood, transformed lymphocytes, as well as transformed fibroblasts) in the GTEx data, because biases may be introduced from the extreme values in the three tissues [Citation21]. We then processed the TPM profiles for the mRNA expression profiles based on log transformation (with a pseudocount to avoid zero). A Tissue specificity (TS) score was defined by the residuals calculated by rlm function in R, which was proposed by a previous study [Citation21]. An ER was considered as tissue-specific if its TS score in a given tissue was > 2.5-fold of standard deviation of residuals in all tissues.
ER tissue expression analysis in amniotes
We carried out an ER expression analysis on ten species in amniotes including human (Homo Sapiens), chimpanzee (Pan Troglodytes), bonobo (Pan paniscus), gorilla (Gorilla gorilla), orangutan (Pongo pygmaeus), rhesus macaque (Macaca mulatta), mouse (Mus Musculus), Grey short-tailed opossum (Monodelphis domestica), platypus (Ornithorhynchus anatinus), and chicken (Gallus gallus) based on the public mRNA-Seq data in GEO database with ID GSE30352 [Citation17]. We analysed mRNA normalized Reads Per Kilobase of transcript, per Million mapped reads (RPKM) expression levels for amniote ortholog genes. Then, the tissue-wide mRNA expression levels were subject to log transformation (with a pseudocount to avoid zero), followed by Z-scale processing row-wisely.
Gene set analyses
ReactomePA pathway overrepresentation analysis was done by using ReactomePA R package v1.38.0 [Citation22]. Pathway enrichment analysis was performed by Enrichr [Citation23] for tissue-specific genes for the different amniote species. The gene lists and data that were used to evaluate the enrichment in the duplicated genes were as follows: (1) The cancer driver gene list including 1,172 genes that was predicted from the DORGE paper [Citation24]. (2) The Housekeeping gene (HKG) list including 3,804 HKGs that was downloaded from https://www.tau.ac.il/~elieis/HKG/. (3) The essential gene list and duplicated gene list that were also retrieved from the OGEE database [Citation25]. To make our analysis more reliable, we only kept 2,340 essential genes with >2 in entries from the essential gene list. Gene Ontology semantic similarity analysis was performed by using the GOSemSim R package v2.20.0 [Citation26].
Statistical analyses
PCA analyses were done based on prcomp function of R 4.2.0, and figures were generated by using the first two principal components. Outlier genes in PCA plots were detected based on Mahalanobis distances (calculated by mt R package v2.0–1.19) of principal component 1 (PC1) and principal component (PC2). Genes with the largest 10% Mahalanobis distances were defined as outliers (calculated by quantile function in R). Gene enrichment analyses were performed by one-sided Fisher’s exact test (fisher.test function in R). Two-sided Wilcoxon rank-sum test was used when comparing values of pair-wise gene sets in Box plots. Pearson correlation coefficient was used for testing correlation between paired samples (cor function in R).
Code availability
The open-source codes are freely available upon reasonable request. Codes to generate figures were tested based on R computing system version 4.2.0. R package versions used in this study were specified in the ‘Materials and methods’ section.
Results
Comprehensive compilation and evolutionary analyses of Epigenetic regulator genes
Epigenetic regulators (ERs) play an important role in animal development for eukaryotic species, especially amniotes. However, to what extent ERs regulated eukaryotic cell function and how ERs evolved have not been systematically investigated previously. To this end, we performed a de novo analysis of the evolutionary history of the ERs in 25 species including 23 representative eukaryal species, and two evolutionary outgroups (bacteria and archaea) as controls (Supplementary Table S2, see also ‘Materials and methods’ section). Because of the large number of epigenetic domains, we only selected 45 representative epigenetic domains from pFAM database [Citation19] in our evolutionary analyses. These domains were compiled as epigenetic domains based on previous literature [Citation12]. Orthologs were identified based on Hidden Markov Model (HMM)-based searches of these epigenetic domains against the proteomes of the 25 species (see ‘Materials and methods’). As expected, the putative ER gene number was proportional to the size of genomes (Supplementary Table S3). For example, we obtained six putative ER proteins in Natronomonas moolapensis and > 2,000 putative ER proteins in Homo sapiens, respectively. The ER protein number ratio between Homo sapiens and Natronomonas moolapensis is ~ 375, suggesting a robust identification for our phylogenetic analysis.
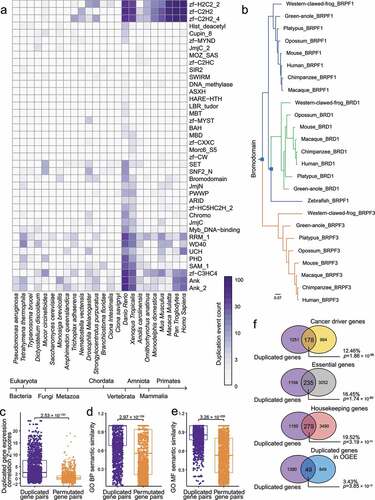
Gene duplication is an important mechanism for a specific organism to acquire an ability to adapt to the environment, further, it may also be associated with human diseases [Citation27]. Here, 2,482 duplication events were predicted by OrthoFinder [Citation20] for all the species and investigated domains (Supplementary Table S4). We summarized the duplication events for a few representative domains (), from which we found the duplication events were most abundant in Danio Rerio (also known as Zebrafish) that is a representative species in Vertebrata, suggesting many epigenetic domains (e.g., zinc finger, WD40 repeat) may be specifically necessary in the evolution and developmental regulation of Vertebrates. For instance, we observed Bromodomain-containing protein 1 (BRD1), also known as BRPF2, was duplicated from BRPF1 in Zebrafish (). Recent studies have found that different histone modification marks were selectively preferred by BRD1, BRPF1, and BRPF3 bromodomain with varying binding affinities [Citation28–30], suggesting the evolution of bromodomain sequences may have functional relevance.
Figure 1. Evolutionary analysis of Epigenetic regulators (ERs). (a) Heatmap of numbers of ER gene duplication events occurred in representative domains and species. Duplication events were inferred by OrthoFinder. (b) A phylogenetic tree of BRPF1/3 and BRD1. Blue squares represent the nodes with duplication occurrence. (c) Duplicated gene expression correlation Z-scores for duplicated gene pairs and permutated gene pairs based on the human coexpression data. (d) Gene Ontology (GO) Biological Processes (BP) semantic similarity for duplicated gene pairs and permutated gene pairs. (e) GO Molecular Function (MF) semantic similarity for duplicated gene pairs and permutated gene pairs. (f) Venn plots of the identified duplicated ER genes and functional gene sets. The percentages above the p-values are defined as the ratio of the overlapping gene number to the gene number in our duplicated gene list. P-values were calculated by Fisher’s exact test.
Functional genomic analyses of the duplicated Epigenetic regulator genes
Then, we evaluated if the duplicated ER gene pairs, i.e., ancestors and duplicated genes, were correlated in gene expression or function. Because GTEx data contained few tissues, we used a gene coexpression dataset downloaded from COXPRESdb (https://coxpresdb.jp/download/Hsa-r.c5-0/coex), where gene coexpression correlation Z-scores were calculated based on more than 10,000 samples. Data of duplicated gene pairs were extracted from the whole dataset. Indeed, we found that duplicated ER gene pairs were more correlated in gene expression than randomly permutated gene pairs based on the human expression data (, Wilcoxon rank-sum test, p-value = 2.53 × 10−131). Our permutation analysis maintained the order of ancestor genes but shuffled the order of the duplicated genes and compared the gene expression correlation followed by Z-transformation, which was a rigorous negative control for exploring genuine relationships between ancestor and descendant gene pairs. Permutation in was also done in a similar way. Furthermore, we also found that the duplicated ER gene pairs were more correlated based on GO Biological Process (BP) semantic similarity metrics [Citation26] than permutated gene pairs (, Wilcoxon rank-sum test, p-value = 2.97 × 10−124) as well as GO Molecular Function (MF) semantic similarity metrics than permutated gene pairs (, Wilcoxon rank-sum test, p-value = 3.26 × 10−255). Considering the duplicated gene pairs may contain genes with ubiquitous epigenetic domains (e.g., Chromo, PHD, zinc finger), the results in may be underestimated due to the rigorous permutation.
We then performed enrichment analyses on functional gene sets to explore the features of the duplicated ER genes that we identified in this work (). We found that 178 duplicated ER genes were also cancer driver genes that were predicted by DORGE [Citation24] (Fisher’s exact test, p-value = 1.86 × 10−98). In addition, 235 duplicated ERs were also essential genes that were compiled by the OGEE database [Citation25] (Fisher’s exact test, p-value = 1.74 × 10−60) and 279 duplicated ER genes were also in a previously compiled Housekeeping gene (HKG) list (Fisher’s exact test, p-value = 3.19 × 10−74). Interestingly, 49 duplicated ERs were overlapped with the compiled duplicated genes from OGEE database [Citation25] (Fisher’s exact test, p-value = 3.85 × 10⁻¹²), suggesting that we may present quite more candidate ER genes across species in our ER list than OGEE. Altogether, we showed the landscape of the duplication events of ERs and their possible functional implications. Specifically, duplicated ER genes were associated with gene essentiality and many of them were HKGs, which implied that a proportion of the investigated ER genes were actually functionally critical genes across species. In addition, the duplicated ER genes were also likely to be candidate cancer driver genes, which was consistent with the notion that cancer driver genes can be detected based on somatic mutation rate that can be modelled by the metrics that had been widely used in evolutionary studies [Citation31,Citation32]. Considering the functional genomic gene sets we used may not be comprehensive, the enrichment results of the duplicated ER genes may be underestimated.
Conserved tissue-of-origin expression patterns for ER genes between human and mouse
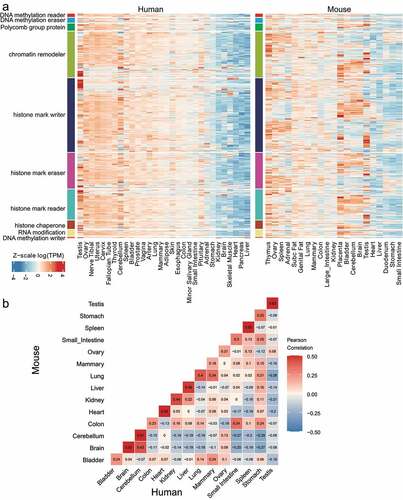
Given the potential functional implications of the identified duplicated ER genes, we then examined the expression patterns of the duplicated ER genes in different tissues and species. To this end, we interrogated the ER gene expression in tissues of human and mouse based on publicly available mRNA-Seq data (). The human genes analysed here (Supplementary Table S1) were the compiled ER genes that were evolved from duplicated events or ancestors. The mouse genes were mapped to human genes by gene symbols. Interestingly, ERs behave a largely consistent tissue-of-origin expression pattern between human and mouse (). The pattern was similar in different functional categories of ERs (). We found genes in the organs in reproductive system including testis, ovary, cervix, placenta, as well as the nervous system related tissues (brain and cerebellum) were highly expressed compared with that in other tissues/organs (). However, tissues like liver or heart were associated with few highly expressed genes. Expression levels of same tissue origin tended to be correlated (). However, the expression levels of genes in a specific tissue in human may also be correlated with a different tissue-of-origin tissue in mouse compared with other tissues, for example, colon in mouse and small intestine in human (). The correlation of colon in mouse and small intestine in human was even greater than that of colon in mouse and human ().
Figure 2. Consistent tissue-of-origin expression patterns of duplicated epigenetic regulator (ER) genes in human and mouse. (a) Heatmap of log(TPM) expression levels of ERs in human and mouse tissues. Testis is distinct from other tissues where many genes show highly specific expression, whereas other tissues like Heart show very little variance of ER expression. (b) Gene expression correlation analysis of the GTEx data from human and the ENCODE data from mouse. Gene expression correlation was determined by Pearson correlation based on residuals calculated by rlm function in R.
For each human or mouse gene, we calculated the tissue specificity (TS) score to measure the heterogeneity of gene expression. TS scores were previously used to measure the difference of gene expression in a specific sample with the expression in all samples (see ‘Materials and methods’). We found testis of human () and mouse () was a unique tissue based on calculated TS scores. Expectedly, we found many differentially expressed ERs in testis were well-studied testis-specific genes (e.g., TNP1, TNP2). By contrast, we found many tissues such as Heart had few differentially expressed ERs ().
Figure 3. Analysis of tissue-specific expression for duplicated epigenetic regulator (ER) genes in human and mouse. (a) Scatter plots showing the mRNA mean abundance in testis and Heart versus all tissues for ERs genes in human. (b) Scatter plots showing the mRNA mean abundance in testis and heart versus all tissues for ERs genes in mouse. From (a)-(b), testis has more tissue-specific genes than Heart in human and mouse. Tissue-specific genes in subplots are highlighted in red. (c) Principal Component Analysis (PCA) of ER gene expression in human tissues. Gene symbols of chromatin remodeller and DNA methylation eraser outliers are shown. (d) Bar plots of the percentages of the human (c) and mouse (e) outlier ER genes of each ER type in all outlier ER genes (in PCA plots). As a comparison, the bar plots of the percentages of the ER genes of different ER types in all ER genes are also shown. Gene numbers are shown above the bars. P-values were calculated by Fisher’s exact test. (e) PCA of ER gene expression in mouse tissues. Gene symbols of chromatin remodeller and DNA methylation eraser outliers are shown. (f) PCA loading plot of human tissues based on PCA analysis in (c). (g) PCA loading plot of mouse tissues based on PCA analysis in (e). For PCA plots, only the first two principal components (PC1 and PC2) are shown. The PCA loading plots in (f) and (g) indicate the contribution of human or mouse tissues on the first two principal components (PC1 and PC2). The percentage of variance explained by each principal component is shown in the label of each axis.
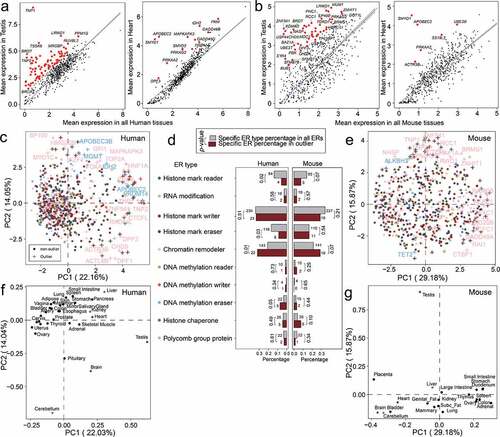
We also performed PCA analyses on gene expression in human () and mouse tissues (), from which we found many histone mark writers and histone remodellers appeared to have higher values in the first and second principal component in the PCA plots. To further examine the genes with extreme PCA values, we tried to identify outlier genes from the two PCA plots, respectively, based on top 10% largest Mahalanobis distances. As shown in , we identified 22 human chromatin remodeller genes as outlier genes from 143 human chromatin remodeller genes, which was more than expected (Fisher’s exact test, p = 0.01) (, left panel). 19 mouse chromatin remodeller outlier genes were identified from 141 mouse chromatin remodeller genes, though not much more than expected (Fisher’s exact test, p = 0.07), the p-value was still the lowest among that of all ER types in mouse (, right panel). Unfortunately, the numbers of histone mark writer outlier genes were less than expected (Fisher’s exact test, p = 0.51 for human and p = 0.21 for mouse genes). We found 20 outlier genes were shared in 69 human and 66 mouse outlier genes, including chromatin remodeller CTCFL, GADD45A, HMG20B, TNP1, TNP2, ZNF541, histone chaperone BAZ1A, ASF1B, histone mark eraser KDM4D, histone mark reader BRDT, polycomb group protein SFMBT1 as well as histone mark writer UBE2T, PRDM9, TTK, PBK, BRCA2, GSG2, TSSK6, AURKC, AURKA. The PCA loading results in indicated that tissues in the reproductive system (e.g., testis, ovary, and placenta) and nervous system (bain, cerebellum, and pituitary) had more tissue-specific ER genes, which was consistent with .
Distinct expression patterns for ER genes with same epigenetic substrates
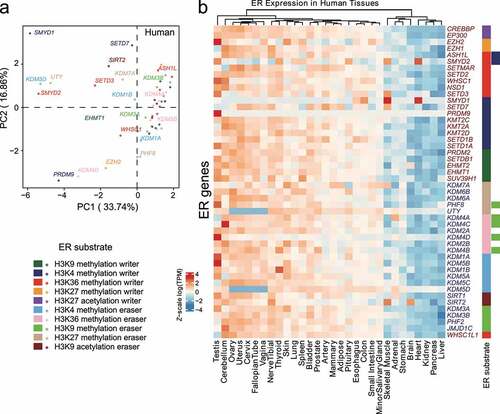
We also performed a PCA analysis on human tissues but only focused on the ERs with definitive amino acid-specific substrates, which were defined in a previous study [Citation12], including H3K4/27/36, H3K9 methylation writers/erasers, H3K27 acetylation writers, and H3K9 acetylation erasers. We found H3K4 methylation writer genes including SMYD1, PRDM9, and SETD7 had noticeably distinct expression patterns in different human tissues (). Similarly, H3K27 methylation eraser genes including UTY and PHF8 demonstrated a similar pattern (). Interestingly, though we also found that different genes with same specific substrates showed generally similar expression patterns, we still found specific ER genes that demonstrated distinct expression patterns from other ER genes with exactly the same substrate. For example, SMYD1 showed a very different expression pattern compared with SETD7, PRDM9, and KMT2C. Altogether, we demonstrated the unique expression patterns for specific ERs in different tissues. In addition, we also suggested that ERs with the same substrates, which may be previously considered to have redundant biochemical activities, can be highly tissue-specific, which may be closely related to their regulatory specificity in tissue development.
Figure 4. Analysis of tissue-specific expression for duplicated epigenetic regulators (ERs) with specific epigenetic substrates in human tissues. (a) PCA of gene expression in ERs with indicated epigenetic substrates in human GTEx tissues. (b) Heatmap of log(TPM) values of ERs with indicated epigenetic substrates throughout human GTEx tissues. Data are Z-scale processing row-wisely. Right-side rectangles represent different ER substrate types and are coloured based on the colour scheme at the bottom left in this figure.
Conserved tissue-specific expression patterns for ER genes across amniote species
Given the generally conserved expression patterns for human and mouse, it was straightforward to extend the ER expression analysis to a wider spectrum of species in amniotes. Consistent with , we also found that many histone mark writers and histone remodellers appeared to have higher values in the first and second principal component in the PCA plot based on gene expression in amniotes (, left panel). To further examine the genes with extreme PCA values, we also tried to identify outlier genes from the PCA plot in the same way as the PCA analysis in . As shown in right panel, we identified nine histone mark writer genes from 88 genes as outlier genes, which was nearly no difference compared with expected (Fisher’s exact test, p = 0.49). In addition, we identified seven chromatin remodeller genes from 55 genes as outlier genes, which was more than expected, but not significant (Fisher’s exact test, p = 0.26). Consistent with left panel, we also found DNA methylation eraser genes were much more than expected (Fisher’s exact test, p = 0.04). We also observed that no gene was found for the three ER types in the bar plots ( right panel). In addition, the total gene number analysed here was quite less than the number of human ER genes because many ERs were not available in the gene expression data from specific species or no consensus gene could be found, which may lead to an underestimate of p-values in statistical tests. As expected, nervous system and testis were also the main outlier tissues regarding ER expression patterns in amniotes (). Interestingly, brain and cerebellum (‘little brain’) in different species grouped together in the PCA loading plot (), which was consistent with the fact that the majority of cell types in the two organs are neurons.
Figure 5. Analysis of Epigenetic regulator (ER) expression specificity in six tissues across ten amniote species. (a) Principal component analysis (PCA) of ER log(RPKM) expression in amniote tissues. In the PCA plot (left panel), only the first two principal components (PC1 and PC2) are shown. Gene symbols of chromatin remodeller and DNA methylation eraser outliers are shown. Right panel shows the bar plots of the percentages of the outlier ER genes of each ER type in all outlier ER genes (in PCA plots). As a comparison, the bar plots of the percentages of the ER genes of different ER types in all ER genes are also shown. Gene numbers are shown above the bars. P-values were calculated by Fisher’s exact test. (b) PCA loading plot showing that tissues in different species are well clustered. Testis and brain tissues are clearly separated from the other amniote tissues for all species. (c) Heatmap of tissue-specific genes (i.e., differentially expressed genes, DEGs) for different species. Only DEGs that are associated with at least two tissues or two species are shown due to space limitation. (d) Pathway enrichment analysis of DEGs for different tissues of species. (e) Reactome pathway over-representation analysis based on brain-specific genes. (f) Reactome pathway over-representation analysis based on testis-specific genes.
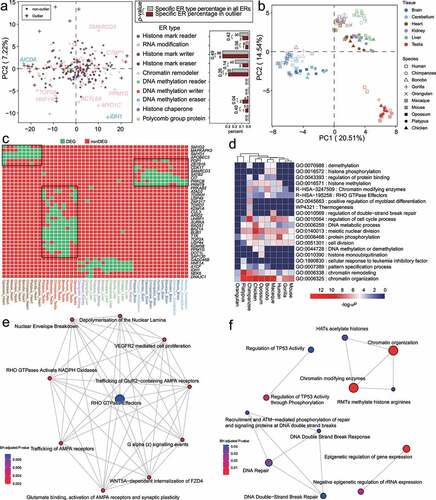
Furthermore, we obtained 72 tissue-specific ER genes (i.e., differentially expressed genes, DEGs) in ten amniote species based on the Tissue specificity (TS) score (see ‘Materials and methods,’ Supplementary Table S5). Consistent with , we also observed a clear separation among brain, cerebellum, testis, and other tissues across amniotes based on the clustering of tissue-specific ER genes (). Interestingly, we found many tissue-specific ER genes were also implicated in cancer. For instance, TOP2A, an exclusively expressed gene in human testis, can be recurrently dysregulated in various cancer types [Citation33,Citation34]. A possible mechanism of the implication of TOP2A in cancer is that it can break double-stranded DNA and induce gene transcription in the process of mitosis [Citation35]. Moreover, the tissue-specific ER genes were generally enriched in the functional terms of chromatin organization, chromatin remodelling, regulation of cell cycle process, and so on, for different species in amniotes (). We found that several terms were enriched in tissue-specific ER genes in many species (e.g., chromatin organization, regulation of cell cycle process, meiotic nuclear division, histone methylation), while other terms were only associated with one or two species (e.g., histone monoubiquitination, histone phosphorylation).
We further examined the enriched pathways of the tissue-specific ER genes. We found that specific overrepresented reactome pathways in brain-specific ER genes were related to neurons, for instance, trafficking of AMPA receptors [Citation36] and RHO-GTPase effectors [Citation37] (). VEGFR2 mediated cell proliferation term was also overrepresented, in consistent with the role of VEGF receptors in neuronal cell proliferation [Citation38]. The overrepresented pathways enriched in testis-specific genes were related to epigenetic regulation, DNA repair, P53 activity regulation, and chromatin organization, which can be explained by the fact that the genes involving meiosis, DNA repair were required in spermiogenesis to produce a large number of sperms [Citation39] (). For example, a gene ARID2 involved in chromatin organization can regulate chromatin organization in metaphase-I spermatocytes, the deletion of which can result in a metaphase-I arrest because of the dysregulation of cell division core genes [Citation40].
Taken together, our transcriptomic analyses in amniotes suggested that ER tissue-of-origin expression levels were comparable across species (). In addition, the tissue-specific ER genes tended to be functionally conserved, which was especially true for the ER genes related to cell cycle regulation and chromatin organization ().
Discussion
Well-studied ER genes are accumulating in the past thirty years. However, a comprehensive compilation and comprehensive understanding of the role of ER genes in epigenetic regulation remains unavailable. In this paper, we have done a comprehensive compilation of ER genes from different eukaryotic species, which is a valuable resource in the future ER study and is complementary to existing databases and online resources. Furthermore, we also characterize the ERs that are evolved from duplication events based on gene expression data across tissues in human, between human and mouse as well as in ten amniote species.
In this study, we identify a large number of duplication events during ER gene evolution (). We also suggest that ER gene duplication can generate new orthologous or paralogous genes in specific species, accompanied by the expression variation patterns of the duplicated genes, based on publicly available gene expression datasets from representative species. We also observe that the majority of differentially expressed ERs are testis or brain specific (), consistent with the general knowledge of more tissue-specific genes in the two organs, where brain- or testis-specific genes can perform their unique regulatory function. Our results demonstrate that the duplicated ER genes may have more similar gene expression patterns and gene function than would be expected in human (). However, we still find specific examples that orthologous gene expression levels are quite dissimilar and are potentially associated with unique regulatory function (). It seems that there exists some degree of function redundancy for the duplicated ER genes that allow them to perform different regulatory function in different tissues. This functional redundancy may be widespread in eukaryota for them to adapt to a complex environment and the gene deletion is generally less likely to be lethal [Citation41]. Further efforts may continue to characterize gene duplication events based on functional genomic data. Taken together, we observe either consistent expression or differential expression patterns for specific orthologous ERs in different tissues in a given species.
Epigenetic modifications are considered as an important mechanism to regulate downstream target gene expression. Purifying selection pressure is strong enough to prevent ER gene dysregulation in specific tissues like testis, brain, and cerebellum. The orthologous genes are necessary to alleviate the pressure of gene dysregulation and have compensatory roles in downstream gene regulation. Although the exact reason of tissue-specific constraint on ER expression is still elusive, the conserved gene expression may be caused by severe fitness consequence of changes in ER gene expression levels. Given the tremendous contrast between large number of all available genes and only hundreds of ER genes in a genome, we would hypothesize that the global expression landscape is controlled by a complex regulatory network of multiple ERs rather than individual ERs, which can be explored in future studies.
We also suggest in this paper that the ER duplication events can generate tissue-specific ER genes with the same epigenetic substrates (). Our expression analysis focuses on the ERs with definitive amino acid-specific substrates including H3K4/27/36, H3K9 methylation writers/erasers, H3K27 acetylation writers, and H3K9 acetylation erasers. We indicate the heterogeneous expression of specific ER genes with the same epigenetic substrates across tissues. For instance, we demonstrate SMYD1, SETD7, PRDM9, and KMT2C show very different expression patterns in the investigated tissues/organs (). Consistently, SMYD1 was specifically involved in heart development [Citation42], while PRDM9 as a specifically expressed gene in testis was particularly involved in the regulation of meiosis [Citation43]. Furthermore, SETD7, a gene responsible for transferring methyl group to lysine residue of substrates, involved in cellular processes including the DNA damage response and chromatin regulation [Citation44]. The examples clearly demonstrate that specific ER genes with same epigenetic substrates can have distinct regulatory role in different tissues. Though they are orthologs that were generated from same ancestors and once considered as ‘redundant’ regarding biochemical activities, we indicate that the gene redundancy may be necessary for the regulatory functional specificity in tissue development. More examples may be needed in the future to further support this statement.
Taken together, we compile the resource of ERs in 23 species based on HMM-based searches, which is the most comprehensive ER list involving various species until recently. Our analyses reveal that the duplicated ER genes have generally similar expression and function with ancestor genes. We also observe a consistent tissue-of-origin expression specificity pattern for specific ERs in amniote tissues and suggest the association between ER evolution and gene expression as well as function. Our analyses also suggest that the ER duplication events can generate tissue-specific ER genes with same epigenetic substrates, which are associated with distinct regulatory function. Taken together, our study contributes to better comprehend the tissue-specific ER gene expression and their potential functional impacts in tissue-specific epigenetic regulation across species.
Supplemental Material
Download MS Excel (518.2 KB)Disclosure statement
No potential conflict of interest was reported by the author(s).
Data availability statement
The data used in this study are all publicly available, see ‘Datasets’ section for further details. The generated results in this study can be found in Supplemental data.
Supplementary material
Supplemental data for this article can be accessed online at https://doi.org/10.1080/15592294.2022.2139067
Additional information
Funding
Related Research Data
References
- Chen T, Dent SY. Chromatin modifiers and remodellers: regulators of cellular differentiation. Nat Rev Genet. 2014;15:93–14.
- Yang XJ, Seto E. HATs and HDACs: from structure, function and regulation to novel strategies for therapy and prevention. Oncogene. 2007;26:5310–5318.
- Bell O, Tiwari VK, Thoma NH, et al. Determinants and dynamics of genome accessibility. Nat Rev Genet. 2011;12:554–564.
- Ram O, Goren A, Amit I, et al. Combinatorial patterning of chromatin regulators uncovered by genome-wide location analysis in human cells. Cell. 2011;147:1628–1639.
- Rodrigues CP, Shvedunova M, Akhtar A. Epigenetic regulators as the gatekeepers of hematopoiesis. Trends Genet. 2021;37(2): 125–142. DOI:10.1016/j.tig.2020.09.015
- Alda-Catalinas C, Bredikhin D, Hernando-Herraez I, et al. A single-cell transcriptomics CRISPR-Activation screen identifies epigenetic regulators of the zygotic genome activation program. Cell Syst. 2020;11:25–41 e29.
- Halaburkova A, Cahais V, Novoloaca A, et al. Pan-cancer multi-omics analysis and orthogonal experimental assessment of epigenetic driver genes. Genome Res. 2020;30:1517–1532.
- Medvedeva YA, Lennartsson A, Ehsani R, et al. EpiFactors: a comprehensive database of human epigenetic factors and complexes. Database (Oxford). 2015;2015:bav067.
- Singh Nanda J, Kumar R, Raghava GP. dbEM: a database of epigenetic modifiers curated from cancerous and normal genomes. Sci Rep. 2016;6:19340.
- Ru B, Sun J, Tong Y, et al. CR2Cancer: a database for chromatin regulators in human cancer. Nucleic Acids Res. 2018;46:D918–D924.
- Xu Y, Zhang S, Lin S, et al. WERAM: a database of writers, erasers and readers of histone acetylation and methylation in eukaryotes. Nucleic Acids Res. 2017;45:D264–D270.
- Boukas L, Havrilla JM, Hickey PF, et al. Coexpression patterns define epigenetic regulators associated with neurological dysfunction. Genome Res. 2019;29:532–542.
- Hu Z, Zhou J, Jiang J, et al. Genomic characterization of genes encoding histone acetylation modulator proteins identifies therapeutic targets for cancer treatment. Nat Commun. 2019;10:733.
- Lu J, Xu J, Li J, et al. FACER: comprehensive molecular and functional characterization of epigenetic chromatin regulators. Nucleic Acids Res. 2018;46:10019–10033.
- Consortium GT. The GTEx consortium Atlas of genetic regulatory effects across human tissues. Science. 2020;369:1318–1330.
- Mouse EC, Stamatoyannopoulos JA, Snyder M, et al. An encyclopedia of mouse DNA elements (Mouse ENCODE). Genome Biol. 2012;13:418.
- Brawand D, Soumillon M, Necsulea A, et al. The evolution of gene expression levels in mammalian organs. Nature. 2011;478:343–348.
- UniProt C, Martin M-J, Orchard S. UniProt: the universal protein knowledgebase in 2021. Nucleic Acids Res. 2021;49:D480–D489.
- Mistry J, Chuguransky S, Williams L, et al. Pfam: the protein families database in 2021. Nucleic Acids Res. 2021;49:D412–D419.
- Emms DM, Kelly S. OrthoFinder: phylogenetic orthology inference for comparative genomics. Genome Biol. 2019;20:238.
- Begik O, Lucas MC, Liu H, et al. Integrative analyses of the RNA modification machinery reveal tissue- and cancer-specific signatures. Genome Biol. 2020;21:97.
- Yu G, He QY. ReactomePA: an R/Bioconductor package for reactome pathway analysis and visualization. Mol Biosyst. 2016;12:477–479.
- Kuleshov MV, Jones MR, Rouillard AD, et al. Enrichr: a comprehensive gene set enrichment analysis web server 2016 update. Nucleic Acids Res. 2016;44:W90–97.
- Lyu J, Li JJ, Su J, et al. DORGE: discovery of oncogenes and tumor suppressor genes using genetic and Epigenetic features. Sci Adv. 2020;6(46):eaba6784. DOI:10.1126/sciadv.aba6784
- Gurumayum S, Jiang P, Hao X, et al. OGEE v3: online GEne essentiality database with increased coverage of organisms and human cell lines. Nucleic Acids Res. 2021;49:D998–D1003.
- Yu G. Gene ontology semantic similarity analysis using GOSemSim. Methods Mol Biol. 2020;2117:207–215.
- Lallemand T, Leduc M, Landes C, et al. An overview of duplicated gene detection methods: why the duplication mechanism has to be accounted for in their choice. Genes (Basel). 2020;11(9):1046. DOI:10.3390/genes11091046
- Barman S, Roy A, Padhan J, et al. Molecular Insights into the recognition of acetylated histone modifications by the BRPF2 Bromodomain. Biochemistry. 2022;61:1774–1789.
- Barman S, Roy A, Bardhan I, et al. Insights into the molecular mechanisms of histone code recognition by the BRPF3 Bromodomain. Chem Asian J. 2021;16:3404–3412.
- Obi JO, Lubula MY, Cornilescu G, et al. The BRPF1 bromodomain is a molecular reader of di-acetyllysine. Curr Res Struct Biol. 2020;2:104–115.
- Chen H, Xing K, He X. The dJ/dS ratio test reveals hundreds of novel putative cancer drivers. Mol Biol Evol. 2015;32:2181–2185.
- Chen H, Lin F, Xing K, et al. The reverse evolution from multicellularity to unicellularity during carcinogenesis. Nat Commun. 2015;6:6367.
- Wu Y, Han Y, Li Q, et al. Predictive value of topoisomerase II alpha protein for clinicopathological characteristics and prognosis in early breast cancer. Breast Cancer Res Treat. 2022;193:381–392.
- Du X, Xue Z, Lv J, et al. Expression of the topoisomerase II Alpha (TOP2A) gene in lung adenocarcinoma cells and the association with patient outcomes. Med Sci Monit. 2020;26:e929120.
- Wu KZ, Wang GN, Fitzgerald J, et al. DDK dependent regulation of TOP2A at centromeres revealed by a chemical genetics approach. Nucleic Acids Res. 2016;44:8786–8798.
- Hanley JG. AMPA receptor trafficking pathways and links to dendritic spine morphogenesis. Cell Adh Migr. 2008;2:276–282.
- Stankiewicz TR, Linseman DA. Rho family GTPases: key players in neuronal development, neuronal survival, and neurodegeneration. Front Cell Neurosci. 2014;8:314.
- Forstreuter F, Lucius R, Mentlein R. Vascular endothelial growth factor induces chemotaxis and proliferation of microglial cells. J Neuroimmunol. 2002;132:93–98.
- Leduc F, Maquennehan V, Nkoma GB, et al. DNA damage response during chromatin remodeling in elongating spermatids of mice. Biol Reprod. 2008;78:324–332.
- Menon DU, Kirsanov O, Geyer CB, et al. Mammalian SWI/SNF chromatin remodeler is essential for reductional meiosis in males. Nat Commun. 2021;12:6581.
- Makino T, Hokamp K, McLysaght A. The complex relationship of gene duplication and essentiality. Trends Genet. 2009;25:152–155.
- Warren JS, Tracy CM, Miller MR, et al. Histone methyltransferase Smyd1 regulates mitochondrial energetics in the heart. Proc Natl Acad Sci U S A. 2018;115:E7871–E7880.
- Baudat F, Buard J, Grey C, et al. PRDM9 is a major determinant of meiotic recombination hotspots in humans and mice. Science. 2010;327:836–840.
- Batista IAA, Helguero LA. Biological processes and signal transduction pathways regulated by the protein methyltransferase SETD7 and their significance in cancer. Signal Transduct Target Ther. 2018;3:19.