
 ?Mathematical formulae have been encoded as MathML and are displayed in this HTML version using MathJax in order to improve their display. Uncheck the box to turn MathJax off. This feature requires Javascript. Click on a formula to zoom.
ABSTRACT
Profiling of circulating cell-free DNA (cfDNA) by tissue-specific base modifications, such as 5-methylcytosines (5mC), may enable the monitoring of ongoing pathophysiological processes. Nanopore sequencing allows genome-wide 5mC detection in cfDNA without bisulphite conversion. The aims of this study were: i) to find differentially methylated regions (DMRs) of cfDNA associated with obesity in Göttingen minipigs using Nanopore sequencing, ii) to validate a subset of the DMRs using methylation-specific PCR (MSP-PCR), and iii) to compare the cfDNA DMRs with those from whole blood genomic DNA (gDNA). Serum cfDNA and gDNA were obtained from 10 lean and 7 obese Göttingen Minipigs both with experimentally induced myocardial infarction and sequenced using Oxford Nanopore MinION. A total of 1,236 cfDNA DMRs (FDR<0.01) were associated with obesity. In silico analysis showed enrichment of the adipocytokine signalling, glucagon signalling, and cellular glucose homoeostasis pathways. A strong cfDNA DMR was discovered in PPARGC1B, a gene linked to obesity and type 2 diabetes. The DMR was validated using MSP-PCR and correlated significantly with body weight (P < 0.05). No DMRs intersected between cfDNA and gDNA, suggesting that cfDNA originates from body-wide shedding of DNA. In conclusion, nanopore sequencing detected differential methylation in minute quantities (0.1–1 ng/µl) of cfDNA. Future work should focus on translation into human and comparing 5mC from somatic tissues to pinpoint the exact location of pathology.
Key policy highlights
Oxford nanopore sequencing can reveal changes in methylation patterns associated with obesity in minute quantities of cell-free DNA from serum.
Bisulphite conversion and methylation-specific PCR can be used to validate differentially methylated regions in cell-free DNA.
A differentially methylated region in an intronic region of the PPARGC1B gene was found associated with obesity.
Differentially methylated regions in cell-free DNA could be useful as early risk markers of certain diseases and pathologies.
Background
The use of cell-free DNA (cfDNA) in liquid biopsies has received attention across several scientific disciplines due to its attractive diagnostic and risk assessment potential. As cfDNA fragments are released during apoptosis and necrosis and retain cell type-specific molecular characteristics [Citation1], they may inform about ongoing pathophysiological processes in specific organs and tissues. In some cases, the analysis may provide substantial improvements in sensitivity and specificity over existing biochemical or other diagnostic techniques [Citation2,Citation3]. Detection of disease at an asymptomatic stage through methylation changes of cfDNA could support disease prevention, such as by identifying high-risk patients for early preventive measures. For example, blood levels of cfDNA have been found to be correlated with insulin resistance and other obesity-related cardiometabolic risk factors, leading to a proposal to use cfDNA as an auxiliary risk marker for cardiometabolic disease [Citation4].
A longstanding challenge in the interpretation of cfDNA release is to pinpoint the exact location of the pathology. As cfDNA shedding is not limited to pathological states but occurs continuously during natural cell turnover in healthy tissues, the total concentration of cfDNA in the circulation is not directly correlated with pathophysiological processes [Citation5–7]. Several solutions have been proposed to determine the tissue of origin of cfDNA. The detection of genome-wide epigenetic modifications, such as 5-hydroxymethylcytosine (5hmC) or 5-methylcytosine (5mC) [Citation8–14], is a particularly promising avenue. The use of Oxford Nanopore sequencing for genome-wide epigenetic profiling is advantageous, by allowing to sequence native DNA/RNA molecules without the use of additional chemistries, such as fluorescent dyes. Moreover, base modifications, such as 5hmC, are conserved and the degree of methylation can be directly calculated [Citation15].
Animal models are widely used to understand the pathophysiology of cardiometabolic disease. However, the naturally low concentrations of cfDNA require substantial volumes of blood, making some of the most used models, such as rodent models, impractical. Established pig models, such as the Göttingen minipig, are thus an attractive alternative for studying the role of cfDNA in cardiometabolic disease [Citation16–22].
The aims of this study are: i) to find differentially methylated regions (DMRs) associated with obesity in a Göttingen Minipig myocardial infarction (MI) model using nanopore sequencing, ii) to validate a subset of the DMRs using methylation-specific PCR (MSP-PCR), and iii) to indicate the origin of the cfDNA by comparing DMRs between cfDNA and whole blood genomic DNA (gDNA).
Materials and methods
Experimental animal obesity model
A graphical illustration of the full study design is available in . A total of 17 adult female Göttingen Minipigs (Ellegaard Göttingen Minipigs A/S, Dalmose, Denmark) had experimentally induced MI as described in Supplementary file 1. The animals were part of another study on heart failure where the effect of obesity on myocardial function was evaluated, and in addition, the lean pigs were used as a control group in another study on MI and sodium glucose co-transporter inhibitor (SGLT2i) treatment (manuscripts in preparation). In the present study, only naïve animals without SGLT2i treatment were used.
Figure 1. Illustration of the study design. MSP-PCR: Methylation-specific polymerase chain reaction. Created with BioRender.Com.
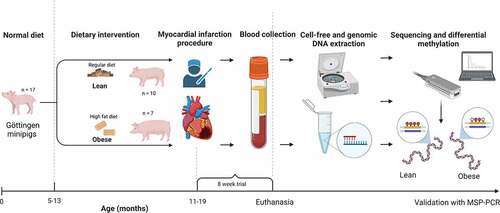
All animals were housed at the Novo Nordisk A/S facility in Denmark and had ad libitum access to water. Lean pigs were fed once daily with 360–400 g SDS minipig feed (Special Diets Service, Essex, UK). Obese pigs were fed with a Western style diet (25% fat, 23% fructose, 0.5% cholesterol) ad libitum for approximately 6 months to induce obesity, and thereafter 400 g per day to maintain stable weight during the trial period. The feed composition and nutrient levels for the lean and obese diets are available in Supplementary file 2. Pigs were single housed with the possibility of visual and snout contact with other pigs, at 18–22°C, relative air humidity of 30–70% and a 12-h light/dark cycle with natural light. Pigs were kept with woodchip and straw bedding. During study initiation, the animals were split into two groups: lean (n = 10) and obese (n = 7) and exposed to artificially induced MI.
Myocardial infarction procedure and blood collection
An experimentally induced MI [Citation19,Citation22] was conducted for all pigs (n = 17) in the study following the procedure described in Supplementary file 1. In short summary, MI was induced by balloon occlusion of the left anterior descending artery (LAD) for 120 min, followed by reperfusion. The occlusion was made with an angioplasty guide wire inserted into the LAD and a 2.5–3.0 × 12-mm Ikazuchi Zero balloon (Kaneka Medical products, Japan) inflated to 6 atmospheres just after the first diagonal branch of the LAD. After 8 weeks, the study was terminated, and the pigs were euthanized by cardiac excision during general anaesthesia. Prior to euthanasia, blood was collected from arterial sheaths sheets in a. femoralis in a total of 3 × 10 ml whole blood was collected in vacutainer tubes with clotting factor (BD Vacutainer® Clot Activator Tube, Plymouth, UK) and incubated for maximum clotting at room temperature for 60 min. After clotting, tubes were centrifuged at 1,500 × g at 4°C for 10 min and ~5 ml serum was immediately frozen at −80°C. All blood samples were collected between April and September 2021.
Cell-free DNA extraction from serum
After a maximum storage period of 3 weeks, extraction of cfDNA from serum was performed using the Qiagen Circulating Nucleic Acid kit in combination with the Qiagen QIAvac Vacuum System (Qiagen, Hilden, Germany). After extraction, the purified cfDNA was subjected to electrophoretic quality assessment using the Agilent Tapestation 4200 in combination with Cell-Free DNA Screentapes (Agilent, Santa Clara, CA, USA). The analysis confirmed cfDNA content in the 100–700 bp region, as well as provided region-specific cfDNA concentrations for later sequencing. All cfDNA was stored at −80°C until sequencing.
Genomic DNA extraction
Genomic DNA was obtained using 200 μl of the remaining whole-blood solid mass fraction in the Vacutainer tubes. Extractions were performed using the Qiagen DNA Mini Blood kit vacuum protocol (Qiagen, Hilden, Germany). All gDNA extractions were evaluated for fragment lengths and DNA integrity number using the Agilent Tapestation 4200 combined with Genomic DNA Screentapes (Agilent, Santa Clara, CA, USA) and stored at −80°C until sequencing.
Nanopore sequencing of cell-free DNA and genomic DNA
All nanopore sequencing was performed using the Nanopore MinION with version R9.4.1 chemistry and matching MinION flowcells (R.9.4.1). For cfDNA, 45 μl of undiluted cfDNA per sample was sequenced using the SQK-LSK110 ligation kit and multiplexed using the PCR barcoding kit (EXP-PCB001) following a modified version of the standard protocol available from Oxford Nanopore Technologies [Citation23]. The modifications were included to adapt the protocol for use with cfDNA and to conserve as many base modifications as possible, even though a PCR step was applied. First, all volumes of solid phase reversible immobilization beads were multiplied with 2.5× following recommendations of Martignano, et al. [Citation15] to bind the short cfDNA fragments. Second, to conserve as many base modifications as possible while still obtaining a high sequencing yield, the PCR barcoding program was cycled with a minimal extension step of only 15 s. The final PCR programme consisted of 3 min of initial denaturation at 95°C, 15 cycles of 15 s of denaturation at 95°C, 15 s of annealing at 62°C, and 15 s of extension at 65°C. The program concluded with 15 s of final extension at 65°C and a standby hold at 4°C indefinitely. After subsequent purification by bead cleanup, leftover eluate was saved at −80°C and sequenced in a second and third run to maximize the yield per sample.
All sequencing of gDNA was conducted with the SQK-LSK-109 ligation sequencing kit in combination with the native barcoding kit EXP-NBD104, following the protocol available from Oxford Nanopore Technologies [Citation24]. Briefly, a total of 100–200 femtomoles of gDNA in 48 μl of nuclease-free water was used as input. All steps, including end-prep and dA-tailing were conducted following the original protocol. Before pooling of natively barcoded samples, concentrations were measured with Qubit High Sensitivity assay (ThermoFischer Scientific) to ensure equal amounts of DNA in the libraries. For both cfDNA and gDNA, libraries were loaded using loading beads in a volume of 75 μl and the sequencing was performed over a period of 72 h or until the number of active pores was below 10.
Bioinformatics workflow
Raw reads were transferred to a local high-performance computing cluster and base called using Guppy (v. 5.0.7) [Citation25] in High Accuracy (HAC) mode using an NVIDIA A100-PCIE-40GB graphics card for enhanced high accuracy performance. The nanopore runs were evaluated using the MinIONQC script (v. 1.4.1) [Citation26]. Base-called reads were trimmed for low quality reads (Q-score <5) using NanoFilt (v. 2.8.0) [Citation27] and mapped to the Ensembl Sus scrofa reference genome (v. 11.1.104) [Citation28] using minimap2 (v. 2.17) [Citation29] in ONT mode. Mapped reads were sorted and indexed using samtools (v. 1.13) [Citation30] and evaluated using qualimap (v. 2.2.1) [Citation31].
Methylation calling and differential methylation analysis
Nanopolish (v. 0.13.2) [Citation32] was used to call 5mCs in the sequenced cfDNA and gDNA for each animal by applying a trained hidden Markov Model (HMM) and calculating a log-likelihood ratio (LLR) for each CpG site. A positive LLR indicated methylation and negative LLR indicated the absence of methylation [Citation33]. Differential methylation analysis was performed by comparing the output from Nanopolish to that of pycoMeth (v. 0.4.7) [Citation34]. Before comparison, two steps of quality control and data binning were performed in pycoMeth first, CpGs with their computed LLR were filtered so that only CpGs with a minimum of two cfDNA reads covering each CpG position were saved; second, the filtered CpGs were binned into genomic intervals of 1 kb spanning throughout the genome, only saving the intervals, which contained a minimum of 5 CpGs per interval. Additional quality filtering was applied requiring each interval to have a minimum of 2 or −2 LLR to be considered methylated or unmethylated, respectively, which is default setting in pycoMeth. All DMRs between the interval of 2 and −2 LLR were defined as ‘ambiguous.’ Finally, the LLR of the genomic intervals were statistically compared between lean and obese groups to find DMRs using a non-parametric Mann–Whitney test with a false discovery rate (FDR) threshold of 0.01. Transcription start sites (TSS) were extracted through pycoMeth, which were defined as any TSS within 10,000 bases up- or downstream from the DMR. The cfDNA DMRs were visualized using methylartist (v. 1.2.2) [Citation35]. For the top 10 strongest cfDNA DMRs, the nearest genes were additionally analysed by manual curation of the Ensembl Sus scrofa reference genome (v. 11.1.104) [Citation28] and the top strongest associated disorders (as measured by the Solr relevance score) of the human gene analogue were extracted from the MalaCards database [Citation36].
Validation by methylation-specific real-time quantitative PCR (MSP-PCR)
To validate and confirm the differential methylation of the top four strongest and most promising cfDNA DMRs, bisulphite conversion was performed using Qiagen EpiTech Bisulphite kit (Qiagen, Hilden, Germany) following the manufacturer’s instructions. Due to low DNA concentrations, an extra step of whole-bisulfitome amplification was performed using the Qiagen Whole Bisulfitome Kit (Qiagen, Hilden, Germany) following the manufacturer’s instructions. To assess complete bisulphite conversion, converted samples were run along their unconverted original DNA counterparts as negative controls in the MSP-PCR.
The MSP-PCR procedure followed the principles described by Zglejc-Waszak, et al. [Citation37], with several important modifications. Briefly, methylation-specific primers were designed using FASTA sequences of the DMRs obtained from Sus scrofa reference genome (v. 11.1.104) available through the Ensembl database [Citation28]. These sequences were used as input into the online methPrimer tool (v. 1.0) [Citation38], with 150 bp as the optimal PCR target. The PCR procedure was done in the proportions of 1 µl of bisulphite converted DNA, 5 µl of SYBR Green (PowerTrack SYBR Green Master Mix, ThermoFisher Scientific), 0.5 µl of each primer (forward and reverse) and 3 µl nuclease-free water in a total volume of 10 µl. The PCR conditions were as follows: 2 min pre-incubation at 95°C, and 45 cycles of amplification for 15 s at 95°C, 1 min at 60°C and 10 s at 72°C. A melting curve analysis was done in one cycle: 15 s at 95°C and 1 min at 60°C. All reactions were run on a Roche LightCycler® 480 in 384 well format (Roche, Basel, Switzerland). All primer sets including PCR efficiencies are available in Supplementary File 3.
In each run for each primer set (methylated and unmethylated), a standard curve using genomic DNA derived from the blood of a healthy, middle weight (34 kg) adult female Göttingen minipig unrelated to this study was used in the proportions of 1, 0.1 and 0.01. The standard curve allowed the calculation of relative concentrations and adjustment of the cycle threshold (Ct) values for primer inefficiency. All concentrations were calculated using Roche LightCycler® 480 software (v. 1.5). Methylation ratios were calculated following equation 1:
where Mconc. and UMconc. were the relative DNA concentrations calculated from the standard curves used for each primer set (methylated and unmethylated sets).
For the statistical part of the validation, a nonparametric Wilcoxon test was performed on the methylation ratios obtained from MSP-PCR in order to validate the differential methylation of the four most important cfDNA DMRs. Finally, nonparametric Spearman correlation tests were performed for each of the selected cfDNA DMRs to calculate the correlation between methylation ratios from MSP-PCR and body weight. All statistical analyses were performed in R (v. 4.2.0) using Rstudio (v. 2022.02.2). The alpha level was set to 0.05.
In silico gene enrichment analysis
Gene enrichment analysis was performed to find any overall patterns of enriched functions and pathways in the collection of TSS associated with the significant (FDR <0.01) cfDNA DMRs. The analysis was performed by loading TSS IDs into ClueGO (v. 2.5.8) [Citation39], a plugin for Cytoscape (v. 3.9.1) [Citation40] and using the curated Cluepedia (v. 1.5.8) [Citation41] database containing all gene ontologies (GO) and Kyoto Encyclopaedia of Genes and Genomes (KEGG) pathways [Citation42]. Gene enrichment analysis was conducted using the following parameters: min. level 3 and max level 8 in GO levels and kappa score set to 0.4 with GO Term fusion activated. Statistical testing was performed using two-sided hypergeometric test with Benjamini–Hochberg multiple test correction set at significance level 0.05. The GO used in analysis were: immune system process (ISU), biological process (BP), cellular component (CC) and molecular function (MF) from EBI UniProt [Citation43]. Moreover, KEGG pathways [Citation42], chromosomal locations and gene types were included in the analysis. The Cluepedia database was last updated on 13 May 2021.
Results
Animal model and DNA extractions
The mean body weight (± SD) of the lean and obese pigs at blood sampling was 25.95 (±2.02) kg and 60.79 (±5.27) kg, respectively, and the mean age of the lean and obese pigs was 13.5 (±0.5) months and 20.3 (±1.6) months, respectively. Full information on animals at time of MI procedure is available in Supplementary file 1. Collection of serum yielded 5.23 (±0.13) gram for lean and 5.19 (±0.41) gram for obese. Extractions of cfDNA yielded mean (± SD) concentrations normalized to 1 gram of serum of 0.21 (±0.18) ng/µl for lean and 0.06 (±0.04) ng/µl for obese pigs. All gDNA extractions yielded around 10 ng/µl with mean fragment length of around 20–40 kb. All blood samplings were performed in triplicates and collected from April 2021 to September 2021.
Nanopore sequencing
Nanopore sequencing yielded a mean (± SD) of 3.86 (±1.44) million and 3.81 (±1.84) million cfDNA reads per pig for the lean and obese groups, respectively. The mean number of mapped bases (± SD) per pig were 557 (±159) million and 659 (±210) million for lean and obese, respectively. For gDNA, sequencing yielded a mean of 190,052 (±133,216) and 54,356 (±25,052) gDNA reads per pig covering a mean of 739 (±694) million and 127 (±56) million mapped bases per pig for the lean and obese groups, respectively.
Differentially methylated regions of cell-free DNA associated with obesity
A total of 44,026 CpG positions are located within 3,514 genomic intervals satisfied the filtering parameters set in pycoMeth. Comparison between lean and obese pigs revealed a total of 1,236 significant (FDR <0.01) cfDNA DMRs. Summary statistics performed on the cfDNA DMRs showed the mean LLR of methylation (± SD) to be −1.44 (±3.52) for lean pigs and 0.71 (±3.50) for obese pigs, respectively. Statistical comparison of the LLR by a Wilcoxon non-parametric test showed the two groups to be significantly different (P < 0.0001). The cfDNA DMRs were 66.3% methylated and 33.7% unmethylated in the obese compared to lean pigs (). The top 10 significant DMRs and their closest genes are shown in . Four cfDNA DMRs with biological relevance were selected for validation by MSP-PCR and labelled by their closest gene: DMR-TUB (), DMR-PPARGC1B (), DMR-GAS6 () and DMR-EVL (). Biotype analysis of the 1,236 cfDNA DMRs showed that 439 DMRs were located close to a TSS, of which 308 TSS were associated with a protein-coding gene (). Full result table for the cfDNA DMRs are available in Supplementary file 4. Raw statistical information of all cfDNA intervals is available in Supplementary file 5.
Figure 2. Violin plot of log-likelihood ratios (LLR) of methylation of the 1,236 cell-free DNA (cfDNA) differentially methylated regions (DMRs) significantly associated with obesity. A Wilcoxon non-parametric test was used to compare the distributions of LLR between the two groups.
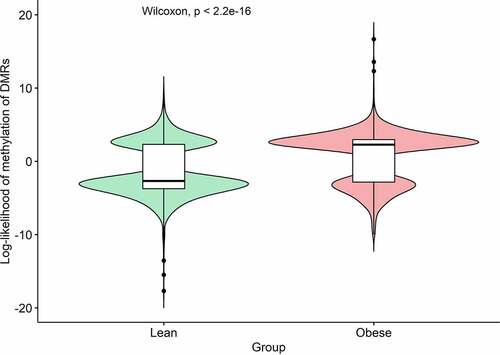
Figure 3. Genomic plots showing Oxford Nanopore sequencing data for the four differentially methylated regions (DMRs, blue highlights) obtained from cell-free DNA (cfDNA) and selected for validation by methylation-specific PCR. Each DMR was named by their closest genes of A: TUB and RIC3, B: PPARGC1B, C: GAS6 and D: EVL. Bottom X-axis indicates the number of CpG positions in the region. Lower window indicates the aggregated log-likelihood ratio (LLR) of the methylation of the CpG position, where 1 is highest probability of methylation. Middle Rawstat window indicates the raw computed test statistic for each cfDNA read obtained from Nanopolish, where positive indicates methylation and negative indicates unmethylation. The upper window shows each individual sequenced cfDNA read with identified CpG position illustrated as circles. A closed circle indicates methylation, whereas open circle indicates unmethylation. Top X-axis indicates genome coordinates in base pairs, with chromosome number in top left corner. Red: obese pigs. Green: lean pigs. Blue highlights: DMRs.
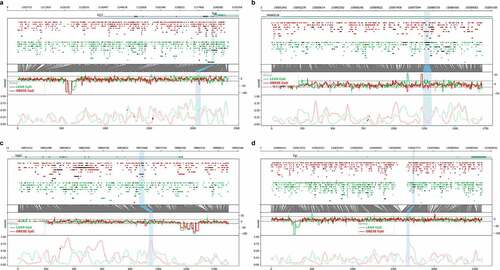
Table 1. Top 10 cfDNA DNA DMRs associated with obesity presented with genomic coordinates, false discovery rates (FDR), their nearest gene(s) according to their genomic coordinates and top disorder associated with the human gene analogue (obtained from MalaCards). MSP-PCR column indicates DMRs selected for bisulphite conversion and MSP-PCR validation.
Table 2. Types of genes associated with TSS located near or within significant DMRs from circulating cfDNA analysis associated with obesity.
Comparison with DMRs associated with obesity from genomic DNA
For gDNA, a total of 1,486 CpG positions located within 120 genomic intervals satisfied the filtering parameters set in pycoMeth. Of these, a total of 27 were statistically significant (FDR <0.01) DMRs associated with obesity. Summary statistics performed on these 27 gDNA DMRs showed the mean LLR of methylation (± SD) to be 0.56 (±3.58) for lean and −1.12 (±3.62) for obese pigs, respectively. The gDNA DMRs were 37% methylated and 63% unmethylated in the obese compared to lean pigs. Ten of the 27 gDNA DMRs were located close to a protein-coding gene and one to a lncRNA named ENSSSCT00000070233.
No overlap between the cfDNA DMRs and gDNA DMRs was found when comparing the genomic coordinates of the DMRs and their nearest TSS and/or genes. Summary statistics of methylation status for the gDNA DMRs are available in Supplementary file 6. Raw statistical information of all intervals is available in Supplementary file 7.
Validation of the PPARGC1 DMR by MSP-PCR
To validate the four most promising cfDNA DMRs identified by nanopore sequencing for association with obesity, we applied an independent traditional method: MSP-PCR. The results between MSP-PCR and nanopore sequencing were directionally consistent for three out of the four DMRs tested, of which the methylation ratio reached significance for the cfDNA DMR-PPARGC1B (P = 0.031) (). The cfDNA DMR-PPARGC1B was also significantly negatively correlated with body weight using a nonparametric Spearman Rank correlation test (r = −0.68, P = 0.0037) (). The mean (± SD) PCR efficiency for all eight primer combinations was 103.14% (±8.23%).
Figure 4. Validation of four differentially methylated regions (DMRs) associated with obesity by bisulphite conversion of cell-free DNA (cfDNA) and subsequent methylation-specific PCR (MSP-PCR) throughout the two experimental groups. Methylation ratios were obtained from the MSP-PCR procedure. Positive Y-axis value indicates methylation, negative Y-axis value indicates unmethylation. P values were obtained from a non-parametric Wilcoxon test.
Figure 5. Spearman correlations between methylation-specific PCR (MSP-PCR) ratios (Y-axis) and body weight of all 17 pigs for four differentially methylated regions (DMRs) associated with obesity. Positive Y-axis value indicates methylation, negative Y-axis value indicates unmethylation.
In silico analysis of cfDNA DMRs associated with obesity
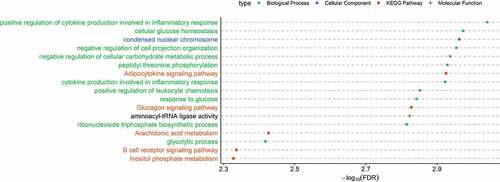
Gene enrichment analysis performed on the transcription start sites from cfDNA DMRs associated with obesity showed significant enrichment of 17 GO terms and KEGG pathways (FDR <0.05). These include 10 biological processes, one cellular component, one molecular function, and five KEGG pathways. The top three biological processes were positive regulation of cytokine production involved in inflammatory response, cellular glucose homoeostasis, and negative regulation of cell projection organization. The top cellular component and molecular function terms were condensed nuclear chromosome and aminoacyl-tRNA ligase activity. The top KEGG pathways were Adipocytokine signalling pathway, Glucagon signalling pathway, Arachidonic acid metabolism, B cell receptor signalling pathway, and Inositol phosphate metabolism (). All additional data including GO terms and pathways and their associated genes, are included in Supplementary file 8.
Figure 6. Significantly enriched (FDR<0.05) GO and KEGG pathways associated with obesity found from the transcription start sites (TSS) located near or within the differentially methylated regions (DMRs) of cell-free DNA (cfDNA). X-axis indicates -log10(FDR) obtained from ClueGO. Y-axis indicates GO term and/or KEGG pathways (green circle: biological process; blue triangle: cellular component; orange square: KEGG pathways; plus sign: molecular function).
Discussion
To the best of our knowledge, this study is the first to investigate obesity-associated changes in methylation patterns of cfDNA in blood using Oxford Nanopore sequencing. We identified a total of 1,236 DMRs associated with obesity. Moreover, to validate the usefulness of nanopore-derived DMRs, we applied an independent traditional method, MSP-PCR, which confirmed a DMR in PPARGC1B, a gene linked to the development of obesity and type 2 diabetes. We also found that the methylation patterns of cfDNA are highly different from gDNA, owing to the body-wide origin of cfDNA. In conclusion, this study provides a proof of concept that Oxford Nanopore sequencing can detect methylation changes associated with disease-related phenotypes, even when using very low concentrations (0.1–1 ng/µl) of circulating cfDNA obtained from fresh mammalian serum.
One of the top cfDNA DMRs we identified was located on chromosome 2 inside the first intron of PPARGC1B (). This DMR was also negatively correlated with body weight. The PPARGC1B gene has been previously associated with obesity and type 2 diabetes in human studies [Citation36,Citation44,Citation45]. The gene encodes the peroxisome proliferator-activated receptor γ coactivator 1β (PGC-1β), a transcriptional coactivator that interacts with various transcription factors and regulates metabolism and mitochondrial biogenesis by stimulating nuclear hormone receptors and related transcription factors [Citation46]. Moreover, the encoded protein is involved in inflammation and immunocompetence and is currently under active investigation for its role in childhood obesity [Citation47,Citation48]. Methylation of PPARGC1B in the saliva of 3–5-year-old children has shown association with decreased incidence of childhood obesity over a 3-years follow-up [Citation47], similar to the direction observed in the current study. In conclusion, the association between the differential methylation of PPARGC1B and the development of obesity and/or T2D should be subject to further investigation. Here, we provide the genomic coordinates and working primers with acceptable efficiencies for performing MSP-PCR in pigs, and the coordinates for the PPARGC1B DMR for future research into the methylation status of PPARGC1B in obesity and type 2 diabetes (Supplementary file 3).
We observed low cfDNA concentrations in the obese group compared with lean. This was in contrast to our hypothesis that adipose inflammation, characteristic for obesity, would increase cfDNA shedding as observed in mice [Citation49]. However, only few studies have explored the actual relationship between obesity, body weight and cfDNA release in human, and none in pigs. One study found a weak positive correlation between blood cfDNA levels and body fat percentage (BFP), but no change in cfDNA concentration 6 months after bariatric surgery that resulted in substantial weight loss [Citation50]. Another study found a positive correlation of blood cfDNA levels with BMI and gestational weight gain. The authors concluded a possible association between increased fat mass and cfDNA release [Citation51]. At present, it remains unclear whether cfDNA concentrations the circulation is directly altered by obesity in pigs.
In the gene in silico enrichment analysis for DMRs between obese vs. lean pigs, we observed heavy enrichment of positive regulation of cytokine production involved in inflammatory response and the Adipocytokine-signalling pathways. The interaction between pro-inflammatory adipokines, cytokines and obesity has been well studied in humans. Obesity is characterized by a chronic low-level inflammation, which can contribute to the development of insulin resistance and type 2 diabetes [Citation52,Citation53]. Cytokines are important intracellular messengers and mediators of the innate immune response [Citation54]. In type 2 diabetes, the expression and release of adipocytokines has been found to be influenced by epigenetic regulation, including DNA methylation and histone and chromatin remodelling [Citation55,Citation56]. Of the 1,236 DMRs we found comparing obese and lean pigs, the majority were methylated (66.3%) in the obese pigs, consistent with previous findings in obese Göttingen minipigs. In a study by Jacobsen, et al. [Citation57] on alterations in methylation profiles of obese pigs, the authors found global DNA hypermethylation in both B-cells and T-cells by flow cytometry [Citation58], which was linked to increased inflammation in adipose tissue [Citation57]. The findings were consistent with previous literature showing hypermethylation and greater variation in DNA methylation in obese humans compared to lean [Citation58,Citation59]. In our study, we found the B cell receptor signalling pathway to be enriched, indicating that epigenetic alterations of the immune system and B cells are associated with the obese state and the global DNA hypermethylation observed in the obese pigs. We hypothesize that hypermethylation is part of the inflammatory response in the adipose tissue, consistent with previous literature. Moreover, the Glucagon signalling pathway, enriched in the obesity-associated DMR genes, has been previously found to be under epigenetic regulation in obese and overweight pre-school children [Citation60]. In conclusion, the in silico enrichments observed from the DMRs are consistent with previous findings in obesity, both from human and preclinical findings, and suggest that methylation patterns of cfDNA provide relevant mechanistic insights into the pathophysiology of obesity.
By comparing the methylation of cfDNA and gDNA obtained from the solid fraction of whole blood, we found that cfDNA likely represents body-wide shedding of DNA from dying necrotic/apoptotic cells rather than DNA from cells in the solid fraction of the blood sample. None of the DMRs intersected between cfDNA and gDNA, and only one DMR shared proximity to the same transcription start site. Interestingly, one gDNA DMR was found associated with the lncRNA of ENSSSCT00000070233, which in turn is located only 6.4 kb from the important metabolism gene INSIG1 [Citation61]. Further research should clarify whether the vicinity to INSIG1 is purely coincidental or a result of bigger methylation changes happening in the region. The overall methylation status in obese pigs showed that DMRs were 66.3% methylated in cfDNA and only 37% methylated in gDNA from the same obese pigs. Hence, we speculate that cfDNA and gDNA contain DNA from different tissues. For cfDNA, the fragments arise from body-wide tissues, whilst gDNA comes from the more homogenous population of blood and immune cells. These findings emphasize the importance of carefully separating the different DNA fractions of blood samples and highlight the potential of cfDNA as a diagnostic tool for monitoring body-wide pathophysiological processes.
The advantages of Oxford Nanopore sequencing are its scalability and cost-effectiveness, requiring very little advanced laboratory infrastructure and little sample preparation time. Considering the challenging nature of cfDNA analysis, primarily related to very low DNA concentrations (<0.1–1 ng/μl), traditional Illumina sequencing would be a difficult undertaking, as the protocols require a minimum of 100 ng of input DNA for the Illumina LightCycler® DNA Nano kit [Citation62]. Moreover, Nanopore sequencing requires no bisulphite conversion, which simplifies the workflow and avoids damage to the integrity of the DNA. An intriguing possibility could be to use improved algorithms to call other types of base modifications, making methylation patterns only one of the several patterns for pathophysiological matching. With new and improved chemistries, a highly active open-source community, and high-performance computing becoming available to even small labs and even clinics, such possibilities could be within reach in the coming years.
Several limitations to the current study exist. First, the cfDNA was sequenced using a protocol that involved a PCR step that may remove base modifications due to the lack of a methyltransferase in the PCR reaction. With this in mind, we applied a minimal extension step in the PCR cycling of only 15 sec, far less than recommended by the manufacturer (min. 45 s) [Citation63]. The upcoming release of version 14 chemistry by Nanopore [Citation64] will allow for more efficient sequencing of native low concentration cfDNA without the need for any PCR steps, which can thus be omitted in future studies. Second, the WGS of gDNA we performed was shallow, amounting to less than 1× coverage of the pig genome, which could introduce bias in the comparison of methylation sites between gDNA and cfDNA. Third, the lack of tissue samples other than blood did not allow to pinpoint where the cfDNA methylation patterns originated from in the body. For example, if DNA from the adipose, muscle and organs had undergone WGS and methylation analyses, some of the methylation patterns obtained from cfDNA could have been matched to the corresponding tissues to determine the tissue of origin [Citation65]. Fourth, we used minipigs subjected to an induced MI, which could have influenced the methylation status. MI is caused by the restriction of blood flow in the myocardium, which involves local necrosis of the myocardial cells that could lead to increased shedding of cfDNA [Citation66]. The infarct sizes also differed by weight status, where the infarcts in lean were somewhat larger than in obese animals. However, as all pigs in the study underwent the same treatment and showed no clinical symptoms of heart failure after 8 weeks where the blood samples for this study were taken, we assumed that the procedure would not compromise the detection of methylation changes associated with the obese state. Moreover, the lean and obese pigs were not exactly age-matched with a mean difference of 6.8 months due to the length of the obesity procedure, but all pigs had reached maturity at the time of study (>13 months old) [Citation67]. Finally, the MSP-PCR was challenged by very low cfDNA concentrations when performing bisulphite conversions, consistent with findings from previous research [Citation68]. To overcome this limitation, we applied whole bisulfitome amplification, which increased analysis costs per sample and could have introduced a technical bias [Citation69]. For future studies, a step of Sanger Sequencing could confirm successful conversion but was omitted here due to time and cost limitations. The unmethylated primer sets generally had somewhat lower efficiencies than their methylated primer set counterparts (Supplementary file 3), consistent with previous observations [Citation70,Citation71]. This could have affected assay sensitivity and remains a challenge for performing MSP-PCR.
Perspectives and conclusion
To the best of our knowledge, this is the first study to use Oxford Nanopore sequencing to investigate cfDNA methylation changes due to obesity. We identified a cfDNA DMR in the putative obesity and diabetes gene PPARGC1B, which we validated using MSP-PCR. The PPARGC1B DMR could be a risk marker of obesity, or a marker for identifying obese individuals with increased risk of type 2 diabetes with potential for targeted treatment. Our findings indicate that cfDNA analysis using Oxford Nanopore sequencing can be a powerful technique for discovering methylation changes and pathways associated with metabolic disorders. Further studies are warranted to identify the tissue of origin of the differentially methylated cfDNA regions in obese pigs and to translate the findings into human.
Acknowledgments
This study was approved by the Danish Animal Experiments Inspectorate, following all current guidelines and regulations (licence number 2018-15-0201–01414).
Author contributions
MHD prepared the laboratory and statistical workflow, as well as designed, conducted, and validated results by MSP-PCR, conducted all statistical workflows and wrote the first draft of manuscript; MHD and CSF extracted nucleic acids and conducted all Nanopore sequencing; KPD, MF and MKL managed blood samplings; KPD and MF executed experimental animal procedures and provided consultation; MF, KPD, JEM, TPL, TJ and LHO were responsible for the overall animal study design as well as evaluated and provided expert consultation on the myocardial infarct model;TOK was the principal investigator, designing the overall study of using cell-free DNA as obesity biomarkers. All authors have approved the final draft of this manuscript.
Supplemental Material
Download Zip (1.2 MB)Disclosure statement
No potential conflict of interest was reported by the authors.
Data availability statement
All sequencing and methylation data from cell-free DNA samples supporting the findings of this paper are available in the National Centre for Biotechnology Information (NCBI) Sequence Read Archive (SRA) under the BioProject ID: PRJNA903387. Available from link: https://www.ncbi.nlm.nih.gov/sra/PRJNA903387.
Supplementary material
Supplemental data for this article can be accessed online at https://doi.org/10.1080/15592294.2023.2199374.
Additional information
Funding
References
- Cristiano S, Leal A, Phallen J, et al. Genome-wide cell-free DNA fragmentation in patients with cancer. Nature. 2019;570:385–15.
- Turchinovich A, Baranova A, Drapkina O, et al. Cell-free circulating nucleic acids as early biomarkers for NAFLD and NAFLD-associated disorders. Front Physiol. 2018;9:1256.
- Peng X, Li H-D, Wu F-X, et al. Identifying the tissues-of-origin of circulating cell-free DNAs is a promising way in noninvasive diagnostics. Brief Bioinform. 2020;22(3):bbaa060.
- Jylhävä J, Lehtimäki T, Jula A, et al. Circulating cell-free DNA is associated with cardiometabolic risk factors: the health 2000 survey. Atherosclerosis. 2014;233:268–271.
- Grabuschnig S, Bronkhorst AJ, Holdenrieder S, et al. Putative origins of cell-free DNA in humans: a review of active and passive nucleic acid release mechanisms. Int J Mol Sci. 2020;21:8062.
- Helmig S, Frühbeis C, Krämer-Albers E-M, et al. Release of bulk cell free DNA during physical exercise occurs independent of extracellular vesicles. Eur J Appl Physiol. 2015;115:2271–2280.
- Ziegler A, Zangemeister-Wittke U, Stahel RA. Circulating DNA: a new diagnostic gold mine? Cancer Treat Rev. 2002;28:255–271.
- Lehmann-Werman R, Neiman D, Zemmour H, et al. Identification of tissue-specific cell death using methylation patterns of circulating DNA. Proc Natl Acad Sci U S A. 2016;113:E1826–34.
- Gala-Lopez BL, Neiman D, Kin T, et al. Beta cell death by cell-free DNA and outcome after clinical islet transplantation. Transplantation. 2018;102:978–985.
- Zemmour H, Planer D, Magenheim J, et al. Non-invasive detection of human cardiomyocyte death using methylation patterns of circulating DNA. Nat Commun. 2018;9:1–9.
- Sun K, Jiang P, Chan KA, et al. Plasma DNA tissue mapping by genome-wide methylation sequencing for noninvasive prenatal, cancer, and transplantation assessments. Proc Natl Acad Sci USA. 2015;112:E5503–12.
- Guo S, Diep D, Plongthongkum N, et al. Identification of methylation haplotype blocks aids in deconvolution of heterogeneous tissue samples and tumor tissue-of-origin mapping from plasma DNA. Nat Genet. 2017;49:635–642.
- Kang S, Li Q, Chen Q, et al. CancerLocator: non-invasive cancer diagnosis and tissue-of-origin prediction using methylation profiles of cell-free DNA. Genome Biol. 2017;18:53.
- Li W, Li Q, Kang S, et al. CancerDetector: ultrasensitive and non-invasive cancer detection at the resolution of individual reads using cell-free DNA methylation sequencing data. Nucleic Acids Res. 2018;46:e89.
- Martignano F, Munagala U, Crucitta S, et al. Nanopore sequencing from liquid biopsy: analysis of copy number variations from cell-free DNA of lung cancer patients. Mol Cancer. 2021;20:1–6.
- Lyhne MK, Debes KP, Helgogaard T, et al. Electrocardiography and heart rate variability in Göttingen Minipigs: impact of diurnal variation, lead placement, repeatability and streptozotocin-induced diabetes. J Pharmacol Toxicol Methods. 2022;118:107221.
- Diemar SS, Sejling A-S, Iversen KK, et al. Influence of acute glycaemic level on measures of myocardial infarction in non-diabetic pigs. Scand Cardiovasc J. 2015;49:376–382.
- Larsen MO, Rolin B. Use of the Göttingen minipig as a model of diabetes, with special focus on type 1 diabetes research. Ilar J. 2004;45:303–313.
- Schuleri KH, Boyle AJ, Centola M, et al. The adult Göttingen minipig as a model for chronic heart failure after myocardial infarction: focus on cardiovascular imaging and regenerative therapies. Comp Med. 2008;58:568–579.
- Schumacher-Petersen C, Christoffersen BØ, Kirk RK, et al. Experimental non-alcoholic steatohepatitis in Göttingen Minipigs: consequences of high fat-fructose-cholesterol diet and diabetes. J Transl Med. 2019;17:1–18.
- Ludvigsen TP, Kirk RK, Christoffersen BØ, et al. Göttingen minipig model of diet-induced atherosclerosis: influence of mild streptozotocin-induced diabetes on lesion severity and markers of inflammation evaluated in obese, obese and diabetic, and lean control animals. J Transl Med. 2015;13:1–12.
- Bentsen S, Clemmensen A, Loft M, et al. [68ga]ga-NODAGA-E[(crgdyk)]2 angiogenesis PET/MR in a porcine model of chronic myocardial infarction. Diagnostics. 2021;11:1807.
- Oxford Nanopore Technologies. Ligation sequencing gDNA - PCR barcoding (SQK-LSK110 with EXP-PBC001). 2022.
- Oxford Nanopore Technologies. Ligation sequencing gDNA - native barcoding (SQK-LSK109 with EXP-NBD104 and EXP-NBD114). 2022.
- Wick RR, Judd LM, Holt KE. Performance of neural network basecalling tools for Oxford Nanopore sequencing. Genome Biol. 2019;20:1–10.
- Lanfear R, Schalamun M, Kainer D, et al. MinIONQC: fast and simple quality control for MinION sequencing data. Bioinformatics. 2019;35:523–525.
- De Coster W, D’hert S, Schultz DT, et al. NanoPack: visualizing and processing long-read sequencing data. Bioinformatics. 2018;34:2666–2669.
- Zerbino DR, Achuthan P, Akanni W, et al. Ensembl 2018. Nucleic Acids Res. 2018;46:D754–61.
- Li H, Birol I. Minimap2: pairwise alignment for nucleotide sequences. Bioinformatics. 2018;34:3094–3100.
- Danecek P, Bonfield JK, Liddle J, et al. Twelve years of SAMtools and BCFtools. Gigascience. 2021;10:giab008.
- García-Alcalde F, Okonechnikov K, Carbonell J, et al. Qualimap: evaluating next-generation sequencing alignment data. Bioinformatics. 2012;28:2678–2679.
- Simpson JT, Workman RE, Zuzarte P, et al. Detecting DNA cytosine methylation using Nanopore sequencing. Nat Methods. 2017;14:407–410.
- Liu Y, Rosikiewicz W, Pan Z, et al. DNA methylation-calling tools for Oxford Nanopore sequencing: a survey and human epigenome-wide evaluation. Genome Bio. 2021;22:1–33.
- Snajder RH, Stegle O, Bonder MJ. PycoMeth: a toolbox for differential methylation testing from Nanopore methylation calls. bioRxiv 2022.
- Cheetham SW, Kindlova M, Ewing AD Methylartist: tools for visualising modified bases from Nanopore sequence data. bioRxiv 2021.
- Rappaport N, Twik M, Plaschkes I, et al. MalaCards: an amalgamated human disease compendium with diverse clinical and genetic annotation and structured search. Nucleic Acids Res. 2017;45:D877–87.
- Zglejc-Waszak K, Waszkiewicz E, Franczak A. Periconceptional undernutrition affects the levels of DNA methylation in the peri-implantation pig endometrium and in embryos. Theriogenology. 2019;123:185–193.
- L-C L, Dahiya R. MethPrimer: designing primers for methylation PCRs. Bioinformatics. 2002;18:1427–1431.
- Bindea G, Mlecnik B, Hackl H, et al. ClueGO: a cytoscape plug-in to decipher functionally grouped gene ontology and pathway annotation networks. Bioinformatics. 2009;25:1091–1093.
- Su G, Morris JH, Demchak B, et al. Biological network exploration with cytoscape 3. Curr Protoc Bioinformatics 2014;47:8. 13. 1-8. 24.
- Bindea G, Galon J, Mlecnik B. CluePedia cytoscape plugin: pathway insights using integrated experimental and in silico data. Bioinformatics. 2013;29:661–663.
- Kanehisa M, Goto S. KEGG: Kyoto encyclopedia of genes and genomes. Nucleic Acids Res. 2000;28:27–30.
- Camon E, Magrane M, Barrell D, et al. The gene ontology annotation (goa) database: sharing knowledge in UniProt with gene ontology. Nucleic Acids Res. 2004;32:D262–6.
- Villegas R, Williams SM, Gao YT, et al. Genetic variation in the peroxisome proliferator‐activated receptor (PPAR) and peroxisome proliferator‐activated receptor gamma co‐activator 1 (PGC1) gene families and type 2 diabetes. Ann Hum Genet. 2014;78:23–32.
- Sun L, Yang Z, Jin F, et al. The Gly482Ser variant of the PPARGC1 gene is associated with type 2 diabetes mellitus in northern Chinese, especially men. Diabet Med. 2006;23:1085–1092.
- Carrer M, Liu N, Grueter CE, et al. Control of mitochondrial metabolism and systemic energy homeostasis by microRnas 378 and 378. Proc Natl Acad Sci U S A. 2012;109:15330–15335.
- Rushing A, Sommer EC, Zhao S, et al. Salivary epigenetic biomarkers as predictors of emerging childhood obesity. BMC Med Genet. 2020;21:1–9.
- Akinci A, Kara A, Özgür A, et al. Genomic analysis to screen potential genes and mutations in children with non-syndromic early onset severe obesity: a multicentre study in Turkey. Mol Biol Rep. 2022;49:1883–1893.
- Nishimoto S, Fukuda D, Higashikuni Y, et al. Obesity-induced DNA released from adipocytes stimulates chronic adipose tissue inflammation and insulin resistance. Sci Adv. 2016;2:e1501332.
- Zovico PVC, Neto VHG, Venâncio FA, et al. Cell-free DNA as an obesity biomarker. Physiol Res. 2020;69:515.
- Haghiac M, Vora NL, Basu S, et al. Increased death of adipose cells, a path to release cell‐free DNA into systemic circulation of obese women. Obesity. 2012;20:2213–2219.
- Gil A, Aguilera CM, Gil-Campos M, et al. Altered signalling and gene expression associated with the immune system and the inflammatory response in obesity. Br J Nutr. 2007;98:S121–6.
- Ershow AG. Environmental influences on development of type 2 diabetes and obesity: challenges in personalizing prevention and management. J Diabetes Sci Technol. 2009;3:727–734.
- Lacy P, Stow JL. Cytokine release from innate immune cells: association with diverse membrane trafficking pathways. Blood. 2011;118:9–18.
- Medzhitov R, Horng T. Transcriptional control of the inflammatory response. Nat Rev Immunol. 2009;9:692–703.
- Naidoo V, Naidoo M, Ghai M. Cell‐and tissue‐specific epigenetic changes associated with chronic inflammation in insulin resistance and type 2 diabetes mellitus. Scand J Immunol. 2018;88:e12723.
- Jacobsen MJ, Mentzel CMJ, Olesen AS, et al. Altered methylation profile of lymphocytes is concordant with perturbation of lipids metabolism and inflammatory response in obesity. J Diabetes Res. 2016;2016:8539057.
- Simar D, Versteyhe S, Donkin I, et al. DNA methylation is altered in B and NK lymphocytes in obese and type 2 diabetic human. Metabolism. 2014;63:1188–1197.
- Xu X, Su S, Barnes VA, et al. A genome-wide methylation study on obesity: differential variability and differential methylation. Epigenetics. 2013;8:522–533.
- Chang R, Zhang Y, Sun J, et al. Maternal pre‐pregnancy body mass index and offspring with overweight/obesity at preschool age: the possible role of epigenome‐wide DNA methylation changes in cord blood. Pediatr Obes. 2022;18:e12969.
- Dong X-Y, Tang S-Q. Insulin-induced gene: a new regulator in lipid metabolism. Peptides. 2010;31:2145–2150.
- Illumina. TruSeq™ DNA Nano. 2022.
- New England Biolabs. Guidelines for PCR Optimization with Taq DNA Polymerase. 2022.
- Oxford Nanopore Technologies. Ligation Sequencing Kit V14. 2022.
- Schultz MD, He Y, Whitaker JW, et al. Human body epigenome maps reveal noncanonical DNA methylation variation. Nature. 2015;523:212–216.
- Zemmour H, Planer D, Magenheim J, et al. Non-invasive detection of human cardiomyocyte death using methylation patterns of circulating DNA. Nat Commun. 2018;9:1443.
- Swindle MM, Smith AC. Swine in the laboratory: surgery, anesthesia, imaging, and experimental techniques. 3rd ed. Boca Raton: Taylor & Francis; 2015.
- Worm Ørntoft M-B, Jensen SØ, Hansen TB, et al. Comparative analysis of 12 different kits for bisulfite conversion of circulating cell-free DNA. Epigenetics. 2017;12:626–636.
- Sabina J, Leamon JH. Bias in whole genome amplification: causes and considerations. In: Kroneis T, editor. Whole genome amplification: methods and protocols. New York, NY: Springer; 2015. p. 15–41.
- Šestáková Š, Šálek C, Remešová H. DNA methylation validation methods: a coherent review with practical comparison. Biol Proced Online. 2019;21:19.
- Snellenberg S, Strooper LMAD, Hesselink AT, et al. Development of a multiplex methylation-specific PCR as candidate triage test for women with an HPV-positive cervical scrape. BMC Cancer. 2012;12:551.