
 ?Mathematical formulae have been encoded as MathML and are displayed in this HTML version using MathJax in order to improve their display. Uncheck the box to turn MathJax off. This feature requires Javascript. Click on a formula to zoom.
ABSTRACT
As the primary innate immune cells of the brain, microglia respond to damage and disease through pro-inflammatory release of cytokines and neuroinflammatory molecules. Histone acetylation is an activating transcriptional mark that regulates inflammatory gene expression. Inhibition of histone deacetylase 3 (Hdac3) has been utilized in pre-clinical models of depression, stroke, and spinal cord injury to improve recovery following injury, but the molecular mechanisms underlying Hdac3’s regulation of inflammatory gene expression in microglia is not well understood. To address this lack of knowledge, we examined how pharmacological inhibition of Hdac3 in an immortalized microglial cell line (BV2) impacted histone acetylation and gene expression of pro- and anti-inflammatory genes in response to immune challenge with lipopolysaccharide (LPS). Flow cytometry and cleavage under tags & release using nuclease (CUT & RUN) revealed that Hdac3 inhibition increases global and promoter-specific histone acetylation, resulting in the release of gene repression at baseline and enhanced responses to LPS. Hdac3 inhibition enhanced neuroprotective functions of microglia in response to LPS through reduced nitric oxide release and increased phagocytosis. The findings suggest Hdac3 serves as a regulator of microglial inflammation, and that inhibition of Hdac3 facilitates the microglial response to inflammation and its subsequent clearing of debris or damaged cells. Together, this work provides new mechanistic insights into therapeutic applications of Hdac3 inhibition which mediate reduced neuroinflammatory insults through microglial response.
Background
As the resident immune cells of the brain, microglia are acutely sensitive and respond rapidly to changes in the local brain environment [Citation1–3]. Due to their ability to respond to a diverse number of stimuli, microglia are involved in virtually all CNS disorders, ranging from degenerative and neurodevelopmental diseases to autoimmune neuroinflammatory conditions [Citation4]. Dozens of genetic loci affecting microglial phagocytosis, activation, or immunoregulation have been linked to Parkinson’s disease (e.g., TREM2) [Citation5], Alzheimer’s disease (e.g., ABCA7, EPHA1, MS4A6A, CD2AP, CD33) [Citation6], frontotemporal dementia (e.g., GRN) [Citation7], schizophrenia (e.g., C4) [Citation8], and multiple sclerosis (MS) (e.g., TNFRSF1A, IRF8, CD6) [Citation9–11]. Both over and under active microglial phenotypes have been linked to disease pathogenesis across different brain disorders [Citation4]. However, it is often unclear if altered microglial activity is helpful or harmful [Citation4], necessitating a deeper understanding of microglial regulation and functional impacts on the brain in both health and disease.
In reaction to an immune insult, microglia rapidly increase expression of inflammatory cytokines, allowing for increased phagocytosis of infectious agents [Citation12]. This requires induction of gene expression that is controlled through modifications of chromatin structure via epigenetic mechanisms [Citation13]. Epigenetic regulation occurs through numerous mechanisms including changes to nucleosome positioning, DNA methylation, non-coding RNAs and histone tail posttranslational modifications [Citation14–17]. Histone tail modifications are one of the best studied and most dynamic epigenetic modifications [Citation14,Citation17]. Histone tail acetylation is an epigenetic regulator of active transcription, both at promoters (H3K9ac) and enhancers (H3K27ac). These acetylation marks promote open chromatin by loosening the interactions between the DNA and histones and are recognized by transcriptional activators [Citation18]. Histone tail acetylation is added by histone acetyltransferases (Hats) and removed by Histone deacetylases (Hdacs). Hdacs are classified into five major classes: Class I (Hdac1, 2, 3 and 8), Class IIA (Hdac4, 5 7 and 9), Class IIB (Hdac6 and 10), Class III (Sirtuins) and Class IV (Hdac 11). Removal of histone tail acetylation by Hdacs alters DNA-chromatin electrostatic contacts resulting in compaction of chromatin structure, decreased accessibility for transcription factor binding and inhibition of transcription [Citation18].
Manipulating histone acetylation can modulate microglial gene expression and the immune response. However, there are conflicting findings in the literature on how Hdac inhibition can shape microglial function. The Hdac inhibitor drugs sodium butyrate, suberoylanilide hydroxamic acid (SAHA) and trichostatin A (TSA) that block class I and IIA Hdac activity enhance Il-6 and nitric oxide (NO) release following LPS treatment in N9 microglial cells [Citation19,Citation20]. TSA [Citation19], but not sodium butyrate [Citation20], enhanced Il-6 and NO release in primary rat microglial cultures and hippocampal slice cultures. Valproic acid, an inhibitor of both Class I and II Hdacs, enhanced LPS-induced histone acetylation and pro-inflammatory cytokine (Il-6, Il-1β, Tnfα) expression in primary rat microglia cultures [Citation21]. In contrast, LPS-induced anti-inflammatory cytokine (Il-10) expression was blunted by valproic acid [Citation21]. Another study in BV2 microglial cells found that SAHA and VPA both repressed Il-6 and Tnfα in response to LPS [Citation22]. In primary mouse microglial cultures, both TSA and SAHA increased histone 3 acetylation levels, but blunted LPS-induced expression of Il-6, Tnfα, Il-1β, iNos, Il-10, and Tgfβ and protein secretion of Il-6 and Tnfα [Citation23]. Similarly, in human fetal microglial cultures, TSA and valproic acid repressed cytokine expression [Citation24]. In primary mouse microglial cultures, TSA treatment blunted Arg1 induction in response Il-4 treatment, classically used to induce an ‘anti-inflammatory’ phenotype in macrophages, supporting Hdac regulation of multiple classes of inflammatory genes. TSA treatment also attenuated LPS-induced chemotaxis towards Adenosine Triphosphate (ATP), suggesting Hdac inhibition blunts immune responses in microglia [Citation23]. In vivo TSA given prior to LPS injection in mice reduced sickness behaviour and blunted cytokine gene expression and Iba1 stained microglial morphology changes [Citation25]. Together, these conflicting findings across different microglial culture and in vivo systems make the therapeutic utility of pan-Hdac inhibitors for treating neuroinflammation unclear.
In order to reconcile the conflicting literature on how histone acetylation and Hdac inhibition regulate microglial gene expression, recent work has focused on targeting specific Hdacs. Given that the majority of pan-Hdac inhibitors target Class I and II Hdacs, targeting these Hdacs has gained recent attention. For example, siRNA knockdown of Hdac1 and 2 suppressed LPS-induced expression of Il-6 and Tnfα in BV2 microglial cells [Citation22]. Pharmacological inhibition of Hdac3 reversed LPS-induced microglial morphology changes [Citation25,Citation26]. In response to brain damage, translation of Hdac3 is upregulated in both cortical [Citation27] and spinal cord microglia [Citation28]. The increase in Hdac3 protein levels appears to confer pro-inflammatory functions [Citation27,Citation28] as conditional deletion of Hdac3 in microglia improves outcomes following brain injury [Citation29] and pharmacological inhibition of Hdac3’s deacetylase activity reduces neuroinflammation and is protective in models of depression [Citation26], stroke [Citation27], and spinal cord injury [Citation28,Citation30]. However, how Hdac3 functionally regulates gene expression underlying microglial responses during neuroinflammation is not well characterized.
Previous work has explored Hdac3 as a key negative regulator of gene expression in the brain [Citation31]. Hdac3 is the only Hdac found in the N-CoR/SMRT complex [Citation32] and serves as the catalytic component of the complex, leading to histone deacetylation and transcriptional repression. The unique regulation of Hdac3 in microglia supports a critical role for Hdac3 in the regulation of microglial-mediated inflammation and provides a unique opportunity to target Hdac3 clinically to negate the negative impacts of neuroinflammation in brain disease. To investigate the potential neuroprotective mechanisms of Hdac3-inhibition, we investigated epigenetic, gene expression, and microglial functional shifts in an in vitro microglia model of immune activation by LPS.
Methods
All procedures were approved by the University of British Columbia biosafety committee (B19–0013).
BV2 immortalized microglia culture
BV2 is a transformed cell line that was purchased from ATCC. Cells were cultured in DMEM/F12 (ThermoFisher, Gibco #11320033), 10% HI-FBS (ThermoFisher, #12484028), 1× L-Glutamine (ThermoFisher, #25030081), 1× Penicillin–Streptomycin (ThermoFisher, Gibco #15140148). Cells were plated in reduced serum media DMEM/F12 and 2% HI-FBS without antibiotics for each experiment.
Hdac inhibitor, NOS inhibitor and LPS treatments
Hdac Inhibitor drugs RGFP966 (Hdac3 inhibitor) (APExBio #A8803), suberoylanilide hydroxamic acid (SAHA) (pan-Hdac inhibitor) (StemCell #73902) and Romidepsin (Hdac1 and 2 inhibitor) (Sigma-Aldrich #SML1175) were resuspended and stored in DMSO (Cell Signal Technology #12611). BV2 cultures were pre-treated with 15M RGFP966, 1
M SAHA, 15 nM Romidepsin, or DMSO (vehicle control) for 1 hour. Nω-Nitro-L-arginine methyl ester hydrochloride (L-NAME) was resuspended in distilled H2O (vehicle control) and added at a concentration of 100 μM. Lipopolysaccharides (LPS) from Escherichia coli (SigmaAldrich #L5418) was diluted in H2O and added at concentrations of 0.01-500 ng/mL for 1-, 3-, 6- or 24-h.
Reverse transcription quantitative real-time polymerase chain reaction (RT-qPCR)
BV2 cells were collected in RNA lysis buffer (from Zymo Research Quick-RNA Microprep kit) and RNA extraction performed using Zymo Research Quick-RNA Microprep kit (Zymo Research #R1051). Complementary DNA (cDNA) was synthesized from 200ng RNA using LunaScript® RT-SuperMix kit (New England Biolabs #E3010). RT-qPCR reactions were performed using Luna® Universal qPCR Master Mix (New England Biolabs #M3003). Primers for qPCR reactions are shown in (. All primer melt curves were evaluated to verify a single product of the predicted size was produced. Primer efficiency was validated by standard curve. ΔCt values were calculated using the ΔΔCt method. In all experiments, the house keeping gene Hprt1 was tested to verify no significant changes across conditions.
Table 1. RT-Qpcr primer sequences.
Cleavage under targets & release using nuclease assay (CuT&RUN)
CUT & RUN was performed using Cell Signaling Technology CUT & RUN Assay kit (Cell Signaling Technology #86652) according to manufacturer’s protocol. A total of 200,000 bead-bound cells were incubated with primary antibody overnight at 4°C (1:100 Acetyl-Histone H3 (Lys27) Rabbit mAb (Cell Signaling Technology #8173), 1:50 Acetyl-Histone H3 (Lys9) Rabbit mAb (Cell Signaling Technology #9649), 1:20 negative control Rabbit (DA1E) mAb IgG LEGENDplex® Isotype Control (Cell Signaling Technology #66362), and 1:50 positive control Tri-Methyl-Histone H3 (Lys4) Rabbit mAb (Cell Signaling Technology #9751)). Bead-cell-antibody samples underwent permeabilization by digitonin buffer, followed by incubation with modified micrococcal nuclease digestion at 4°C for 30 min. DNA fragments were released by shaking incubation and isolated using DNA Purification Buffers and Spin Columns (Cell Signaling Technology #14209). Yeast spike-in DNA (5ng) was added to each reaction for normalization using Sample Normalization Primer Set (Act1). Positive control antibody H3K4me3 was tested for successful reaction completion using SimpleChIP®RPL30 primers. qPCR reactions were performed using XP® Universal qPCR Master Mix (New England Biolabs #M3003).
CUT & RUN primer design
Primers were designed within the promoter regions (1000bp upstream of transcription start site, TSS) of Cxcl16, Il-1b, Nos2 and Arg1 using Primer3Web (Version 4.1.0) (). Only primers with linear amplification and one product by melt curve analysis were used.
Table 2. CUT & RUN qPCR primer sequences.
Input sample preparation and analysis of CUT & RUN qPCR data
Input control samples were prepared for each treatment condition for whole cell chromatin using micrococcal nuclease (Cell Signaling Technology #10011) digestion to mononucleosomes. qPCR of input samples was run for each qPCR primer set in serial dilutions of 1×, 1:5, 1:25, and 1:125. The Ct values of antibody-isolated CUT & RUN samples were referenced to standard curve (Ct values of input dilutions vs. Log10% input) and calculated as % of input. The % of input for each sample was then normalized by the Act1 yeast-spike in DNA to account for pipetting error. Normalized values were compared as fold enrichment over the DMSO-H2O treatment.
LEGENDplex assay for cytokine protein level analysis
BV2 cells were plated at 1E6 cells per well in a six-well plate in reduced serum media (DMEM/F12 and 2% HI-FBS) and allowed to settle for 3 hours prior to treatment. Cells were treated with RGFP966 (15M) for 1 hour followed by the addition of LPS (10 ng/mL) for 24 hours prior to media collection. Media was collected and the cytokine expression was profiled using the bead-based immunoassay LEGENDplex® (LEGENDplex® Mouse Macrophage/Microglia Standard Cocktail, BioLegend #740852) according to manufacturer’s instructions. Beads included were for IL10, IL1b, IL6 and TNF
. Beads were analysed using a CytoFLEX Flow Cytometer and data was analysed using the Biolegend Qognit software. Only IL6 and TNF
were within detectable range, so further analysis was only completed on those cytokines. Concentrations determined were normalized as a fold change to control within sample and compared when log transformed.
Phagocytosis assay quantified by flow cytometry
Phagocytic activity of BV2 microglia was detected using engulfment of pHrodo Red E. coli BioParticles™ Conjugate for Phagocytosis (ThermoFisher Scientific, #P35361). Cells were treated in last hour of incubation with 1:1000 dilution of pHrodo red E. coli BioParticles™. Cells were washed with FACS buffer and resuspended in 1% PFA for 1 hour at room temperature. The cells were washed twice in FACS buffer and run on the CytoFLEX Flow Cytometer. Flow cytometry data was analysed using gating for cell size, granularity, singlet cell population, and phycoerythrin (PE) red-channel signal to detect cells with bead engulfment. FlowJo was used to assess the percent of phagocytic positive cells gated on the no stain in the PE channel and the median fluorescent intensity (MFI) of the positive population.
Protein quantified by flow cytometry
Global protein concentration of the BV2 cells post treatment was assessed via flow cytometry using intracellular protein staining using the True-Nuclear Transcription Factor Buffer Set (Biolegend # 424401). Cells were incubated with primary antibodies for 30 min − 1:100 Acetyl-Histone H3 (Lys27) Rabbit mAb (Cell Signaling Technology #8173) or 1:250 Acetyl-Histone H3 (Lys9) Rabbit mAb (Cell Signaling Technology #9649). Antibodies were detected with 1:500 LEGENDplex® 568 Donkey Anti-Rabbit (Invitrogen #A10042) incubated with cells for 30 min. Cells were run on the CytoFLEX Flow cytometer. FlowJo was used to gate the cells for cell size (FSC A vs SSC A), singlets (FSC-H vs FSC-W), and then for positive signal in the 585 channel to detect antibody fluorescence. MFI for the 585 positive population was used as a measure for protein level. MFIs were normalized to the control condition to determine fold change and compared across conditions.
Griess reagent assay
The Griess Reagent kit (ThermoFisher #G7921) was used to quantify nitrite concentrations in media released by BV2 microglia as described by the manufacturer. A standard curve was prepared from nitrite-containing samples and used to determine sample concentrations.
Statistical analysis
In instances of one treatment, ordinary one-way ANOVAs were run comparing the mean of each treatment to the control. Dunnett’s post hoc comparisons were run for individual treatment comparisons. Residuals were tested for normality using Shapiro–Wilk test. In instances of two treatments (Hdac inhibitor and LPS treatment) a two-way ANOVA was run to fit a full effect model (Hdac inhibitor, LPS treatment and the interaction). Tukey’s or Sidak post hoc comparisons were run to compare individual conditions. Outliers were eliminated with ROUT method (Q = 5%). Residuals were tested for normality using Shapiro–Wilk test and homoscedasticity using the Spearman’s test for heteroscedasticity. All measures passed normality and homoscedasticity testing.
Results
BV2 microglial cells response to LPS treatment
Previous work has assessed the feasibility of BV2 microglia as a robust model of microglial responses [Citation33,Citation34]. We initially performed a dose curve experiment to assess the gene expression and histone acetylation responses in BV2s to LPS. The expression of interleukin-6 (Il-6), tumour necrosis factor alpha (Tnfa), and interleukin 1 beta (Il-1b), were all significantly increased in expression at an LPS range of 10–500 ng/mL [Citation35] for a 3-h duration () (Table S1).
Figure 1. BV2 Immortalized microglia robustly regulate gene expression and histone acetylation to LPS treatment. (a) RT-qPCR assessment of gene expression of Il-6, Tnfa, and Il-1b in BV2 microglia treated with different LPS doses of 10, 100, or 500 ng/mL for 3 h. Shown as bar graph of Log2(Fold Change) ± SEM Dunnett’s post hoc significances denoted (***p < 0.0002, ****p < 0.0001). (b) RT-qPCR assessment of gene expression of Il-6, Tnfa, Il-1b, Il-10, Cxcl16, Arg1, and Nos2 of BV2 microglia treated with 10 ng/mL LPS for 1, 3, 6, or 24 h. Shown as bar graph of Log2(Fold Change) ± SEM Dunnett’s post hoc significances denoted (*p < 0.03, **p < 0.002, ***p < 0.0002, ****p < 0.0001). (c) Global histone modifications by flow cytometry. Events are gated for cell size on side scatter (SSC) Area vs Forward Scatter (FSC) height and singlets on FSC-height vs FSC-width. The cells that are positive for the histone mark signal are gated based on an FMO in the same channel. The median fluorescence intensity of the positive population is exported for downstream analysis. Median fluorescent intensity (MFI) for global levels of H3K27ac levels as measured by intracellular flow cytometry. Fold Change ± SEM. Dunnett’s post hoc significances denoted (*p < 0.05, **p < 0.007, ***p < 0.0005, ****p < 0.0001). n = 2–7 replicates per condition from at least two independent sets of cultures.
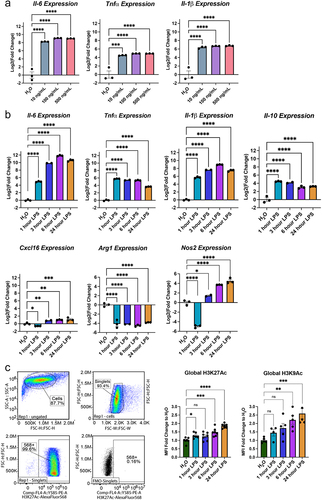
Responsiveness to 10 ng/mL LPS was then tested over a time course of 1, 3, 6, and 24 hours () for gene expression of pro-inflammatory cytokines Il-6, Tnfa, and Il-1b, anti-inflammatory cytokine Il-10, chemokine (C-X-C motif) ligand 16 (Cxcl16), arginase 1 (Arg1), and nitric oxide synthase 2 (Nos2). One-way ANOVAs revealed a significant main effect of LPS duration for Il-6, Tnfa, Il-1b, and Il-10, Cxcl16, Arg1, and Nos2 (Table S1). Dunnett’s post hoc comparisons were run for each LPS duration compared to H2O control and revealed the expected significant increase in cytokine and chemokine expression by 1 hour of treatment that largely maintained to 24 hours. Arg1 and Nos2, two enzymes that regulate nitric oxide (NO) production, showed significant repression at 1 hour of LPS. Arg1 remained below baseline levels while Nos2 increased above baseline by 6 and 24 hours of treatment.
To examine impact of LPS treatment on histone acetylation, we measured global protein levels of H3K27ac and H3K9ac by intracellular flow cytometry (). LPS treatment significantly increased both H3K27ac and H3K9ac. H3K27ac was significantly increased by 1 hour and H3K9ac after 6 hours of LPS.
Hdac inhibition modulates BV2 microglial gene expression
To test the role for different Hdacs in regulating LPS mediated gene expression, we utilized the clinically approved pan-Hdac inhibitor SAHA that inhibits all Class I and II HDACs (HDAC 1–10) [Citation36], Hdac3-selective small-molecule inhibitor RGFP966 that inhibits the enzymatic activity of Hdac3 (IC50 = 80 nM) with >200-fold selectivity over other Hdacs [Citation37] and Romidepsin, a potent prodrug inhibitor of Hdac1 and Hdac2 that is activated by glutathione [Citation38]. Hdac inhibitors were applied to BV2 cultures for 1 hour prior to treatment with either LPS or vehicle (water) for 3 hours (). We then examined the gene expression of Il-1b, Tnfa, Il6, Il-10, Cxcl16, Arg1, and Nos2. The genes analysed were responsive to both Hdac inhibition and LPS treatment. We therefore analysed the gene expression by two-way ANOVA with Tukey’s multiple comparison tests. All statistical test results are reported in Table S2.
Figure 2. Hdac inhibition modulates LPS regulated gene expression. (a) Experimental design for testing the role of Hdacs in modulating lipopolysaccharide (LPS) regulated gene expression in BV2 cultures. For all subsequent panels DMSO control is shown in blue, RGFP966 shown in red, SAHA in purple and Romidepsin in green. Each gene is depicted as three panels – DMSO vs. RGFP966, DMSO vs. SAHA, and DMSO vs. Romidepsin. (b) Il-1b, (c) Il10 and (d) Cxcl16 gene expression are enhanced by Hdac3 inhibition but not by Hdac1/2 inhibition (e) Tnfα expression is unaltered by Hdac3 inhibition but reduced by Hdac1/2 inhibition (f) Il6 expression is enhanced by Hdac3 inhibition at baseline but not in response to LPS. (g) RGFP966 blocks Arg1 repression after LPS treatment. Hdac1/2 inhibition results in the repression of Arg1 gene expression (h) Nos2 expression is increased moderately by RGFP966 both at baseline and in response to LPS. SAHA results in blunted gene expression at baseline and in response to LPS Romidepsin results blunting of Nos2 gene expression at baseline but not in response to LPS. Each panel is Log2 fold change relative to DMSO H2O and error bars are ± SEM. In all panels DMSO H2O versus DMSO LPS significance is not shown, but reaches statistical threshold (*p < 0.05) for all genes. n = 4–6 per condition in at least 3 independent cultures. *p < 0.05, **p<0.01, ***p < 0.001, ****p < 0.0001.
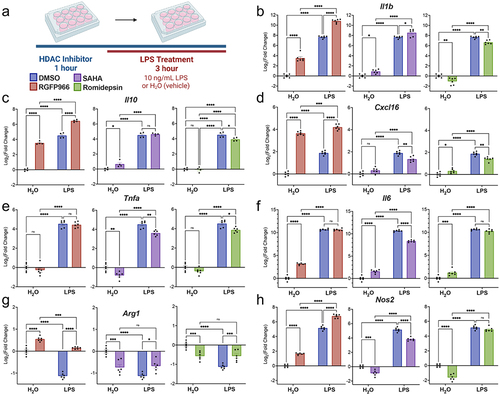
The gene expression for Il-1b revealed a significant enhancement in response to Hdac3 inhibition in both the vehicle and LPS treated conditions (). This response was specific to Hdac3 inhibition as Hdac1/2 inhibition by Romidepsin resulted in suppression of Il-1b gene expression both in the vehicle and LPS treated conditions. SAHA moderately enhanced baseline and LPS-induced Il-1b, suggesting the increased expression is likely driven by inhibition of Hdac3. As direct Hdac inhibition is hypothesized to activate gene expression, the results from the inhibitor treatment indicate that Il-1b might be directly regulated by Hdac3 but is unlikely to be directly regulated by Hdac1/2.
We next examined expression of the anti-inflammatory cytokine Il-10 and similar to Il-1b, we observed Hdac3-inhibition specific enhancements in gene expression (). RGFP966 treatment resulted in enhancement of Il-10 gene expression both at baseline and after LPS treatment. Meanwhile, neither SAHA nor Romidepsin enhanced baseline or LPS-induced Il-10 expression. Rather, romidepsin treatment blunted LPS-induced Il-10 levels. Similar to Il-10, for the chemokine Cxcl16 Hdac3 inhibition produced a significant enhancement in Cxcl16 expression both at baseline and in response to LPS (). In contrast, both SAHA and Romidepsin significantly blunted LPS-induced Cxcl16 expression, suggesting that Hdac3 may be the predominant regulator of Il-10 and Cxcl16.
We next investigated the expression of Tnfa. Unlike the previously investigated cytokines, there was no effect of Hdac3 inhibition on Tnfa gene expression (). However, both SAHA and Romidepsin repressed Tnfa gene expression at baseline and blunted responses to LPS. This pattern of Hdac1/2 inhibition suggests Tnfa may more strongly be regulated by Hdac1 and 2 than Hdac3.
We also investigated Il6 gene expression in response to LPS treatment and Hdac inhibition (). Hdac3 inhibition increased Il6 gene expression at baseline, but not in response to LPS. In comparison, both SAHA and Romidepsin treatment resulted in an enhancement of gene expression at baseline, but only SAHA blunted Il6 expression in response to LPS.
To examine a gene with LPS-induced repression, we measured Arg1 gene expression, which decreases expression in response to LPS treatment in BV2 cells (). In response to Hdac3 inhibition, Arg1 expression was significantly increased at baseline and failed to undergo LPS-induced repression (). Both SAHA and Romidepsin significantly repressed Arg1 gene expression at baseline and blunted the LPS-induced decreases, but only to a moderate effect. Together, this indicates that Hdac3 has a unique impact on Arg1 gene expression and that blocking Hdac3 activity prevents LPS-induced decreases in Arg1 gene expression.
As Arg1 acts in opposition to iNos (Nos2) in the generation of NO, we also examined impacts on Nos2 expression. RGFP966 treatment significantly enhanced baseline and LPS-induced Nos2 expression (). Both SAHA and Romidepsin significantly decreased baseline Nos2 levels and SAHA blunted LPS-induced Nos2. Together, these findings suggest Hdac3 inhibition produces a specific increase in Nos2.
Overall, the gene expression findings indicate that Hdac3 specifically negatively regulates microglial gene expression at baseline and in response to LPS. Inhibition of Hdac1/2 did not produce similar increases in gene expression and in the majority of genes either had no impact or a blunting of response. SAHA, as an inhibitor of Hdac1, 2 and 3 produced intermediate impacts on the expression of many of the genes, potentially reflecting the additive impact of inhibition of Hdac3 enhancing and Hdac1/2 inhibition inhibiting expression.
Hdac3 inhibition modulates BV2 microglial cytokine release
As Hdac3 inhibition increased cytokine gene expression both at baseline and in response to LPS, we aimed to examine whether these gene expression changes at 3 hours were maintained at a protein level through released cytokine assessment at 24 hours. RGFP966 was applied to BV2 cultures for 1 hour prior to treatment with either LPS or vehicle (water) for 24 hours (). The LEGENDplex bead-based immunoassay was used to assess the levels of Tnfα and Il6 (Table S3). For Tnfα, similar to the gene expression results, there was no impact of Hdac3 inhibition on the cytokine release at baseline or in response to LPS (). Similarly, for Il6, there is an effect of Hdac3 inhibition at baseline but not in response to LPS, as was observed in the gene expression (). Together, these data suggest that the cytokine release correlates to the gene expression patterns in response to Hdac3 inhibition.
Figure 3. Changes in cytokine release and global histone acetylation upon Hdac inhibition. (a) BV2 microglial cells were treated with DMSO, RGFP966, SAHA or Romidepsin for 1 hour and then H2O or LPS was added for 24 hours. Media was harvested for cytokine protein level assessment. Cells were then harvested, and intracellular staining was performed for H3K9ac or H3K27ac. LEGENDplex immunoassay levels of cytokine (b) Tnfα shows no impact of Hdac3 inhibition in combination with LPS. (c) Il6 protein levels were enhanced in response to Hdac3 inhibition at baseline. Graphs are depicted as log2fold change relative to DMSO H2O treated samples. n = 6 per treatment in 3 independent replication experiments. Tukey’s corrected posthocs *p < 0.05, **p < 0.005, ***p < 0.001, ****p < 0.0001. (d) Global levels of H3K27ac were increased with RGFP966, SAHA, and Romidepsin at baseline and upon LPS treatment. (e) Global levels of H3K9ac were significantly increased with RGFP966, SAHA and Romidepsin at baseline and upon LPS treatment. MFI: median fluorescence intensity. Fold change is relative to DMSO treated water samples. n = 9 per treatment in 3 independent cultures. Tukey’s corrected posthocs *p < 0.05, **p < 0.005, ***p < 0.001, ****p < 0.0001.
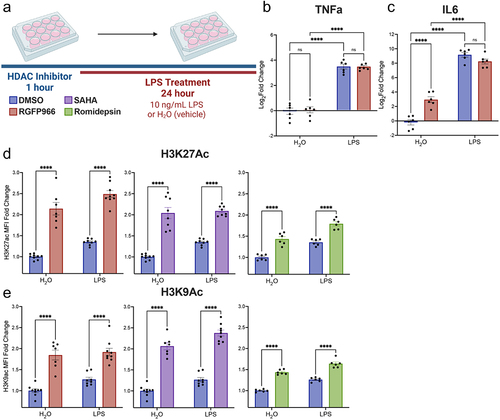
Hdac inhibition enhances histone acetylation
The impact of Hdac3 inhibition on gene expression both at baseline and in response to LPS supports a model in which increased histone acetylation in response to RGFP966 is permissive for LPS regulated gene expression. Consequently, the increases in histone acetylation would then be consistent with the observed pattern gene expression patterns of released gene repression at baseline, enhanced LPS-induced gene expression and prevention of LPS-induced repression of gene expression. To test this hypothesis, we first examined global histone acetylation changes in response to Hdac inhibition by SAHA, RGFP966 or Romidepsin and LPS treatment by flow cytometry. For all three Hdac inhibitors, there was a significant effect of both drug treatment and LPS treatment on the global levels of both H3K9Ac and H3K27Ac (Table S3). Tukey’s corrected posthoc comparisons revealed that all Hdac inhibitors significantly increased H3K27ac and H3K9ac at baseline and upon LPS treatment ().
To examine the link between gene expression and changes in histone acetylation by Hdac3, we examined H3K27ac and H3K9ac by CUT&RUN qPCR at the promoters of select genes with expression regulated by Hdac3 inhibition (). The positive control H3K4me3 antibody produced significant enrichment over non-immune IgG (t(6) = 2.511, p = 0.0458) indicating the CUT&RUN procedure was working as expected. As there is expected to be impacts of both LPS treatment and Hdac3 inhibition, we analysed the data by two-way ANOVA with Sidak’s posthoc comparisons. All statistical data is reported in Table S4.
Figure 4. Histone acetylation changes at Hdac3 modulated genes. (a) Experimental design for CUT&RUN qPCR analysis of H3K27ac and H3K9ac over promoters of key Hdac regulated target genes. All samples are normalized to yeast spike in and expressed as a percentage of input sample based on standard curve. Signal then calculated as fold enrichment relative to the H3K27ac or H3K9ac antibody levels in the DMSO and water treated control. DMSO and RGFP966 non-immune IgG samples were included for all experiments (b) H3K27ac and H3K9ac signal is significantly increased over the Cxcl16 promoter with RGFP966 treatment. (c) Trends for increased H3K27ac and H3K9ac signal with RGFP966 over the Il1-b promoter. (d) H3K27ac signal is significantly increased over the Arg1 promoter with RGFP966 treatment. H3K9ac shows similar trends but did not reach significance. (e) H3K27ac signal is significantly increased over the Nos2 promoter with RGFP966 and LPS treatment. H3K9ac shows similar trends but did not reach significance. All plots are fold enrichment with ± SEM. n = 3 per condition in independent cultures. *p < 0.05.
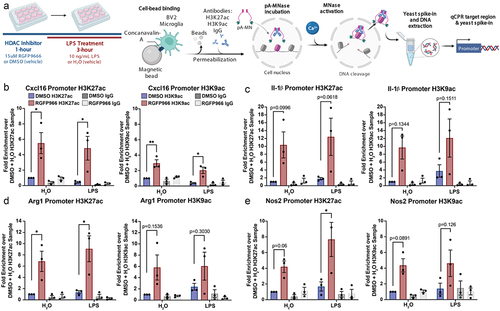
We examined H3K27ac and H3K9ac over the Cxcl16 promoter (). Posthoc comparisons between RGFP966 and DMSO treated samples revealed a significant increase in H3K27ac promoter signal with Hdac3 inhibition both at baseline and in response to LPS. Likewise, there was a significant increase in H3K9ac promoter signal with Hdac3 inhibition both at baseline and in response to LPS.
For the Il-1b promoter H3K27ac levels, we found no effect of LPS treatment but a significant enhancement effect of RGFP966 treatment (). H3K9ac levels showed a similar pattern over the Il-1b promoter with a significant effect of Hdac inhibition with no effect of LPS or interaction. Posthoc comparisons showed non-significant trends towards enhanced H3K27ac and H3K9ac signal over the promoter at baseline and with LPS.
At the Arg1 promoter, for both H3K27ac and H3K9ac, there was a significant effect of Hdac3 inhibition with no effect of LPS treatment or interaction (Table S4). Posthoc comparisons revealed a significant increase in H3K27ac signal after RGFP966 treatment over DMSO at both baseline and in response to LPS. Similar increases were also observed for H3K9ac, but did not reach statistical significance (). At the Nos2 promoter, for both H3K27ac and H3K9ac, there was a significant effect of Hdac3 inhibition with no effect of LPS treatment or interaction (Table S4). Sidak corrected posthocs revealed a trend for increased H3K27ac with RGFP966 treatment at baseline and a significant enhancement upon LPS treatment. There were trends for RGFP966 induced increases in H3K9ac at baseline and with LPS, but they did not reach statistical significance ().
Hdac inhibition enhances microglial phagocytosis and impairs NO release
To examine microglia function, we measured release of NO into the media at 24 hours of LPS treatment and phagocytosis of pH-rodo tagged E. coli (). Two-way ANOVA results revealed a significant interaction between LPS treatment and Hdac3 inhibition and posthoc tests revealed that RGFP966 treatment blunted LPS-mediated NO release ( and Table S5). To examine how Hdac inhibition may impact microglia phagocytosis, we measured engulfment of pH-rodo E. coli labelled beads. These beads specifically fluoresce when in the low pH environment of the phagolysosome which allows them to be easily quantified by flow cytometry. At 24 hours following treatment, there was a significant effect of both LPS treatment and Hdac3 inhibition on the percent of BV2 microglial cells that had engulfed beads (% bead positive). Posthoc tests revealed that RGFP966 treatment significantly increased the percent of cells engulfing beads both at baseline and in response to LPS ().
Figure 5. Hdac inhibition enhances microglial phagocytosis in a Nitric Oxide dependent matter. (a) Experimental design for phagocytosis assay and NO Assay. Media was collected for NO measurement prior to bead addition for phagocytosis. pHrodo beads were added for 1 hour and the percent of cells engulfing pHrodo beads was quantified by flow cytometry (b) Schematic of how Nω-Nitro-L-arginine methyl ester hydrochloride (L-NAME) acts as a Nos inhibitor of which inhibits NO production and the predicted impacts on phagocytosis. (c) Example phase contrast and fluorescent images depicting enhanced bead engulfment by RGFP966 treatment at baseline and in response to LPS. Engulfed beads are shown in red. (d) Hdac3 inhibition blunts NO production in response to LPS. (e) Hdac3 inhibition enhances the percent of cells engulfing beads both at baseline and in response to LPS. (f) L-NAME blunts NO release in response to LPS and removes the impact of Hdac3 inhibition (g) L-NAME eliminates the impact of Hdac3 inhibition on phagocytosis following LPS treatment, but not at baseline. Mean ± SEM. n = 5–6 from 3 independent cultures *p < 0.05, **p<.01, ***p < 0.001, ****p < 0.0001.
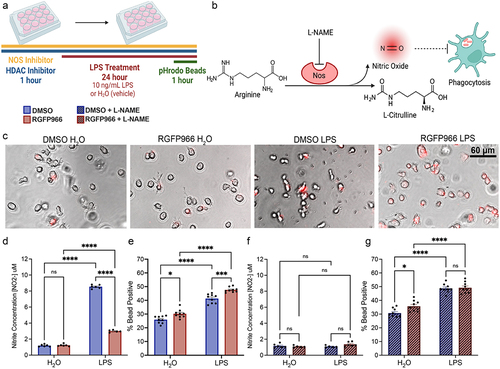
We next hypothesized that the blunting of LPS-mediated NO release () could be causing the increase in phagocytosis () in following RGFP966,, as previous work has indicated that NO can regulate phagocytosis [Citation39]. To test this hypothesis, we inhibited Nos, which catalyzes the production of NO from L-arginine, with 100 M L-ω-nitroarginine methyl ester (L-NAME) and verified that L-NAME blocked LPS-mediated NO release with and without RGFP966 treatment (). To test the impact on phagocytosis, we treated the cells with 100
M L-NAME concurrently with RGFP966 for 1 hour prior to LPS treatment for 24 hours and assessed bead engulfment (). We observed that inhibiting Nos did not block the RGFP966 mediated enhancements of phagocytosis at baseline but did abolish RGFP966 enhancements of phagocytosis in response to LPS. Together, this suggests that RGFP966 mediated blunting of NO is required for the enhancement of LPS-induced phagocytosis, but not baseline levels of microglial phagocytosis activity.
Discussion
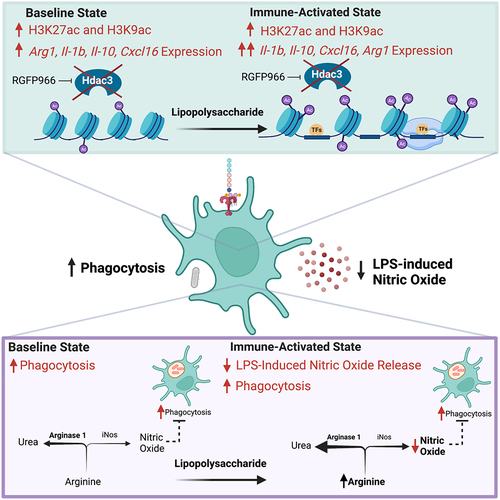
Pharmacological inhibition of Hdac3’s deacetylase activity reduces neuroinflammation and is protective in models of depression [Citation26], stroke [Citation27], and spinal cord injury [Citation28,Citation30]. Conditional deletion of Hdac3 in microglia shifts microglial responses in traumatic brain injury towards a more inflammation-resolving phenotype and improved functional recovery [Citation29]. Together, this suggests a role for Hdac3 in regulating microglial function and that suppression of Hdac3 is beneficial for combating neuroinflammation. Our findings indicate that the beneficial effects of inhibiting Hdac3 may be due to several functions of Hdac3 in microglia (). We found that Hdac3 inhibition robustly increased histone acetylation and gene expression of numerous cytokines (Il1-b, Il-10), chemokines (Cxcl16) and LPS inducible regulators (Arg1, Nos2) both at baseline and in response to LPS. Hdac3 inhibition blunted LPS-induced NO release that drove enhanced phagocytosis in response to LPS. While classically considered a pro-inflammatory response, enhanced phagocytosis following injury or acutely during disease is beneficial for clearing dead or dying cells in the brain. Augmenting this microglial response may ultimately facilitate brain recovery after damage as observed in vivo with Hdac3 inhibition.
Figure 6. Model for Hdac3 regulation of LPS-mediated gene expression and function in microglia. Hdac3 represses baseline gene expression through deacetylation of H3K27ac and H3K9ac marked histones. Upon LPS stimulation Hdac3 releases, allowing for increased histone acetylation and immune activation. In the presence of RGFP966, Hdac3’s deacetylase activity is blocked, allowing for increased histone acetylation at baseline and an aberrant increase in baseline gene expression. LPS treatment combined with inhibition of Hdac3 results in hyper-induction of Hdac3 target genes and a lack of suppression of genes normally repressed by LPS. These gene expression shifts ultimately culminate in repressed NO release and increased phagocytosis, driving microglia towards a phenotype that promotes debris clearance. Hdac3 inhibition may drive the changes in NO and phagocytosis through modulation of arginine usage in response to LPS by increasing Arg1 expression and pushing the reaction away from NO generation.
Our gene expression findings indicate that RGFP966 may regulate NO release and phagocytosis activity through control of expression of Arg1 and Nos2 (iNos). The enzymatic processes of Arg1 and iNos compete for the substrate L-arginine with opposing cellular phenotypes [Citation40]. Arg1 hydrolyzes L-arginine to produce urea and L-ornithine, which removes nitrogen from amino acid metabolism via the urea cycle and promotes cell proliferation [Citation41]. The substrate L-arginine is also used by iNos in the production of L-citrulline and NO. We found a decrease in Arg1 expression with LPS treatment that would effectively decrease competition for L-arginine, allowing iNos to increase production of NO, as we observed in DMSO treated cells upon LPS. RGFP966 effectively prevented the decrease in Arg1 expression and had only marginal impacts on Nos2, potentially shifting the microglial activation state away from NO production. In concordance with this conclusion, we found decreased LPS-induced NO production after RGFP966 treatment. We also found that RGFP966 treatment enhanced microglial phagocytosis and that this enhancement was dependent on NO. Overall, our findings are consistent with Hdac3 inhibition enhancing microglial immune responses. Acutely enhanced phagocytosis would be predicted to improve removal of dead and damaged cells, enhancing recovery, consistent with the observed effects of RGFP966 in the context of stroke [Citation27] and spinal cord injury [Citation28,Citation30]. Hdac3 inhibition also enhanced expression of both pro- and anti-inflammatory cytokine expression, supporting a more complex role in Hdac3 regulation of inflammatory responses. However, based on our phagocytosis effects, chronic administration of RGFP966 beyond the acute injury phase may prove detrimental after resolution of the initial inflammatory event has occurred. This supports the need for future work on chronic impacts of Hdac3 inhibition on microglial functions before moving Hdac3 inhibitors into the clinic for treating neuroinflammation.
The primary function of NO release by immune cells is to defend against pathogens [Citation42]. At low concentrations NO acts as a signalling molecule to promote growth and activity of immune cells. At high concentrations, NO diffuses across cellular membranes of invading pathogens and binds to DNA, proteins and lipids resulting in oxidative damage and pathogen death [Citation43]. Microglia in culture or in vivo increase expression of iNos and NO release under inflammatory conditions such as exposure to parasites [Citation44], LPS [Citation45–47], stroke [Citation48], injury [Citation49], and in models of neurodegeneration [Citation50]. High concentrations of NO can be toxic to the host tissue, leading to neuronal [Citation51] or glial [Citation45] death. For example, in a mouse model of prion disease, LPS treatment induced microglial expression of iNos, release of NO and triggered increases in neuronal death [Citation51]. NO release in an LPS-induced model of neurodegeneration mediated dopaminergic neuron death [Citation46] and blocking iNos was protective. The ability of RGFP966 to repress LPS-induced NO release may similarly be neuroprotective.
Similar to our finding that RGFP966 can enhance phagocytosis in a NO-dependent manner, NO has previously been shown to alter several microglial functions. NO promotes microglial motility towards an injury in vitro [Citation52] and in vivo [Citation49], potentially facilitating wound healing. NO also impacts phagocytosis capacity, but with conflicting findings in the literature. NO can induce suppression of phagocytosis in macrophages [Citation53] and BV2 cell microglia [Citation54] through altered actin dynamics [Citation53]. NO can also enhance phagocytosis in BV2 cell microglia [Citation39]. For example, addition of NO donors to culture media enhanced BV2 phagocytosis both under media conditions [Citation55] and in the presence of LPS [Citation39]. The LPS-induced increase in phagocytosis was blocked by co-treatment with a synthetic arginine analogue that inhibits NO synthesis [Citation56]. Microglia from iNos knockout mice display reduced phagocytosis capacity [Citation39]. The rules governing NO impacts on microglial phagocytosis might depend on the larger context of the immune response. For example, under pathological conditions, such as pathogen infection or injury, initial NO release would drive increases in microglial phagocytosis to facilitate pathogen and cellular debris removal, facilitating infection clearance and injury recovery. In the context of chronic inflammation such as in neurodegenerative disease, chronically high NO could repress phagocytosis. Later stages of disease progression in many neurodegenerative diseases actually show impaired microglial phagocytosis [Citation57]. Using NO inhibitors to target microglial inflammation has gained traction [Citation58] but will require careful consideration before clinical use.
Previous work in microglial cultures and in vivo has revealed conflicting results for how pan-Hdac inhibitors modulate microglial gene expression and inflammation. Even the same inhibitors have documented enhancing [Citation19–21] or suppressing [Citation22,Citation23] impacts on inflammatory gene expression. In our BV2 microglial cell system we observed only enhancements in gene expression with Hdac3 inhibition, suggesting that the previously observed enhancements using pan-Hdac inhibitors may have been driven by Hdac3 inhibition. In comparison, pan-Hdac inhibitor suppression of gene expression may be more strongly driven by impacts on Hdac1 or 2 as previously indicated by knockdown of Hdac1 or 2 blocking induction of inflammatory gene expression in BV2 cells [Citation22] and our findings with Romidepsin treatment. Given that SAHA targets Hdac1, 2 and 3 it is not surprising that its impacts on BV2 cell gene expression were often intermediate between those of Romidepsin and RGFP966. All three inhibitors significantly increased global levels of H3K27ac, suggesting that their unique impacts on gene expression are due to altered genomic localization of acetylation changes. We verified increased H3K27ac at promoters of several RGFP966 enhanced genes, but future sequencing-based work will be needed to examine histone acetylation changes across the genome for different Hdac inhibitors. Together, our work supports the need for additional studies that specifically target Hdac3 to promote the resolution of neuroinflammation for treating brain injury. Future work can expand this work into additional brain diseases such as Alzheimer’s disease where previous work has demonstrated that Class I Hdac inhibition can dampen neuroinflammation and improve behaviour [Citation59].
Hdac3 appears to be a critical regulator of inflammatory responses in multiple types of tissue resident macrophages. Loss of Hdac3 in lung macrophages or cultured bone marrow derived macrophages (BMDM) increases expression of genes that promote wound-healing [Citation60]. Similar to our findings in microglia, Hdac3 inhibition significantly increased baseline expression of genes that were normally decreased in expression by LPS stimulation in BMDM [Citation61]. Paradoxically, macrophage Hdac3 also promotes activation of inflammatory gene expression [Citation62,Citation63] through a non-canonical activating role via recruitment of activating transcription factor ATF2 [Citation63]. The activating role does not require Hdac3’s deacetylase activity, and consequently genetic deletion of Hdac3 results in loss of both the canonical transcriptional repression and the non-canonical transcriptional activating roles [Citation63]. In microglia, pharmacological inhibition of Hdac3 reduces neuroinflammation and promotes recovery from stroke [Citation27], injury [Citation28,Citation30] and depression [Citation26]. In spinal cord microglia, inhibition of Hdac3 after injury shifts gene expression responses towards proliferation, cytokine activity and synaptogenesis [Citation30]. These changes were non-overlapping with expression changes in spinal macrophages from the same animals [Citation30], indicating a distinct role for Hdac3 regulation of inflammatory gene expression in microglia. Furthermore, conditional deletion of Hdac3 in microglia facilitates recovery from traumatic brain injury by reducing microglial pro-inflammatory responses [Citation29]. Together, these findings support our work on Hdac3 regulation of microglial gene expression and suggest a role for both the enzymatic and non-enzymatic functions of Hdac3 in regulating microglial functions; however, future work will be required to parse these impacts on gene expression using conditional Hdac3 deletion models.
Hdac3 can also have indirect regulatory roles on microglial gene expression through deacetylation of a number of non-histone proteins. For example, Hdac3 can deacetylate both the Hats p300 [Citation64] and CBP [Citation65], inhibiting their Hat functions. Hdac3 can also deacetylate NF-kB subunit RelA, promoting its nuclear export and termination of NF-kB signalling [Citation66]. In a mouse model of stroke, RGFP966 reduced brain damaged and facilitated behavioural recovery by inhibition of the AIM2 inflammasome through enhanced acetylation of STAT1. This suggests that Hdac3 normally represses the AIM2 inflammasome through deacetylation of STAT1 [Citation27]. Similarly, in macrophages Hdac3 interacts with the transcription factor FOXK1 to regulate expression of STAT1 [Citation67]. Future work will be needed to evaluate these alternative protein targets of Hdac3 in microglial gene regulation and function.
One of the limitations of our study is that all experiments were performed in the BV2 microglial immortalized cell line. While in vitro studies provide a number of advantages for high throughput and controlled testing of gene expression mechanisms, in vitro regulation does not always recapitulate in vivo microglial regulation [Citation3,Citation68]. Henn et al. (2009) [Citation33] found that the majority of genes induced in BV2 cells by LPS treatment were also induced in primary microglia (90%) and freshly isolated hippocampal microglia (50%), although BV2 microglia gene expression changes were less pronounced than primary microglia. Given similar functional findings using RGFP966 in vivo and recent findings showing altered microglial responses in Hdac3 microglial conditional knockout mice [Citation26–30], our in vitro model captures fundamental gene regulation mechanisms and demonstrates how Hdac3 regulation of microglial gene expression leads to in vivo improvements in models with brain inflammation.
Conclusion
Together, our findings demonstrate an important role for Hdac3 as a negative regulator of the microglial gene expression response to LPS. Our epigenetic profiling indicates Hdac3 suppresses microglial gene expression through deacetylation of histone targets at the promoters of both classically pro- and anti-inflammatory genes. Inhibition of Hdac3 shifts the microglial LPS response towards enhanced phagocytosis and reduced NO release, potentially enhancing clearance of dead/dying cells during injury. Our findings support a model in which Hdac3 inhibition driven shifts in microglial gene expression and function ultimately conveys neuro-protection in brain disease.
Highlights
Inhibition of Hdac3 in microglia cells enhances global and gene-specific histone acetylation marks H3K27ac and H3K9ac
Inhibition of Hdac3 in microglia cells increases baseline and lipopolysaccharide-induced pro- and anti-inflammatory gene expression
Inhibition of Hdac3 enhances suppresses nitric oxide release, facilitating microglial phagocytosis
Author contributions
LM, MT and AVC conceived of the project and experimental design, analysed data and wrote the manuscript. MT performed gene expression, flow cytometry and NO experiments. VB, JK, VD and MR assisted with experiments and analysis. All authors contributed to the manuscript.
Supplemental Material
Download MS Excel (31.9 KB)Acknowledgments
Acknowledgements to Brian MacVicar for sharing NOS inhibitors and to the UBC flow cytometry core for equipment access.
Disclosure statement
No potential conflict of interest was reported by the author(s).
Data availability statement
All datasets are available as raw data upon request to the authors.
Supplementary material
Supplemental data for this article can be accessed online at https://doi.org/10.1080/15592294.2023.2241008.
Additional information
Funding
References
- Gosselin D, Skola D, Coufal NG, et al. An environment-dependent transcriptional network specifies human microglia identity. Science. 2017 Jun 23;356(6344):6344.
- Lavin Y, Winter D, Blecher-Gonen R, et al. Tissue-resident macrophage enhancer landscapes are shaped by the local microenvironment. Cell. 2014;159(6):1312–19. doi: 10.1016/j.cell.2014.11.018
- Gosselin D, Link VM, Romanoski CE, et al. Environment drives selection and function of enhancers controlling tissue-specific macrophage identities. Cell. 2014;159(6):1327–1340. doi: 10.1016/j.cell.2014.11.023
- Prinz M, Masuda T, Wheeler MA, et al. Microglia and central nervous system–associated macrophages—from origin to disease modulation. Annual Reviews. 2021;39:251–277. doi: 10.1146/annurev-immunol-093019-110159
- Guerreiro R, Wojtas A, Bras J, et al. TREM2 variants in alzheimer’s disease. N Engl J Med. 2013;368(2):117–127. doi: 10.1056/NEJMoa1211851
- Hollingworth P, Harold D, Sims R, et al. Common variants at ABCA7, MS4A6A/MS4A4E, EPHA1, CD33 and CD2AP are associated with Alzheimer’s disease. Nature Genetics Nature Publishing Group. 2011;43:429–436. doi:10.1038/ng.803
- Sims R, Badarinarayan N, Raybould R, et al. Rare coding variants in PLCG2, ABI3 and TREM2 implicate microglial-mediated innate immunity in Alzheimer’s disease. Nature Genet. 2017;49(9):1373–1384. doi: 10.1038/ng.3916
- Sekar A, Bialas AR, De Rivera H, et al. Schizophrenia risk from complex variation of complement component 4. Nature. 2016;530:177–183. doi: 10.1038/nature16549
- Park TJ, Kim HJ, Kim JH, et al. Associations of CD6, TNFRSF1A and IRF8 polymorphisms with risk of inflammatory demyelinating diseases. Neuropathol Appl Neurobiol. 2013;39(5):519–530. doi: 10.1111/j.1365-2990.2012.01304.x
- Leppä V, Surakka I, Tienari PJ, et al. The genetic association of variants in CD6, TNFRSF1A and IRF8 to multiple sclerosis: a multicenter case-control study. PLoS One. 2011;6(4):6. doi: 10.1371/journal.pone.0018813
- De Jager PL, Jia X, Wang J, et al. Meta-analysis of genome scans and replication identify CD6, IRF8 and TNFRSF1A as new multiple sclerosis susceptibility loci. Nature Genetics Nat Genet. 2009;41(7):776–782. doi: 10.1038/ng.401
- Hammond TR, Robinton D, Stevens B. Microglia and the brain: complementary partners in development and disease. Annu Rev Cell Dev Biol. 2018;34:523–544.
- Kaikkonen MU, Spann NJ, Heinz S, et al. Remodeling of the enhancer landscape during macrophage activation is coupled to enhancer transcription. Molecular Cell Elsevier Inc. 2013;51(3):310–325. doi: 10.1016/j.molcel.2013.07.010
- Bannister AJ, Kouzarides T. Regulation of chromatin by histone modifications. Cell Res. 2011;21(3):381–395. doi: 10.1038/cr.2011.22
- Vogel Ciernia A, LaSalle J. The landscape of DNA methylation amid a perfect storm of autism aetiologies. Nat Rev Neurosci. 2016;6(7):411–423. doi: 10.1038/nrn.2016.41
- Rowland ME, Jajarmi JM, Osborne TSM, et al. Insights into the emerging role of Baf53b in autism spectrum disorder. Front Mol Neurosci. 2022;15:805158. doi: 10.3389/fnmol.2022.805158
- Vogel-Ciernia A, Wood M. Molecular brake pad hypothesis: pulling off the brakes for emotional memory. Rev Neurosci. 2012;23(5–6):607–626. doi: 10.1515/revneuro-2012-0050
- Talbert PB, Henikoff S. The Yin and Yang of histone marks in transcription. Ann Rev Genomics Hum Genet. 2021;22(1):147–170. doi: 10.1146/annurev-genom-120220-085159
- Suuronen T, Huuskonen J, Pihlaja R, et al. Regulation of microglial inflammatory response by histone deacetylase inhibitors. J Neurochem. 2003;87(2):407–416. doi: 10.1046/j.1471-4159.2003.02004.x
- Huuskonen J, Suuronen T, Nuutinen T, et al. Regulation of microglial inflammatory response by sodium butyrate and short-chain fatty acids. Br J Pharmacol. 2004;141(5):874–880. doi: 10.1038/sj.bjp.0705682
- Singh V, Bhatia HS, Kumar A, et al. Histone deacetylase inhibitors valproic acid and sodium butyrate enhance prostaglandins release in lipopolysaccharide-activated primary microglia. Neuroscience. 2014;265:147–157. doi: 10.1016/j.neuroscience.2014.01.037
- Durham BS, Grigg R, Wood IC. Inhibition of histone deacetylase 1 or 2 reduces induced cytokine expression in microglia through a protein synthesis independent mechanism. J Neurochem. 2017;143(2):214–224. doi: 10.1111/jnc.14144
- Kannan V, Brouwer N, Hanisch UK, et al. Histone deacetylase inhibitors suppress immune activation in primary mouse microglia. Journal Of Neuroscience Research J Neurosci Res. 2013;91:1133–1142.
- Suh H-S, Choi S, Khattar P, et al. Histone deacetylase inhibitors suppress the expression of inflammatory and innate immune response genes in human microglia and astrocytes. J Neuroimmune Pharmacol. 2010;5(4):521–532. doi: 10.1007/s11481-010-9192-0
- Hsing CH, Hung SK, Chen YC, et al. Histone deacetylase inhibitor trichostatin a ameliorated endotoxin-induced neuroinflammation and cognitive dysfunction. 2015. doi: 10.1155/2015/163140
- Bian HT, Xiao L, Liang L, et al. RGFP966 is protective against lipopolysaccharide-induced depressive-like behaviors in mice by inhibiting neuroinflammation and microglial activation. Int Immunopharmacol. 2021;101:108259. Accessed December 2, 2021. online serial online serial. doi: 10.1016/j.intimp.2021.108259
- Zhang MJ, Zhao QC, Xia MX, et al. The HDAC3 inhibitor RGFP966 ameliorated ischemic brain damage by downregulating the AIM2 inflammasome. Faseb J. 2020;34(1):648–662. John Wiley and Sons Inc. doi: 10.1096/fj.201900394RRR
- Kuboyama T, Wahane S, Huang Y, et al. HDAC3 inhibition ameliorates spinal cord injury by immunomodulation. 2017;7:1–13. doi: 10.1038/s41598-017-08535-4
- Zhao Y, Mu H, Huang Y, et al. Microglia-specific deletion of histone deacetylase 3 promotes inflammation resolution, white matter integrity, and functional recovery in a mouse model of traumatic brain injury. J Neuroinflammation. 2022;19(1):201. doi: 10.1186/s12974-022-02563-2
- Wahane S, Zhou X, Zhou X, et al. Diversified transcriptional responses of myeloid and glial cells in spinal cord injury shaped by HDAC3 activity. Sci Adv. 2021;7(9):8811–8837. doi: 10.1126/sciadv.abd8811
- Mcquown SC, Wood MA. HDAC3 and the molecular brake pad hypothesis. Neurobiology of learning and memory. 2011;96:27–34. doi: 10.1016/j.nlm.2011.04.005
- Ishii S. The role of histone deacetylase 3 complex in nuclear hormone receptor action. Int J Mol Sci. 2021. [Accessed: 2021];22. doi: 10.3390/ijms22179138.
- Henn A, Lund S, Hedtjärn M, et al. The suitability of BV2 cells as alternative model system for primary microglia cultures or for animal experiments examining brain inflammation. ALTEX. 2009;26:83–94. doi: 10.14573/altex.2009.2.83
- Pollock TB, Cholico GN, Isho NF, et al. Transcriptome analyses in BV2 microglial cells following treatment with amino-terminal fragments of apolipoprotein E. Front Aging Neurosci. 2020;12:1–15. doi: 10.3389/fnagi.2020.00256
- Kacimi R, Giffard RG, Yenari MA. Endotoxin-activated microglia injure brain derived endothelial cells via NF-κB, JAK-STAT and JNK stress kinase pathways. J Inflamm. 2011;8(1):7. doi: 10.1186/1476-9255-8-7
- Marks PA. Discovery and development of SAHA as an anticancer agent. Oncogene. 2007;26(9):1351–1356. doi: 10.1038/sj.onc.1210204
- Malvaez M, McQuown SC, Rogge GA, et al. HDAC3-selective inhibitor enhances extinction of cocaine-seeking behavior in a persistent manner. Proceedings of the National Acadamy of Sciences of the United States of America. 2013;110:2647–2652. doi: 10.1073/pnas.121336411
- Furumai R, Matsuyama A, Kobashi N, et al. FK228 (depsipeptide) as a natural prodrug that inhibits class I histone deacetylases. Cancer Res. 2002;62(17):4916–4921.
- Maksoud MJE, Tellios V, An D, et al. Nitric oxide upregulates microglia phagocytosis and increases transient receptor potential vanilloid type 2 channel expression on the plasma membrane. Glia. 2019;67(12):2294–2311. doi: 10.1002/glia.23685
- Cherry JD, Olschowka JA, O’Banion MK. Neuroinflammation and M2 microglia: the good, the bad, and the inflamed. J Neuroinflammation. 2014;11(1):1–15. doi: 10.1186/1742-2094-11-98
- Yang Z, Ming XF. Functions of arginase isoforms in macrophage inflammatory responses: impact on cardiovascular diseases and metabolic disorders. Front Immunol. 2014;5:1–10. doi: 10.3389/fimmu.2014.00533
- Palmieri EM, McGinity C, Wink DA, et al. Nitric Oxide in macrophage immunometabolism: hiding in plain sight. Metabolites. 2020;10(11):429. doi: 10.3390/metabo10110429
- Schairer DO, Chouake JS, Nosanchuk JD, et al. The potential of nitric oxide releasing therapies as antimicrobial agents. Virulence. 2012;3:271–279.
- Figarella K, Uzcategui NL, Mogk S, et al. Morphological changes, nitric oxide production, and phagocytosis are triggered in vitro in microglia by bloodstream forms of Trypanosoma brucei. Sci Rep. 2018;8(1):15002. doi: 10.1038/s41598-018-33395-x
- Quintas C, Pinho D, Pereira C, et al. Microglia P2Y6 receptors mediate nitric oxide release and astrocyte apoptosis. J Neuroinflammation. 2014;11(1):141. doi: 10.1186/s12974-014-0141-3
- Arimoto T, Bing G. Up-regulation of inducible nitric oxide synthase in the substantia nigra by lipopolysaccharide causes microglial activation and neurodegeneration. Neurobiol Dis. 2003;12(1):35–45. doi: 10.1016/S0969-9961(02)00017-7
- Schell JB, Crane CA, Smith MF, et al. Differential ex vivo nitric oxide production by acutely isolated neonatal and adult microglia. J Neuroimmunol. 2007;189(1–2):75–87. doi: 10.1016/j.jneuroim.2007.07.004
- Collmann FM, Pijnenburg R, Hamzei-Taj S, et al. Individual in vivo profiles of microglia polarization after stroke, represented by the genes iNOS and Ym1. frontiers in immunology [online serial]. Front Immunol. 2019. [Accessed April 18, 2023]; 10. doi: 10.3389/fimmu.2019.01236
- Dibaj P, Nadrigny F, Steffens H, et al. NO mediates microglial response to acute spinal cord injury under ATP control in vivo. Glia. 2010;58(9):1133–1144. doi: 10.1002/glia.20993
- Yuste JE, Tarragon E, Campuzano CM, et al. Implications of glial nitric oxide in neurodegenerative diseases. Frontiers In Cellular Neuroscience [Online Serial]. 2015. [Accessed April 17, 2023];9. Accessed at https://www.frontiersin.org/articles/10.3389/fncel.2015.00322
- Cunningham C, Wilcockson DC, Campion S, et al. Central and systemic endotoxin challenges exacerbate the local inflammatory response and increase neuronal death during chronic neurodegeneration. J Neurosci. 2005;25(40):9275–9284. doi: 10.1523/JNEUROSCI.2614-05.2005
- Scheiblich H, Roloff F, Singh V, et al. Nitric oxide/cyclic GMP signaling regulates motility of a microglial cell line and primary microglia in vitro. Brain Res. 2014;1564:9–21. doi: 10.1016/j.brainres.2014.03.048
- Jun CD, Han MK, Kim UH, et al. Nitric oxide induces ADP-ribosylation of actin in murine macrophages: association with the inhibition of pseudopodia formation, phagocytic activity, and adherence on a laminin substratum. Cell Immunol. 1996;174(1):25–34. doi: 10.1006/cimm.1996.0290
- Kopec KK, Carroll RT. Phagocytosis is regulated by nitric oxide in murine microglia. Nitric Oxide. 2000;4(2):103–111. doi: 10.1006/niox.2000.0280
- Kakita H, Aoyama M, Nagaya Y, et al. Diclofenac enhances proinflammatory cytokine-induced phagocytosis of cultured microglia via nitric oxide production. Toxicol Appl Pharmacol. 2013;268(2):99–105. doi: 10.1016/j.taap.2013.01.024
- Scheiblich H, Bicker G. Nitric oxide regulates antagonistically phagocytic and neurite outgrowth inhibiting capacities of microglia. Devel Neurobio. 2016;76(5):566–584. doi: 10.1002/dneu.22333
- Fu R, Shen Q, Xu P, et al. Phagocytosis of microglia in the central nervous system diseases. Mol Neurobiol. 2014;49(3):1422–1434. doi: 10.1007/s12035-013-8620-6
- Jordan P, Costa A, Specker E, et al. Small molecule inhibiting microglial nitric oxide release could become apotential treatment for neuroinflammation. PLOS ONE. 2023;18:e0278325. doi: 10.1371/journal.pone.0278325
- Zhang Z-Y, Schluesener HJ. Oral Administration of histone deacetylase inhibitor MS-275 ameliorates neuroinflammation and cerebral amyloidosis and improves behavior in a mouse model. J Neuropathol Exp Neurol. 2013;72(3):178–185. doi: 10.1097/NEN.0b013e318283114a
- Mullican SE, Gaddis CA, Alenghat T, et al. Histone deacetylase 3 is an epigenomic brake in macrophage alternative activation. Genes Dev. 2011;25(23):2480–2488. doi: 10.1101/gad.175950.111
- Ghiboub M, Zhao J, Li Yim AYF, et al. HDAC3 mediates the inflammatory response and LPS tolerance in human monocytes and macrophages. Front Immunol. 2020;11:2608. doi:10.3389/fimmu.2020.550769
- Chen X, Barozzi I, Termanini A, et al. Requirement for the histone deacetylase Hdac3 for the inflammatory gene expression program in macrophages. PNAS. 2012;109:E2865–E2874. doi: 10.1073/pnas.1121131109
- Nguyen HCB, Adlanmerini M, Hauck AK, et al. Dichotomous engagement of HDAC3 activity governs inflammatory responses. Nature Research. 2020;584(7820):286–290. doi: 10.1038/s41586-020-2576-2
- Grégoire S, Xiao L, Nie J, et al. Histone deacetylase 3 interacts with and deacetylates myocyte enhancer factor 2. molecular and cellular biology. Mol Cell Biol. 2007;27(4):1280–1295. doi: 10.1128/MCB.00882-06
- Chuang HC, Chang CW, Chang GD, et al. Histone deacetylase 3 binds to and regulates the GCMa transcription factor. Nucleic Acids Research. 2006;34:1459. doi: 10.1093/nar/gkl048
- Chen LF, Fischle W, Verdin E, et al. Duration of nuclear NF-κB action regulated by reversible acetylation. Sci. 2001;293(5535):1653–1657. doi: 10.1126/science.1062374
- Yang L, Chen S, Zhao Q, et al. Histone deacetylase 3 contributes to the antiviral innate immunity of macrophages by interacting with FOXK1 to regulate STAT1/2 transcription. Cell Rep. 2022;38(4):110302. doi: 10.1016/j.celrep.2022.110302
- Bennett FC, Bennett ML, Yaqoob F, et al. A combination of ontogeny and CNS environment establishes microglial identity. Neuron. 2018;98(6):1170–1183.e8. doi: 10.1016/j.neuron.2018.05.014