
ABSTRACT
Long noncoding RNAs (lncRNAs) regulate the progression of type 2 diabetes mellitus complicated with obstructive sleep apnoea (T2DM-OSA). However, the role of the lncRNA nuclear paraspeckle assembly transcript 1 (NEAT1) in T2DM-OSA remains unknown. This study aimed to reveal the function of NEAT1 in T2DM-OSA and the underlying mechanism. KKAy mice were exposed to intermittent hypoxia (IH) or intermittent normoxia to generate a T2DM-OSA mouse model. HMEC-1 cells were treated with high glucose (HG) and IH to construct a T2DM-OSA cell model. RNA expression was detected by qRT-PCR. The protein expression of Apelin, NF-E2-related factor 2 (Nrf2), haem oxygenase-1 (HO-1), and up-frameshift suppressor 1 (UPF1) was assessed using western blot. Cell injury was evaluated using flow cytometry, enzyme-linked immunosorbent assay, and oxidative stress kit assays. RIP, RNA pull-down, and actinomycin D assays were performed to determine the associations between NEAT1, UPF1, and Apelin. NEAT1 expression was upregulated in the aortic vascular tissues of mice with T2DM exposed to IH and HMEC-1 cells stimulated with HG and IH, whereas Apelin expression was downregulated. The absence of NEAT1 protected HMEC-1 cells from HG- and IH-induced damage. Furthermore, NEAT1 destabilized Apelin mRNA by recruiting UPF1. Apelin overexpression decreased HG- and IH-induced injury to HMEC-1 cells by activating the Nrf2/HO-1 pathway. Moreover, NEAT1 knockdown reduced HG- and IH-induced injury to HMEC-1 cells through Apelin. NEAT1 silencing reduced HMEC-1 cell injury through the Apelin/Nrf2/HO-1 signalling pathway in T2DM-OSA.
Abbreviations: LncRNAs, long non-coding RNAs; T2DM, type 2 diabetes mellitus; OSA, obstructive sleep apnoea; NEAT1, nuclear paraspeckle assembly transcript 1; IH, intermittent hypoxia; HMEC-1, human microvascular endothelial cells; HG, high glucose; Nrf2, NF-E2-related factor 2; UPF1, up-frameshift suppressor 1; HO-1, haem oxygenase-1; qRT-PCR, quantitative real-time polymerase chain reaction; ELISA, enzyme-linked immunosorbent assay; GAPDH, glyceraldehyde 3-phosphate dehydrogenase; TNF-α, tumour necrosis factor-α; CCK-8, Cell Counting Kit-8; IL-1β, interleukin-1β; ROS, reactive oxygen species; MDA, malondialdehyde; SOD, superoxide dismutase; RIP, RNA immunoprecipitation; SD, standard deviations; GSH, glutathione; AIS, acute ischaemic stroke; HMGB1, high mobility group box-1 protein; TLR4, toll-like receptor 4.
Introduction
Type 2 diabetes mellitus (T2DM), which seriously threatens human health, is a class of chronic disorders and accounts for approximately 80% of patients with diabetes mellitus, characterized by an increased blood glucose level [Citation1,Citation2]. Obstructive sleep apnoea (OSA) is a comorbidity of T2DM and accompanied by intermittent hypoxia (IH) and sleep fragmentation [Citation3]. Although current treatment strategies, including roux-en-Y gastric bypass surgery, can treat T2DM complicated with OSA (T2DM-OSA), the incidence of T2DM-OSA remains high owing to the increasing incidence of T2DM [Citation4,Citation5]. T2DM-OSA can cause peripheral vascular diseases due to blood-borne factors not reaching the affected tissues, and vascular endothelial dysfunction is common [Citation6,Citation7]. Long-term hyperglycaemia, inflammation, and oxidative stress are precursors of vascular endothelial cell injury in diabetes mellitus [Citation8]. Thus, understanding the molecular mechanism of vascular endothelial cell inflammation and oxidative stress in T2DM-OSA may be necessary to develop effective treatment strategies.
Long noncoding RNAs (lncRNAs) are large RNA transcripts (>200 nt in length). LncRNAs cannot encode proteins but can mediate gene production through their association with DNA or chromatin regulators in the nucleus [Citation9]. Meanwhile, in the cytoplasm, lncRNAs modulate gene expression by competing with microRNAs [Citation10]. Furthermore, lncRNAs posttranscriptionally affect gene expression by binding to RNA-binding proteins, which can modulate target mRNA expression and stability [Citation11]. Considerable evidence has indicated that lncRNAs participate in physiological and pathological cell activities [Citation12]. Some studies have also reported that lncRNAs, such as prostaglandin-endoperoxide synthase 2 and metastasis-associated lung adenocarcinoma transcript 1 (MALAT1), were associated with the pathogenesis of T2DM or T2DM-OSA [Citation13,Citation14]. Another lncRNA, nuclear paraspeckle assembly transcript 1 (NEAT1), is highly expressed in patients with T2DM [Citation15]; however, its regulatory role in T2DM, particularly in T2DM-OSA, remains to be explored.
Apelin is an adipokine that contains a ligand for the angiotensin-like receptor 1 (APJ), regulating blood pressure and neovascularization [Citation16,Citation17]. Apelin exists in tissues in various molecular isomers and is required for regulating oxidative stress and angiogenesis [Citation18]. Increasing data have revealed that Apelin modulates insulin sensitivity and glucose usage and participates in the regulation of diabetic complications by binding to APJ receptors [Citation19,Citation20]. Furthermore, decreased serum levels of Apelin may participate in the regulation of mild cognitive impairment in patients with T2DM [Citation21]. However, data regarding the molecular mechanism of Apelin in T2DM or T2DM-OSA are lacking. Through the prediction of the starBase database, we found that NEAT1 and Apelin contained up-frameshift suppressor 1 (UPF1)-binding sites. Therefore, we speculate that NEAT1 can cause Apelin mRNA instability by binding to UPF1, thus regulating downstream signalling pathways to affect the progression of T2DM-OSA.
This study analysed the role and the underlying mechanisms of NEAT1 in T2DM-OSA using a T2DM-OSA mouse model and a T2DM-OSA cell model. Given the association of Apelin with the NF-E2-related factor 2 (Nrf2) signalling pathway in the development of diabetes mellitus [Citation22], we hypothesized that NEAT1 modulates vascular endothelial cell injury by inhibiting the Apelin/Nrf2/haem oxygenase-1 (HO-1) signalling pathway in T2DM-OSA, which was validated in this study. The results of this study may shed new light on the treatment of T2DM-OSA.
Materials and methods
Animals and exposures
The animal research programme was approved by the Animal Care and Use Committee of Hunan Provincial People’s Hospital. Beijing HFK Biotechnology Co., Ltd. (Beijing China) provided 12-week-old T2DM animal model KKAy mice (male; weight 36–39 g), and these mice were placed in a specific-pathogen-free room. The mice were randomly assigned to two groups: the T2DM group (control group, n = 6) and the T2DM + IH group (TADM-OSA group, n = 6). The mice in the T2DM group were treated with normoxic air with 21% O2 concentration for 4 weeks. For the intermittent hypoxic treatment in the T2DM + IH group, 5% and 21% concentrations of O2 were used, and IH exposure lasted for 8 h every day for 28 days. O2 concentration was reduced to 5% for 0.5 min and then restored to peak concentration for 1.5 min in each IH exposure cycle. Moreover, the circulation rates for IH exposure in the two groups were 30 cycles/h. At the end of exposure, the mice were treated with xylazine (10 mg/kg; Amgicam, Shanghai, China) and then euthanized by cervical dislocation. Whole aortic vascular tissues and serum were collected from these mice for subsequent analyses. The fasting blood glucose of each mouse was measured using a glucose metre (Roche, Basel, Switzerland).
Cell culture and treatment
Human microvascular endothelial cells (HMEC-1) (ATCC, Manassas, VA, USA) were cultured in complete growth medium (HMEC-1 cell-specific medium; Procell, Wuhan, Hubei, China) at 37°C with 5% CO2. We performed the protocols for IH and high glucose (HG) treatment as previously described [Citation23]. Briefly, HMEC-1 cells were maintained in Petri dishes (6/12/24-well plates) and treated with 25 mM or 50 mM glucose (HG) for 16 h. Subsequently, one group of HG-induced cells and a group of 25 mM glucose-induced cells were stimulated with IH (1.5% of O2 for 30 s and 21% of O2 for 1.5 min) for 8 h, named the HG and IH induction (HG + IH group) and IH groups. The remaining cells were cultured in intermittent normoxic air (21% of O2) for 8 h, named the HG and control groups.
Cell transfection
Small hairpin RNA of NEAT1 (sh-NEAT1), UPF1 overexpression plasmid (oe-UPF1), Apelin overexpression plasmid (oe-Apelin), small interfering RNA of Apelin (si-Apelin), and the matched negative controls, including sh-NC, oe-NC, and si-NC, were provided by Ribobio Co., Ltd. (Guangzhou, Guangdong, China). HMEC-1 cells were maintained in Petri dishes (6/12/24-well plates) and allowed to grow to 75% confluence in a 5% CO2 incubator. The aforementioned plasmids or oligonucleotides were mixed with Opti-MEM and then transfected into cells according to the manufacturer’s instructions for Lipofectamine 2000 (Invitrogen, Carlsbad, CA, USA). After 6 h, the transfected cells were maintained in HG medium and exposed to IH for 8 h for subsequent assays.
Quantitative real-time polymerase chain reaction (qRT-PCR)
Mouse aortic vascular tissues and HMEC-1 cells were treated with TRIzol reagent (Sangon Biotech, Shanghai, China) for RNA isolation. RNA concentration was quantified using a trace nucleic acid protein analyser (Thermo-Fisher Scientific, Waltham, MA, USA). Specific cDNA synthesis kits (#KR116; Tiangen, Beijing, China) were used for reverse transcription. The diluted complementary DNA product was measured according to the guidebook of SYBR Green master mix (Thermo-Fisher Scientific). The expression of NEAT1 and Apelin was analysed using the 2−∆∆Ct method with normalization to glyceraldehyde 3-phosphate dehydrogenase (GAPDH). Primers were synthesized by Tsingke (Beijing, China). Forward (F) and reverse (R) primers are shown below. H-NEAT1-F 5′-GTGGCTGTTGGAGTCGGTAT-′ and H-NEAT1-R 5′-TAACAAACCACGGTCCATGA-3,’ M-NEAT1-F 5′-GGGGCCACATTAATCACAAC-3′ and M-NEAT1-R 5′-CAGGGTGTCCTCCACCTTA-3′, H-Apelin-F 5’-CTGCTCTGGCTCTCCTTGAC-3′ and H-Apelin-R 5′-GAAAGGCATGGGTCCCTTAT-3′, M-Apelin-F 5′-GCATGAATCTGAGGCTCTGC-3′ and M-Apelin-R 5’-CTGGTCCAGTCCTCGAAGTT-3′, H-GAPDH-F 5′-CCAGGTGGTCTCCTCTGA-3′
and H-GAPDH-R 5′-GCTGTAGCCAAATCGTTGT-3′, and M-GAPDH-F 5′-AGCCCAAGATGCCCTTCAGT-3′ and M-GAPDH-R 5′-CCGTGTTCCTACCCCCAATG-3′.
Western blot assay
Mouse aortic vascular tissue and HMEC-1 cell lysates were prepared using NP-40 buffer (Beyotime, Shanghai, China). Proteins (20 μg) quantified using the standard curve method were subjected to bis-tris-acrylamide gel electrophoresis and membrane transfer. The nitrocellulose membranes (Roche) were blocked with defatted milk in a cold atmosphere and then interacted with primary antibodies against Apelin (PA5–114860; 1:500; Thermo-Fisher Scientific), Nrf2 (PA5–88084; 1:2000; Thermo-Fisher Scientific), UPF1 (PA5–54031; 1:1,000; Thermo-Fisher Scientific), HO-1 (PA5–119658; 1:1,000; Thermo-Fisher) and GAPDH (regarded as a reference) (PA1–987; 1:5,000; Thermo-Fisher Scientific), followed by secondary antibody (ab205718; 1:5,000; Abcam, Cambridge, UK) incubation. The images of blots were obtained using an ECL system (UVP, Upland, CA, USA).
Enzyme-linked immunosorbent assay (ELISA)
Tumour necrosis factor-alpha (TNF-α), interleukin (IL)-1β, IL-6, and IL-8 levels in HMEC-1 cell supernatants and mouse serums were measured using human or mouse ELISA kits (TNF-α, #PT518 and #PT512; IL-1β, #PI305 and #PI301; IL-6, #PI330 and #PI326; and IL-8, #PI640; Beyotime). A mouse IL-8 ELISA kit (#EM1592) was provided by Wuhan Fine Biotech Co., Ltd. (Wuhan, Hubei, China). HMEC-1 cell supernatants and mouse serum were seeded in test sample wells with captured antibodies. After incubation at 37°C for a defined time, the captured antibody-bound cytokines were analysed using biotin-labelled primary antibodies. Then, each well was added with horseradish peroxidase-conjugated conjugate, 3,3′,5,5′-tetramethylbenzidine substrate, and stop solution. The reaction plates were read using a microplate reader (Thermo-Fisher Scientific) at 450 nm.
Cell viability analysis
Cell viability assay was performed following the suggestion of the producers of the Cell Counting Kit-8 (#C0038; CCK-8, Beyotime). Briefly, HMEC-1 cells with various treatments in 96-well plates were incubated with 10 μL of CCK-8 reagent. After 4 h, a microplate reader (Thermo-Fisher Scientific) was used to read the reaction plates at 450 nm.
Cell apoptosis detection
The Annexin V-FITC Apoptosis Detection Kit (#CA1020, Solarbio, Beijing, China) was used to measure the HMEC-1 cell apoptotic rate after various treatments. HMEC-1 cells were centrifuged at 200 rpm for 8 min and suspended in deionized water-diluted binding buffer. Subsequently, the cells were incubated with Annexin V-fluorescein isothiocyanate and propidium iodide under light-devoid conditions. After 5 min, cell apoptosis was assessed using a flow cytometer (Thermo-Fisher Scientific).
Reactive oxygen species (ROS) detection
HMEC-1 cells with various treatments were washed using buffer when achieving an appropriate density following the guidebook of Cellular ROS assay kit (#ab113851; Abcam). The cells were then stained with 2′,7′-dichlorodi-hydrofluorescein diacetate solution for 45 min in darkness. After washing with buffer, the samples were subjected to fluorescent microscopy (Thermo-Fisher Scientific).
Malondialdehyde (MDA) assay
HMEC-1 cells were harvested after various treatments and subjected to lysate using MDA Lysis Buffer based on the procedures of the lipid peroxidation MDA assay kit (#ab118970; Abcam). The cells were then homogenized and centrifuged at 12,000 rpm. After 10 min, the TBA reagent was added to each well and incubated at 95°C for 1 h. The reaction wells at 450 nm were finally read using a microplate reader (Thermo-Fisher Scientific).
Superoxide dismutase (SOD) activity analysis
HMEC-1 cells and aortic vascular tissues were lysed by adding Tris/HCl, according to the guidebook of the SOD activity detection kit (#ab65354; Abcam). The samples were then centrifuged, and the supernatant was transferred to clean tubes. Various components, including 2-(4-Iodophenyl)-3-(4-nitrophenyl)-5-(2,4-disulfophenyl)-2 H-tetrazolium, monosodium salt (WST) working solution, and Enzyme Working Solution, were added to test wells. The reaction wells at 450 nm were finally read using a microplate reader (Thermo-Fisher Scientific).
Glutathione (GSH) detection assay
The GSH Assay Kit (#ab239727; Abcam) was used to analyse GSH production in HMEC-1 cells and aortic vascular tissues. Briefly, pelleted cells and homogenized tissues with SSA solution were maintained on ice and then centrifuged at 12,000 rpm for 20 min. The samples were transferred to new tubes and diluted using GSH assay buffer. The reaction wells were finally measured in a kinetic mode using a microplate reader (Thermo-Fisher Scientific).
RNA immunoprecipitation (RIP)
The associations between NEAT1, Apelin, and UPF1 were identified based on the manufacturer’s recommendations of the Magna RNA immunoprecipitation kit (#17–700; Millipore, Billerica, MA, USA). Magnetic beads (Millipore) were conjugated with anti-IgG (#2729; CST, Shanghai, China) or anti-UPF1 (#9435; CST) in advance. HMEC-1 cells were lysed with complete RIP lysis buffer and incubated with magnetic bead antibody complex at 4°C overnight. RNA was purified from the complex and reverse transcribed to cDNA. Then, the expression of NEAT1 and Apelin was determined using qRT-PCR.
RNA pull-down assay
Biotin-labelled NEAT1 and Apelin (sense and antisense) were synthesized by Sangon Biotech. The assay was performed using Biotin RNA Labeling Mix (Roche). Briefly, HMEC-1 cell lysates were prepared using RIP lysis buffer and then incubated with biotinylated NEAT1 or Apelin. The probe complexes were targeted using streptavidin beads (Sigma, Louis, MO, USA). Specific bands were identified by western bolt with the use of anti-UPF1 (#9435; CST) and ImageJ software.
Actinomycin D treatment assay
HMEC-1 cells were transfected with sh-NC, sh-NEAT1, and oe-UPF1 alone or jointly, according to the aforementioned method. After 48 h, actinomycin D (Rechemscience, Shanghai, China) was added to each well, lasting 0, 3, 6, 9, and 12 h. Finally, the cells were harvested for qRT-PCR of Apelin expression.
Statistical analysis
The data were analysed using GraphPad Prism (GraphPad Software, La Jolla, CA, USA) and are presented as means ± standard deviations. All assays were performed in triplicate. The Wilcoxon – Mann–Whitney test or Student’s t-test was used to compare the data between the two groups. Analysis of variance with Tukey’s test was used for significant difference analysis among three or more groups. P-values <0.05 were used to indicate statistical significance.
Results
NEAT1 expression was upregulated and apelin expression was downregulated in the aortic vascular tissues of mice with T2DM exposed to IH
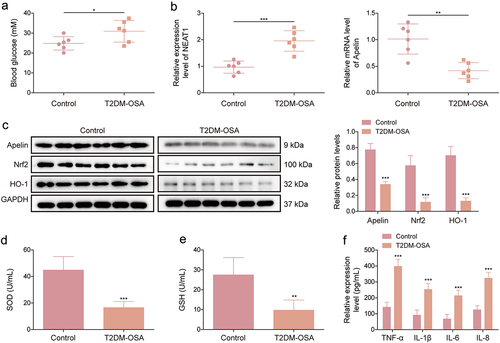
The study first detected the glucose levels in mice with T2DM exposed to IH (T2DM-OSA). The results showed that the glucose level was higher in mice with T2DM-OSA than in mice with T2DM (). NEAT1 expression level was increased and Apelin, Nrf2, and HO-1 expression levels were decreased in the aortic vascular tissues of the T2DM-OSA group compared with those in the control group (). As shown in , SOD and GSH activities were inhibited in the aortic vascular tissues of the T2DM-OSA group compared with those in the aortic vascular tissues of the control group. Furthermore, we analysed the levels of TNF-α, IL-6, IL-1β, and IL-8 in the serum of each mouse using ELISA, and the results revealed that their levels were significantly elevated in the T2DM-OSA group compared with those in the control group (). These data suggested that the T2DM-OSA mouse model was successfully built and that NEAT1 and Apelin were dysregulated in mice with T2DM-OSA.
Figure 1. NEAT1 and Apelin are dysregulated in mice with T2DM exposed to IH. KKAy mice were divided into the T2DM + IH group (mice exposed to intermittent hypoxia) and the T2DM group (mice exposed to intermittent normoxic air). (a) fasting blood glucose was measured using a glucose meter in each mouse. (b) qRT-PCR was performed to detect NEAT1 and Apelin expression in the aortic vascular tissues of each mouse. (c) protein expression levels of Apelin, Nrf2, and HO-1 were examined using western blot in the aortic vascular tissues of each mouse. (d and e) SOD activity and GSH production were assessed using commercial assay kits in the aortic vascular tissues of each mouse. (f) ELISA was performed to analyze the levels of TNF-α, IL-6, IL-1β, and IL-8 in the serum of each mouse. **p < 0.01, ***p < 0.001.
NEAT1 expression was significantly increased and apelin expression was decreased in HMEC-1 cells exposed to HG and IH
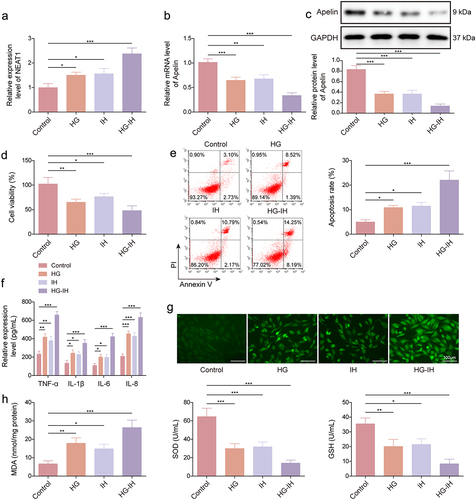
We then developed a T2DM-OSA cell model by exposing HMEC-1 cells to HG and IH, and the expression of NEAT1 and Apelin was analysed in the cell model. The results showed that treatment with HG and/or IH, particularly their combination, upregulated the expression of NEAT1 (). We observed a decrease in Apelin expression in both the HG and IH groups compared with that in the control group. Notably, the HG + IH group exhibited the most significant decrease (). Furthermore, the results of the CCK-8 assay indicate that the viability of HMEC-1 cells was lower in both the HG and IH groups than in the control group. Interestingly, cell vitality in the HG + IH group was the lowest among all groups (). As shown in , apoptosis of HMEC-1 cells and the serum levels of TNF-α, IL-6, IL-1β, and IL-8 were increased after stimulation using HG or IH, and the increases were most significant after the combined stimulation of HG and IH. Furthermore, HG or IH treatment increased ROS and MDA levels and inhibited SOD activity and GSH production in HMEC-1 cells, and the combination treatment of HG and IH yielded the most obvious changes (). Thus, a T2DM-OSA cell model was successfully developed. Moreover, the combination of HG and IH dramatically increased NEAT1 expression and decreased Apelin expression in HMEC-1 cells.
Figure 2. The combination of HG and IH dramatically increased NEAT1 expression and decreased Apelin expression in HMEC-1 cells. HMEC-1 cells were divided into the control, HG, IH, and HG + IH groups. The RNA expression of NEAT1 and Apelin was analysed using qRT-PCR (a and b). Apelin protein expression was analysed using western blot (c). Cell viability was analysed using CCK-8 assay (d). Cell apoptosis was analysed using flow cytometry (e). TNF-α, IL-1β, IL-6, and IL-8 levels were analysed using ELISA (f). (g) the Cellular ROS assay kit was used to analyze ROS levels. (h) the lipid peroxidation MDA, superoxide dismutase activity, and GSH assay kits were used to detect MDA levels, SOD activity, and GSH production, respectively. *p < 0.05, **p < 0.01, ***p < 0.001.
NEAT1 silencing attenuated HG- and IH-induced HMEC-1 cell injury
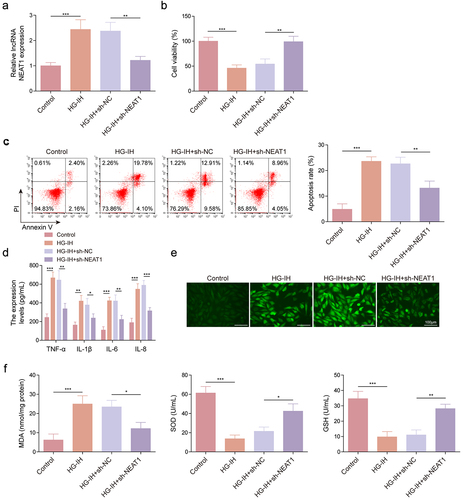
We analysed the effects of NEAT1 knockdown on HG- and IH-induced HMEC-1 cell damage. As shown in , HG and IH treatment increased NEAT1 expression, whereas the effect was relieved after NEAT1 knockdown. Subsequently, we found that HG and IH stimulation-induced cell viability inhibition and cell apoptosis promotion were rescued when NEAT1 expression was decreased (). Consistently, the promoting effects of HG and IH treatment on the serum levels of TNF-α, IL-6, IL-1β, and IL-8 were restored by decreasing NEAT1 expression (). The results of reveal that the combination of HG and IH promoted ROS and MDA production and inhibited SOD activity and GSH level; however, these effects were counteracted when NEAT1 expression was inhibited. Therefore, the aforementioned findings suggested that NEAT1 knockdown protected HMEC-1 cells from HG- and IH-induced damage.
Figure 3. NEAT1 knockdown protected HMEC-1 cells from HG- and IH-induced damage. HMEC-1 cells were divided into the control, HG-IH, HG-IH + sh-NC, and HG-IH + sh-NEAT1 groups. NEAT1 expression was analysed using qRT-PCR (a). Cell viability was analysed using CCK-8 assay (b). Cell apoptosis was investigated using flow cytometry (c). TNF-α, IL-1β, IL-6, and IL-8 levels were detected using ELISA (d). ROS level, MDA level, SOD activity, and GSH production were assessed using commercial assay kits (e and f). *p < 0.05, **p < 0.01, ***p < 0.001.
NEAT1 destabilized apelin mRNA by recruiting UPF1
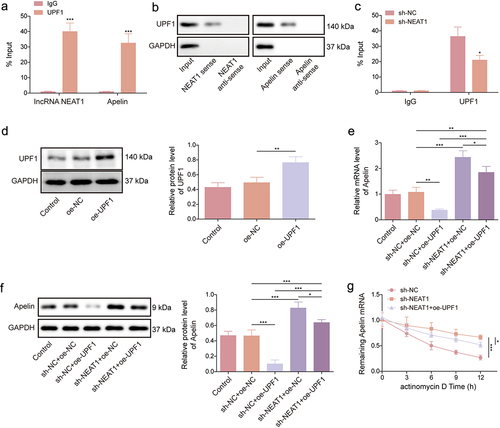
The binding sites of UPF1 for NEAT1/Apelin are shown in Figures S1A and S1B. According to the RIP assay results, the UPF1 antibody significantly enriched NEAT1 and Apelin compared with the IgG antibody (). Moreover, we performed an RNA pull-down assay using synthesized NEAT1 and Apelin probes (both sense and antisense). The results revealed that UPF1 production was higher in the NEAT1 and Apelin sense probe group than in the antisense probe group (). To further investigate the relationships between NEAT1, UPF1, and Apelin, we knocked down NEAT1 expression in HMEC-1 cells and performed a RIP assay. Interestingly, the enrichment of UPF1 antibody to Apelin was significantly reduced after NEAT1 knockdown (). As shown in , UPF1 protein expression was significantly upregulated after transfection with the UPF1 overexpression plasmid. Moreover, UPF1 overexpression significantly reduced the mRNA and protein expression levels of Apelin in the presence of NEAT1; after NEAT1 knockdown, the regulatory effect of UPF1 overexpression on the mRNA and protein expression levels of Apelin was weakened (). Furthermore, the degradation of Apelin mRNA was slowed down after NEAT1 knockdown; however, this effect was partially restored when UPF1 expression was increased (). Taken together, the aforementioned data indicated that NEAT1 destabilized Apelin mRNA by recruiting UPF1.
Figure 4. NEAT1 destabilized Apelin mRNA by recruiting UPF1. (a – c) RIP and RNA pull-down assays were performed to identify the associations between NEAT1, UPF1, and Apelin in HMEC-1 cells. (d) the efficiency of UPF1 overexpression was analyzed using western blot. (e and f) the effects of NEAT1 knockdown and UPF1 overexpression on Apelin expression in HMEC-1 cells were determined using qRT-PCR and western blot assays. (g) actinomycin D assay was performed to investigate the effects of NEAT1 knockdown and UPF1 overexpression on Apelin mRNA degradation. *p < 0.05, **p < 0.01, ***p < 0.001.
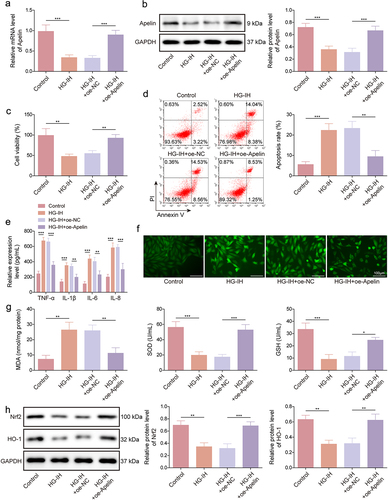
Apelin overexpression reduced HG- and IH-induced HMEC-1 cell damage by activating the Nrf2/HO-1 signaling pathway
We further assessed the effects of ectopic Apelin expression on HG- and IH-induced HMEC-1 cell damage and the underlying mechanism. HG and IH treatment decreased Apelin mRNA and protein expression levels, whereas these effects were restored by the upregulation of Apelin expression (). Furthermore, HG and IH stimulation-induced cell viability inhibition and cell apoptosis promotion were relieved when Apelin expression was upregulated (). The promoting effects of HG and IH treatment on TNF-α, IL-1β, IL-6, and IL-8 production were also counteracted by upregulating Apelin expression (). Moreover, HG and IH stimulation promoted ROS and MDA production and inhibited SOD activity and GSH level; however, these effects were restored when Apelin expression was increased (). Furthermore, HG- and IH-treated HMEC-1 cells showed decreased Nrf2 and HO-1 protein expression; however, the HG- and IH-induced effects were relieved after Apelin introduction (). Therefore, these data demonstrated that Apelin overexpression protected against HG- and IH-induced HMEC-1 cell injury by activating the Nrf2/HO-1 signalling pathway.
Figure 5. Apelin overexpression protected against HG- and IH-induced HMEC-1 cell injury by activating the Nrf2/HO-1 signalling pathway. HMEC-1 cells were divided into the control, HG-IH, HG-IH + oe-NC, and HG-IH + oe-Apelin groups. Apelin expression was analysed using qRT-PCR and western blot (a and g). Cell viability was detected using CCK-8 assay (c). Cell apoptosis was analysed using flow cytometry (d). TNF-α, IL-1β, IL-6, and IL-8 levels were analysed using ELISA (e). ROS level, MDA level, SOD activity, and GSH production were assessed using commercial assay kits (f and g). Nrf2 and HO-1 protein expression was detected using western blot (h). *p < 0.05, **p < 0.01, ***p < 0.001.
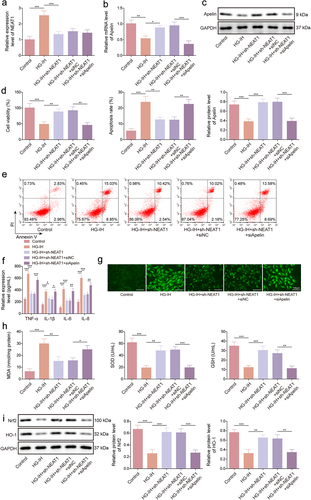
NEAT1 silencing decreased HG- and IH-induced HMEC-1 cell injury by regulating apelin
Considering the aforementioned results, we further validated whether the regulation of NEAT1 in HG- and IH-induced HMEC-1 cell injury involved Apelin. The data first showed that the inhibitory effect of NEAT1 silencing on HG- and IH-induced NEAT1 expression promotion was not affected by a decrease in Apelin expression (). However, the promoting effect of NEAT1 knockdown on Apelin expression in HG- and IH-induced HMEC-1 cells was relieved by decreasing Apelin expression (). Subsequently, HG- and IH-induced inhibition of cell viability and promotion of cell apoptosis and TNF-α, IL-1β, IL-6, and IL-8 production were restored after NEAT1 knockdown; however, these effects were overturned when Apelin expression was downregulated (). Consistently, decreasing NEAT1 expression relieved HG- and IH-induced effects on ROS level, MDA level, SOD activity, and GSH production; however, these effects were rescued after transfection with si-Apelin (). Moreover, HG- and IH-induced decreases in Nrf2 and HO-1 protein expression levels were remitted when NEAT1 expression was inhibited, whereas these results were relieved by the downregulation of Apelin expression (). Taken together, NEAT1 silencing protected against HG- and IH-induced HMEC-1 cell injury by modulating Apelin.
Figure 6. NEAT1 silencing protected against HG- and IH-induced HMEC-1 cell injury by modulating Apelin. HMEC-1 cells were divided into the control, HG-IH, HG-IH + sh-NEAT1, HG-IH + sh-NEAT1 + si-NC, and HG-IH + sh-NEAT1 + si-Apelin groups. NEAT1 expression was assessed using qRT-PCR (a). Apelin expression was detected using qRT-PCR and western blot (b and c). Cell viability was analysed using CCK-8 assay (d). Cell apoptosis was analysed using flow cytometry (e). TNF-α, IL-1β, IL-6, and IL-8 levels were detected using ELISA (f). ROS level, MDA level, SOD activity, and GSH production were assessed using commercial assay kits (g and h). Nrf2 and HO-1 protein expression was detected using western blot (i). *p < 0.05, **p < 0.01, ***p < 0.001.
Discussion
LncRNAs not only participate in tumour development but also affect metabolism-related disease occurrence. Considerable evidence has shown that lncRNAs may be involved in the development of T2DM and OSA [Citation24,Citation25]. For example, MALAT1 was upregulated in brain tissues of individuals with T2DM-OSA, and its knockdown inhibited the hippocampal inflammatory response in T2DM-OSA [Citation14]. NEAT1, a member of the lncRNA family, is closely correlated with T2DM progression and impacts T2DM prognosis [Citation26]. A study revealed that NEAT1 promoted diabetic retinopathy progression [Citation27]. Another study indicated the involvement of NEAT1 in OSA-related hypertension [Citation28]. However, its function in T2DM-OSA has not been reported. This study showed that NEAT1 expression was upregulated in the aortic vascular tissues of mice with T2DM exposed to IH and HG and IH-induced HMEC-1 cells. Additionally, interference with NEAT1 expression inhibited apoptosis, inflammation, and oxidative stress of HG- and IH-triggered HMEC-1 cells. Subsequent assays revealed that NEAT1-mediated regulation of T2DM-OSA-like vascular endothelial cell injury was associated with the Apelin/Nrf2/HO-1 signalling pathway.
UPF1 is an RNA-binding protein responsible for nonsense-mediated mRNA decay, which is an mRNA quality-control mechanism [Citation29,Citation30]. Studies have demonstrated that lncRNAs affect mRNA stability by binding to UPF1. For example, ZFPM2-AS1 synergized with UPF1 to destroy zinc finger protein, FOG family member 2 mRNA stability [Citation31]. SNAI3-AS1 promoted SMAD family member 7 mRNA stability by binding to UPF1 [Citation32]. Shi et al. revealed that interference with the interaction of UPF1 and GAS5 limits the degradation of GAS5, further regulating glucose uptake and insulin signalling in diabetic adipocytes [Citation33]. Our data showed that NEAT1 regulated Apelin expression by binding to UPF1. Moreover, UPF1 overexpression reduced Apelin expression in the presence of NEAT1, whereas the regulatory effect of UPF1 overexpression on the mRNA and protein expression levels of Apelin was weakened in the absence of NEAT1. Thus, NEAT1 destabilized Apelin mRNA by recruiting UPF1.
The progression of T2MD-OSA involves the regulation of some proteins. For example, high mobility group box-1 protein combined with toll-like receptor 4 to promote apoptosis and inhibit autophagy of hippocampal neurons in T2DM-OSA [Citation23]. Nrf2 participated in the protective effect of Honokiol on pancreatic β cells of rats with diabetes mellitus under IH treatment [Citation34]. Apelin is secreted by adipose tissues and is expressed in several cell types, such as gastric exocrine and islet cells, and participates in the regulation of neurological disorders, hypertensive diseases, and metabolic disorders [Citation35]. A study showed that patients with T2DM and mild cognitive impairment presented a lower serum Apelin level than those with normal cognitive function [Citation21]. Our data showed that Apelin expression was downregulated in the aortic vascular tissues of mice with T2DM exposed to IH and HG and IH-induced HMEC-1 cells. A diabetic rat model showed that Apelin decreased renal ischaemia/reperfusion by activating the Nrf2 pathway [Citation22]. Nrf2 can regulate the transcription of the antioxidant enzyme haem oxygenase HO-1, and the Nrf2/HO-1 pathway is involved in the regulation of melatonin in HG-induced ferroptosis in T2DM with osteoporosis [Citation36,Citation37]. This study revealed that Apelin introduction protected against HG- and IH-induced HMEC-1 cell apoptosis, inflammation, and oxidative stress by activating the Nrf2/HO-1 signalling pathway. Moreover, the absence of NEAT1 protected HMEC-1 cells from HG- and IH-induced injury through Apelin. Thus, NEAT1 knockdown reduced HG- and IH-induced HMEC-1 cell injury through the Apelin/Nrf2/HO-1 signalling pathway.
Taken together, NEAT1 knockdown protected HMEC-1 cells from HG- and IH-induced injury. In terms of mechanism, NEAT1 destabilized Apelin mRNA by binding to UPF1 and thus inactivated the Nrf2/HO-1 pathway. However, the mechanism was not verified using mouse model assays, which should be considered. Nevertheless, our study provides a novel insight into the occurrence of diabetic angiopathy. Furthermore, these findings suggest that the interference of NEAT1 expression is effective against T2DM-OSA.
Authors’ contributions
Kai Chen, Baiqing Ou, Quan Huang, and Daqing Deng contributed to the conception and design of the research; Kai Chen, Yi Xiang, and Fang Hu contributed to the acquisition and analysis of the data; Kai Chen and Fang Hu drafted the initial manuscript. All authors critically revised the manuscript, agree to be fully accountable for ensuring the integrity and accuracy of the work, and read and approved the final manuscript.
Ethics approval and consent to participate
The animal research programme was approved by the Animal Care and Use Committee of Hunan Provincial People’s Hospital, approval number [Ethics Review No. 2022 (Wei 14)]
Availability of data and materials
All data generated or analysed during this study are included in this published article (and its supplementary information files).
Language Editing Certificate.pdf
Download PDF (184.9 KB)FigS1.tif
Download TIFF Image (1.8 MB)original blot.docx
Download MS Word (1.1 MB)Disclosure statement
No potential conflict of interest was reported by the author(s).
Supplementary material
Supplemental data for this article can be accessed online at https://doi.org/10.1080/15592294.2023.2293409
Additional information
Funding
References
- Mahlangu T, Dludla PV, Nyambuya TM, et al. A systematic review on the functional role of Th1/Th2 cytokines in type 2 diabetes and related metabolic complications. Cytokine. 2020;126:154892. doi: 10.1016/j.cyto.2019.154892
- Wu H, Jiang M, Liu Q, et al. lncRNA uc.48+ regulates immune and inflammatory reactions mediated by the P2X(7) receptor in type 2 diabetic mice. Exp Ther Med. 2020;20(6):1–15. doi: 10.3892/etm.2020.9360
- Kent BD, McNicholas WT, Ryan S. Insulin resistance, glucose intolerance and diabetes mellitus in obstructive sleep apnoea. J Thorac Dis. 2015;7(8):1343–1357. doi: 10.3978/j.issn.2072-1439.2015.08.11
- Zou J, Zhang P, Yu H, et al. Effect of Laparoscopic Roux-en-Y gastric Bypass surgery on obstructive sleep apnea in a Chinese population with obesity and T2DM. Obes Surg. 2015;25(8):1446–53. doi: 10.1007/s11695-014-1510-9
- Lee CP, Kushida CA, Abisheganaden JA. Epidemiological and pathophysiological evidence supporting links between obstructive sleep apnoea and Type 2 diabetes mellitus. Singapore Med J. 2019;60(2):54–56. doi: 10.11622/smedj.2019015
- Bhamidipati T, Kumar M, Verma SS, et al. Epigenetic basis of diabetic vasculopathy. Front Endocrinol. 2022;13:989844. doi: 10.3389/fendo.2022.989844
- Ioja S, Chasens ER, Ng J, et al. Obstructive sleep apnea in adults with type 1 and type 2 diabetes: perspectives from a quality improvement initiative in a university-based diabetes center. BMJ Open Diab Res Care. 2017;5(1):e000433. doi: 10.1136/bmjdrc-2017-000433
- Xu F, Liu Y, Zhu X, et al. Protective effects and mechanisms of Vaccarin on vascular endothelial dysfunction in diabetic Angiopathy. Int J Mol Sci. 2019;20(18):20(18. doi: 10.3390/ijms20184587
- Lin W, Zhou Q, Wang C-Q, et al. LncRNAs regulate metabolism in cancer. Int J Biol Sci. 2020;16(7):1194–1206. doi: 10.7150/ijbs.40769
- Zhang K, Shi Z-M, Chang Y-N, et al. The ways of action of long non-coding RNAs in cytoplasm and nucleus. Gene. 2014;547(1):1–9. doi: 10.1016/j.gene.2014.06.043
- Yoon JH, Abdelmohsen K, Gorospe M. Posttranscriptional gene regulation by long noncoding RNA. J Mol Biol. 2013;425(19):3723–30. doi: 10.1016/j.jmb.2012.11.024
- Wu T, Du Y. LncRNAs: from basic research to medical application. Int J Biol Sci. 2017;13(3):295–307. doi: 10.7150/ijbs.16968
- Chen Q, He Y, Wang X, et al. LncRNA PTGS2 regulates islet β-cell function through the miR-146a-5p/RBP4 axis and its diagnostic value in type 2 diabetes mellitus. Am J Transl Res. 2021;13(10):11316–11328.
- Du P, Wang J, Han Y, et al. Blocking the LncRNA MALAT1/miR-224-5p/NLRP3 Axis Inhibits the hippocampal inflammatory response in T2DM with OSA. Front Cell Neurosci. 2020;14:97. doi: 10.3389/fncel.2020.00097
- Alfaifi M, Ali Beg MM, Alshahrani MY, et al. Circulating long non-coding RNAs NKILA, NEAT1, MALAT1, and MIAT expression and their association in type 2 diabetes mellitus. BMJ Open Diabetes Res Care. 2021;9(1):e001821. doi: 10.1136/bmjdrc-2020-001821
- Liakos CI, Sanidas EA, Perrea DN, et al. Apelin and visfatin plasma levels in healthy individuals with high Normal blood pressure. Am J Hypertens. 2016;29(5):549–52. doi: 10.1093/ajh/hpv136
- Azizi Y, Faghihi M, Imani A, et al. Post-infarct treatment with [Pyr(1)]apelin-13 improves myocardial function by increasing neovascularization and overexpression of angiogenic growth factors in rats. Eur J Pharmacol. 2015;761:101–8. doi: 10.1016/j.ejphar.2015.04.034
- Zhou Q, Cao J, Chen L. Apelin/APJ system: a novel therapeutic target for oxidative stress-related inflammatory diseases (Review). Int J Mol Med. 2016;37(5):1159–69. doi: 10.3892/ijmm.2016.2544
- Hu H, He L, Li L, et al. Apelin/APJ system as a therapeutic target in diabetes and its complications. molecular genetics and metabolism. Mol Gene Metabol. 2016;119(1–2):20–27. doi: 10.1016/j.ymgme.2016.07.012
- Castan-Laurell I, Dray C, Attané C, et al. Apelin, diabetes, and obesity. Endocrine. 2011;40(1):1–9. doi: 10.1007/s12020-011-9507-9
- Jiang Y, Wang S, Liu X. Low serum apelin levels are associated with mild cognitive impairment in type 2 diabetic patients. BMC endocrine disorders. BMC Endocr Disord. 2022;22(1):137. doi: 10.1186/s12902-022-01051-1
- Zhang X, Zhu Y, Zhou Y, et al. activation of Nrf2 signaling by Apelin attenuates renal ischemia reperfusion injury in diabetic rats. Diabetes Metab Syndr Obes. 2020;13:2169–2177. doi: 10.2147/DMSO.S246743
- Guo X, Shi Y, Du P, et al. HMGB1/TLR4 promotes apoptosis and reduces autophagy of hippocampal neurons in diabetes combined with OSA. Life Sci. 2019;239:117020. doi: 10.1016/j.lfs.2019.117020
- Zhang LH, Wang J, Tan B-H, et al. The association of lncRNA and mRNA changes in adipose tissue with improved insulin resistance in type 2 obese diabetes mellitus rats after roux-en-Y gastric bypass. Dis Markers. 2022;2022:1–11. doi: 10.1155/2022/8902916
- Zhang J, Hu C, Jiao X, et al. Potential role of mRnas and LncRNAs in chronic intermittent hypoxia exposure-aggravated atherosclerosis. Front Genet. 2020;11:290. doi: 10.3389/fgene.2020.00290
- Jia D, He Y, Wang Y, et al. NEAT1: a novel long non-coding RNA involved in mediating type 2 diabetes and its various complications. Curr Pharm Des. 2022;28(16):1342–1350. doi: 10.2174/1381612828666220428093207
- Shao K, Xi L, Cang Z, et al. Knockdown of NEAT1 exerts suppressive effects on diabetic retinopathy progression via inactivating TGF-β1 and VEGF signaling pathways. J Cell Physiol. 2020;235(12):9361–9369. doi: 10.1002/jcp.29740
- Shao H, Shen P, Chen J, et al. Expression profile analysis and image observation of miRNA in serum of patients with obstructive sleep apnea-Hypopnea Syndrome. Contrast Media Mol Imaging. 2021;2021:1–7. doi: 10.1155/2021/9731502
- Kim YK, Maquat LE. Upfront and center in RNA decay: UPF1 in nonsense-mediated mRNA decay and beyond. RNA. 2019;25(4):407–422. doi: 10.1261/rna.070136.118
- Kurosaki T, Popp MW, Maquat LE. Quality and quantity control of gene expression by nonsense-mediated mRNA decay. Nat Rev Mol Cell Biol. 2019;20(7):406–420. doi: 10.1038/s41580-019-0126-2
- Han S, Cao D, Sha J, et al. LncRNA ZFPM2-AS1 promotes lung adenocarcinoma progression by interacting with UPF1 to destabilize ZFPM2. Mol Oncol. 2020;14(5):1074–1088. doi: 10.1002/1878-0261.12631
- Li Y, Guo D, Ren M, et al. Long non-coding RNA SNAI3-AS1 promotes the proliferation and metastasis of hepatocellular carcinoma by regulating the UPF1/Smad7 signalling pathway. J Cell Mol Med. 2019;23(9):6271–6282. doi: 10.1111/jcmm.14513
- Shi Y, Parag S, Patel R, et al. Stabilization of lncRNA GAS5 by a Small Molecule and its implications in diabetic adipocytes. Cell Chem Biol. 2019;26(3):319–330.e6. doi: 10.1016/j.chembiol.2018.11.012
- Li CG, Ni C-L, Yang M, et al. Honokiol protects pancreatic β cell against high glucose and intermittent hypoxia-induced injury by activating Nrf2/ARE pathway in vitro and in vivo. Biomed Pharmacother. 2018;97:1229–1237. doi: 10.1016/j.biopha.2017.11.063
- Antushevich H, Wójcik M. Review: apelin in disease. Clin Chim Acta. 2018;483:241–248. doi: 10.1016/j.cca.2018.05.012
- Loboda A, Damulewicz M, Pyza E, et al. Role of Nrf2/HO-1 system in development, oxidative stress response and diseases: an evolutionarily conserved mechanism. Cell Mol Life Sci. 2016;73(17):3221–47. doi: 10.1007/s00018-016-2223-0
- Ma H, Wang X, Zhang W, et al. Melatonin suppresses ferroptosis induced by high glucose via activation of the Nrf2/HO-1 signaling pathway in type 2 diabetic osteoporosis. Oxid Med Cell Longev. 2020;2020:1–18. doi: 10.1155/2020/9067610