
ABSTRACT
TET1/2/3 dioxygenases iteratively demethylate 5-methylcytosine, beginning with the formation of 5-hydroxymethylcytosine (5hmC). The post-mitotic brain maintains higher levels of 5hmC than most peripheral tissues, and TET1 ablation studies have underscored the critical role of TET1 in brain physiology. However, deletion of Tet1 precludes the disentangling of the catalytic and non-catalytic functions of TET1. Here, we dissect these functions of TET1 by comparing adult cortex of Tet1 wildtype (Tet1 WT), a novel Tet1 catalytically dead mutant (Tet1 HxD), and Tet1 knockout (Tet1 KO) mice. Using DNA methylation array, we uncover that Tet1 HxD and KO mutations perturb the methylation status of distinct subsets of CpG sites. Gene ontology (GO) analysis on specific differential 5hmC regions indicates that TET1’s catalytic activity is linked to neuronal-specific functions. RNA-Seq further shows that Tet1 mutations predominantly impact the genes that are associated with alternative splicing. Lastly, we performed High-performance Liquid Chromatography Mass-Spectrometry lipidomics on WT and mutant cortices and uncover accumulation of lysophospholipids lysophosphatidylethanolamine and lysophosphatidylcholine in Tet1 HxD cortex. In summary, we show that Tet1 HxD does not completely phenocopy Tet1 KO, providing evidence that TET1 modulates distinct cortical functions through its catalytic and non-catalytic roles.
Introduction
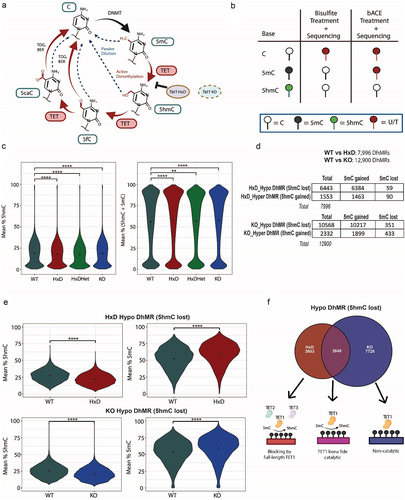
Ten-eleven translocation (TET) enzymes mediate the iterative oxidation of 5mC to 5-hydroxymethylcytosine (5hmC), 5-formylcytosine (5fC), or 5-carboxycytosine (5caC) () [Citation1–3]. These oxidized constituents (ox-mC) are poorly recognized by the maintenance DNA methyltransferase DNMT1, and are therefore lost through passive dilution during cell division. Alternatively, 5fC and 5caC can be targeted by thymine DNA glycosylase (TDG) to restore unmodified C via the base excision repair (BER) pathway. The first characterization of TET enzymes more than a decade ago [Citation4–6] ushered in newfound interest in studying the regulatory functions of 5hmC in mammalian tissues. The mammalian brain is distinctly capable of maintaining high levels of 5hmC in post-mitotic neurons [Citation1]. Highly quantitative High-performance Liquid Chromatography Mass-Spectrometry (HPLC-MS) methods revealed higher enrichment of 5hmC in terminally differentiated neurons compared to peripheral tissues and mouse embryonic stem cells (mESCs). Additionally, 5hmC has the potential to serve as a stable epigenetic mark [Citation7–9]. Most research that has hitherto studied the in vivo brain functions of TET1 enzyme utilized Tet1 knockout (KO) mouse model with complete TET1 protein ablation [Citation10–13]. These studies established TET1’s role in modulating neuronal activity genes and TET1 protein ablation led to impaired contextual fear memory extinction. However, the minimalist approach of TET1 protein ablation precludes the disentangling of the catalytic and non-catalytic functions of TET1. Furthermore, the studies failed to examine 5hmC and 5mC simultaneously, which is essential in the understanding of TET1 processivity and the potential of 5hmC as a regulatory epigenetic mark.
Figure 1. Tet1 mutants regulate common and distinct CpG sites in the adult cortex.
In vitro studies have shown that TET1 is capable of carrying out both enzymatic and non-enzymatic functions in physiological contexts [Citation14–16]. Investigation of TET1 catalytically inactive (Tet1m/m) and knockout (Tet1-/-) in mESCs proved that it could have disparate differentiation outcomes [Citation14]. Specifically, Tet1-/-, but not Tet1m/m, impaired Polycomb repressive complex 2 (PRC2) and SIN3A recruitment, resulting in aberrant expression of bivalent genes and downstream differentiation defects. Similarly, TET1 protein colocalizes with the SIN3A co-repressor complex in repressing and fine-tuning Polycomb group target genes in mESCs [Citation15]. This non-catalytic function of TET1 also holds true outside of mESCs, where TET1 has been shown to regulate hypoxia-induced epithelial-mesenchymal transition (EMT) by physically interacting with hypoxia-inducible factor 1a/2a (HIF-1a/HIF-2a) independent of its enzymatic function [Citation16]. In another instance, adeno-associated virus (AAV)-mediated overexpression of full-length TET1 or catalytic dead mutant (TET1m) in mouse hippocampus upregulates neuronal memory-associated genes and dysregulates contextual fear memory [Citation10]. Distinctive catalytic and non-catalytic properties are not unique to TET1. For example, Tet2 knockout mice exhibited both myeloid and lymphoid disorders, while Tet2 catalytic mutants mainly developed myeloid malignancies [Citation17]. Together, these findings suggest that TET1’s regulation of the genome is complex, which requires more nuanced investigations of its catalytic and non-catalytic functions in vivo. Progress has been hindered due to: 1) lack of a TET1 catalytic inactive adult mouse model and 2) the absence of sensitive tools with robust statistical power to simultaneously and separately quantify 5mC and5hmC genome-wide.
While studies have established that the Tet1 knockout impacts adult brain functions [Citation10–13], dissecting the relative contributions of its canonical catalytic and non-canonical functions has remained a goal in the field. To address this knowledge gap, we generated a new mouse model, Tet1HxD/HxD (hereafter referred to as Tet1 HxD) with intact, but catalytically inactive TET1 protein [Citation18–20]. The Tet1 HxD mutation was confirmed by Sanger sequencing and restriction enzyme length polymorphism (RFLP) analyses. It was demonstrated that the HxD mutation did not affect Tet1 RNA (RNA pyrosequencing) and protein (Western blot) levels [Citation20]. We compared the Tet1 HxD mutant to the previously characterized Tet1−/− (hereafter referred to as Tet1 KO) mouse model [Citation21]. To map 5mC, 5hmC (TET1’s most abundant oxidative product) and unmodified C in parallel, here we employ the high-throughput Infinium mouse BeadChip array [Citation22] on bisulfite (BS) and bisulfite-assisted APOBEC3A-coupled epigenetic (bACE)-treated genomic DNA samples [Citation22,Citation23]. We focused on the adult cortex as it is the brain region with high 5hmC levels [Citation24]. Thus, the novel TET1 mouse model, in concert with hybridization array approach, allowed us to parse catalytic and non-catalytic roles for TET1 in the adult cortex. Our approach reveals distinct subsets of CpG sites impacted by bona fide catalytic activity and non-catalytic function. Through GO analysis of DhMRs, we revealed that TET1’s catalytic activity is linked to neuronal functions. Furthermore, we describe a cortical phenotype unique to Tet1 HxD mutant with accumulation of select lysophospholipids. Corroborating with H3K36me3 and MeCP2 motif enrichment at TET1-regulated sites, we showed that Tet1 mutations mainly impact genes that are associated with alternative splicing. Taken together, our study has shown that TET1 could contribute to the cortical DNA methylation landscape, gene expression, and lipidomic through its distinct catalytic and non-catalytic functions.
Materials and methods
Animal studies
All animal husbandry and maintenance were approved by the Institutional Animal Care and Use Committee (IACUC) of the University of Pennsylvania. All mice were under a 12-hour light/12-hour dark cycle and fed with standard chow (Laboratory Autoclavable Rodent Diet 5010, LabDiet, St. Louis, MO, USA). Tet1−/− (Tet1 KO) mice [Citation25] (017358; B6; 129S4-TET1tm1.1Jae/J) were purchased from the Jackson Laboratory and were backcrossed for at least 10 generations to C57BL/6J (B6; The Jackson Laboratory 000664) background (Table S1). Tet1 KO mice were maintained as Tet1 +/- heterozygous breeders to generate Tet1+/+ (Tet1 WT) and Tet1 −/− (TET1 KO) progeny for experiments. Genomic DNA was isolated from ear snips and genotyped using polymerase chain reaction (PCR) with genotyping primers listed in Table S2. Male mice were aged to 3–5 months old before whole cortex was harvested for experiments.
Generation of Tet1HxD/HxD (Tet1 HxD) mouse line
easiCRISPR-Cas9 was utilized to introduce mutational substitutions H1654Y and D1656A at TET1 catalytic domain (Exon 10) to abrogate its catalytic activity, as previously described (Table S1) [Citation20]. Tet1 HxD mice were maintained as Tet1HxD/+ heterozygous breeders (Tet1 HxDHet) to generate Tet1+/+ (Tet1 WT) and Tet1 HxD/HxD (Tet1 HxD) progeny for experiments. Genomic DNA was isolated from ear snips and genotyped using polymerase chain reaction (PCR) with genotyping primers listed in Table S2. Male mice were aged to 3–5 months old before whole cortex was harvested for experiments.
Whole cortex harvest
Whole cortical tissue was dissected from 3- to 5-month-old adult male mice before flash frozen in liquid nitrogen. Harvested tissues were then stored at −80°C.
Cortical tissue DNA isolation
Flash frozen cortical tissue (estimate amount 5 mg) was cut and transferred to a clean Eppendorf tube. Tail lysis buffer (50 mM Tris-HCl, pH8.0, 100 mM EDTA, 0.5% SDS) was added and the tissue was homogenized 4X with hand-held homogenizer (Dwk Life Sciences) [Citation26]. The homogenate was passed through a 26 G needle 4X to ensure complete homogenization. Sample was centrifuged and the supernatant was transferred to a new tube. Tail lysis buffer and Proteinase K (180 U/mL, Sigma-Aldrich) were added to the sample. Sample was then incubated at 55°C for at least 1 hour. After incubation, Phenol:Choloroform:Isoamyl Alcohol (Sigma-Aldrich) was added to the sample, centrifuged, and the aqueous layer was transferred to a new tube. Isopropanol and Ammonium acetate (7.5 M) were added to precipitate the DNA at room temperature for 10 minutes. Sample was centrifuged and supernatant was discarded. The DNA pellet was washed with 80% ethanol, centrifuged, and supernatant was discarded. DNA pellet was air dried for 5 minutes. The DNA pellet was resuspended in 1X TE buffer (10 mM Tris-HCl, pH8.0, 1 mM EDTA) and, as required, incubated at 37°C for a few hours or overnight to dissolve the pellet. All reagents are listed in Table S3.
Bisulfite and bACE conversion
1 µg of genomic DNA was bisulphite treated using the Qiagen EpiTech Bisulphite kit (Qiagen). Bisulphite converted DNA (BS) was eluted in 20 µL of 0.07X of the supplied elution buffer [Citation23]. 10 µL of the sample was further subjected Bisulphite-assisted APOBEC3A-coupled epigenetic (bACE) protocol [Citation23]. Briefly, 2% DMSO and 35 mM 2:7:7 succinic acid:sodium dihydrogen phosphate:glycine (SPG) were added to each sample. The sample mix was incubated at 95°C for 5 minutes and immediately cooled down on a cold block. Recombinant APOBEC3A (A3A) enzyme produced in-house by the Kohli Lab [Citation23,Citation27] was then added to each sample. The sample was spun down and incubated at 37°C for 2 hours. Once the incubation was complete, the sample was purified using Zymo Oligo Clean and Concentrator kit (Zymo Research) and eluted in 15 µL 0.07X Qiagen Elution Buffer. To validate the efficiency A3A-mediated 5mC conversion and protection of bisulphite-converted 5hmC cytosine 5-methylensulfonate (CMS) adducts, we performed pyrosequencing methylated (meth) lambda and T4 phage bACE-treated spike-in DNA for each sample, as previously described [Citation23,Citation28]. Only samples with percent cytosine values ≤ 10% for meth lambda phage or ≥90% for T4 phage were used for downstream Infinium Mouse Methylation BeadChip array sequencing. The BS and bACE-converted genomic DNAs were stored temporarily at −20°C for less than a week before they are sent for array sequencing. All reagents are listed in Table S3.
Infinium mouse methylation BeadChip array
BS- and bACE-converted cortical DNA were sent for Illumina Infinium Mouse Methylation 12v1–0 BeadChip sequencing following the manufacturer’s protocol, as previously described [Citation29,Citation30]. The sequencing was run by Center for Applied Genomics Genotyping Core (CAG) at the Children’s Hospital of Philadelphia. Biological replicates for each genotype are as follows: Tet1 WT n = 8, Tet1 HxD n = 8, Tet1 KO n = 8, Tet1 HxDHet n = 8.
RNA isolation
RNA was isolated from cortex using Quick-RNA Miniprep Plus kit (Zymo Research). Briefly, cortical sliver was homogenized using hand-held homogenizer (Dwk Life Sciences) in Zymo RNA lysis buffer. The homogenate was then passed through 26 G needle to ensure complete lysis. Genomic DNA was removed using DNase I provided in the kit. Following isolation using the kit, RNA was eluted in 10 µL nuclease-free water and stored at −80°C. All reagents are listed in Table S3.
RNA-Sequencing
The concentration and purity of isolated RNA were determined using Nanodrop. RNA integrity was further assessed using Tapestation (Agilent) with RNA ScreenTape (Agilent). Only RNA samples with RNA Integrity Number (RIN) value of > 8 were selected for downstream RNA-Seq library preparation. RNA-Seq libraries were prepared with 0.3 µg input RNA/sample using KAPA Stranded mRNA-Seq kit (KAPA Biosystems) and KAPA Unique Dual-Indexed Adapter kit (KAPA Biosystems). The amplified RNA-Seq libraries were evaluated on Tapestation (Agilent) with DNA High-Sensitivity D5000 ScreenTape (Agilent). Library molarity was quantified using KAPA Library Quantification kit (KAPA Biosystems). RNA-Seq libraries were pooled and subject to 51 bp paired end sequencing on Illumina NovaSeq 6000. All reagents are listed in Table S3. Biological replicates for each genotype are as follows: Tet1 WT n = 4, Tet1 HxD n = 4, Tet1 KO n = 4.
HPLC-MS lipidomic profiling
Flash frozen whole cortices were cut and weighed to ensure mean weight of ~10 mg/tissue for HPLC-MS processing. The weighed tissues were submitted to the Translational Biomarkers Core from the Center of Excellence in Environmental Toxicology (CEET) at the University of Pennsylvania. Clementina Mesaros, PhD designed the extraction methods and supervised the LC-HRMS analysis and data analysis. All lipidomic internal standards are listed in Table S4.
Optima grade methanol, water, acetonitrile, methyl tert-butyl ether and 2-propanol were from Thermo Fisher Scientific (Pittsburg, PA). Gasses were supplied by Airgas (Philadelphia, PA). Glassware and HPLC vials were from Waters Corp (Milford, MA). Serotonin and serotonin-d4 were from Cayman Chemicals. Dopamine and dopamine-d5 were from Sigma-Adrich.
Tissue homogenization
Flash frozen whole cortices were cut pieces of around 10 mg on dry ice. The tissue was added Green bullet blender tubes (# NA-GREENR1-RNA, from Next Advance, Try, NY) with 0.5 mL cold methanol in ice. Each tube contained also 40 µL × 25 µM universally labelled amino acids mix, 20 µL x 100 pg/µL of GABA-IS (2 µg), 0.1 µg Serotonine-IS, add 1 µg-Glutamate-IS, Trp-IS 500 ng per sample. Tissues were homogenized with the Next Advance Bullet Blender Tissue Homogenizer 3 × 5 min @ dry ice at max speed. The tubes were vortexed and allowed to come to room temp for 30 min.
Lipid extraction from the tissue homogenate
10 mL Pyrex Glass tubes were prepared with 1 mL methanol and 20 µL on internal standard mix (1:1, SPLASH® LIPIDOMIX #330707: Ceramide/Sphingoid Internal Standard Mixture I #LM6002, both from Avanti Polar Lipids, Alablaster, AL) and kept in dry ice. Amounts of each labelled standard are shown in the Table S2. To each tube was added 300 µL of tissue homogenate as described before (one-half of the volume). 5 mL methyl tert-butyl ether (MTBE) was added to each of the tubes and then tubes were shaken vigorously for 30 min. 1.2 mL water was added to each tubes and vortexed for 30 sec each. Centrifugation for 10 min @ 1000×g created two phases. The top clear phase was moved to a clean glass Pyrex tube and dried down under nitrogen. 200 µL MTBE/MeOH = 1/3 (v/v) (per 5 mg tissue) was used to re-suspend the residue. Each sample was sonicated for 5 min in water bath at room temperature, spun down at 10, 000 × g for 10 min at 4°C and only 100 µL were transferred to a HPLC vial for LC-MS analysis. A pooled sample was created by mixing 40 µL of each re-suspended sample and ran as quality control (QC-Pool) every 10 samples. 2 µL injections were made in both positive mode and separately in the negative mode. Biological replicates for each genotype are as follows: Tet1 WT n = 10, Tet1 HxD n = 10, Tet1 KO n = 10, Tet1 HxDHet n = 10.
Liquid chromatography high resolution-mass spectrometry (LC-HRMS) for lipids was conducted as described [Citation31]. Control extraction blanks were made in the same way using just the solvents instead of the tissue homogenate. The control blanks were used for the exclusion list with a threshold feature intensity set at 1e105. Untargeted analysis and targeted peak integration were conducted using LipidsSearch 5 (Thermo Fisher Scientific) as described by Wang et al. [Citation32]. An external mass calibration was performed using the standard calibration mixture approximately every 3 days. All samples were analysed in a randomized order in full scan MS that alternated with MS2 of top 10, with HCD scans at 30, 45 or 60 eV.
HPLC-MS neurotransmitter profiling
The neurotransmitter profiling was done on the same tissue homogenate as lipidomic profiling (see above). Tissue samples were submitted to the Translational Biomarkers Core from the Center of Excellence in Environmental Toxicology (CEET) at the University of Pennsylvania. Clementina Mesaros, PhD designed the extraction methods and supervised the LC-HRMS analysis and data analysis. All spike-in standards and internal standards used in neurotransmitter profiling are listed in Table S5. Biological replicates for each genotype are as follows: Tet1 WT n = 10, Tet1 HxD n = 10, Tet1 KO n = 10, Tet1 HxDHet n = 10.
Neurotransmitters were extracted by methanol precipitation from the tissue homogenate. Briefly, after removing half of the volume of tissue, homogenate for lipids extraction (0.3 mL), to additional 0.3 mL 80% methanol was each bullet tubes. It was vortexed well to reduce the absorption of metabolites to the tubes. All the volume of the tissue homogenate was moved to a new Lo-Bind protein Eppendorf tube. The beads from the bullet blender green tube were rinsed with 0.3 mL 80% MeOH and added to same Lo-Bind tube. The Lo-Bind tube was centrifuged 10 min @ 8,000×g to get all the tissue as a pellet. The top metabolites containing layer was moved to new Eppendorf and dried under nitrogen. The tubes were frozen at −80 C until LC-HRMA analysis. The dry samples were re-dissolved by vortexing and sonicating in 100 µL 20% Methanol in water. As described for lipids analysis, pooled samples were assayed using 20 µL from each sample.
Liquid chromatography high resolution -mass spectrometry (LC-HRMS) for neurotransmitters. As previously described, control extraction blanks were made in the same way using just the solvents instead of the tissue homogenate [Citation31]. The control blanks were used for the exclusion list with a threshold feature intensity set at 1e105. Targeted peak integration was done from the full scan acquired at 120 K resolution and was conducted using Quan Browser 4.2 (Thermo Fisher Scientific). An external mass calibration was performed using the standard calibration mixture approximately every 3 days. All samples were analysed in a randomized order. The pooled QC samples for neurotransmitter quantification were run with a MS2 of top 10, with HCD scans at 20, 40 or 50 eV.
Statistical analysis
Statistical analyses were performed using GraphPad Prism, R, and Metaboanalyst 5.0 software, as described below.
Lipidomics
Lipidomic HPLC-MS raw data and first-pass quality check analyses were processed by Clemetina Mesaros, PhD using MetaboAnalyst 5.0 software [Citation33]. All samples are normalized to QC pool, log transformed, and autoscaled. Heatmap was made with Ward clustering method and filtered to display the top 25 lipid classes. Volcano plot was plotted using default settings of two-sample t-tests with FDR < 0.05 and Fold Change of > 1.5. Bargraphs of LPE and LPC levels in Tet1 WT and Tet1 mutants are plotted with one-way ANOVA followed by Dunnett’s multiple comparisons test. p < 0.05 was considered statistically significant and all individual values were expressed as mean ± standard error of the mean (SEM).
Neurotransmitter metabolomics
Neurotransmitter metabolomic raw data and first-pass quality check analyses were processed by Clemetina Mesaros, PhD using XCalibur 4.3 software [Citation34]. All neurotransmitters were normalized to their respective spike-in standards/internal standards. Bargraphs were plotted using One-way ANOVA with Dunnett’s multiple comparisons test. p < 0.05 was considered statistically significant and all individual values were expressed as mean ± standard error of the mean (SEM).
Global Bisulfite and bACE Signals
Raw Beta signals from Bisulfite- and bACE signals were plotted as violin plots. Kruskal–Walis test with Dunn’s multiple comparison test was performed between Tet1 mutants and Tet1 WT.
Methylation Levels at DhMR
Significant DhMRs were filtered using SeSAMe pipeline [Citation22,Citation35]. Mann-Whitney U test was performed to compare methylation changes between Tet1 mutant relative to Tet1 WT. p < 0.05 was considered statistically significant.
Infinium mouse methylation BeadChip array analysis
Infinium Mouse Methylation MM218 array was analysed using SeSAMe pipeline [Citation22,Citation35]. Raw Infinium IDAT files were and processed into corrected Beta values using SeSAMe’s openSesame pipeline. Since bACE provided direct readout of 5hmC, 5mC levels were deduced by subtracting bACE Beta values from BS Beta values. Differentially methylation 5hmC regions (DhMRs) were analysed using SeSAMe’s differentially methylation region (DMR) function (FDR <0.05). Each DhMR corresponds to a single probe on the array with FDR < 0.05. Region annotations for DhMRs were performed using Homer’s annotatePeaks function. Gene annotations include 1–5 kb upstream of transcriptional start sites (TSS), transcription termination sites (TTS), <1kb upstream of TSS (promoters), 5’ untranslated region (5’UTRs), exons, introns, 3’ untranslated region (3’UTRs), intergenic regions, CpG Islands, non-coding regions, and repetitive elements. Histone modification mark mining and transcription factor motif mining were analysed using SeSAMe’s knowYourCG function. Venn Diagrams were plotted using R package Eulerr [Citation36]. Pathway analysis of DhMRs was performed using R package clusterProfiler [Citation37].
RNA-Seq analysis
Adapter trimming was performed using TrimGalore (https://www.bioinformatics.babraham.ac.uk/projects/trim_galore/) using default paired-end settings. Read quality was inspected using Fastqc(https://www.bioinformatics.babraham.ac.uk/projects/fastqc/). Paired-end reads were aligned against mm10 reference genome using STAR [Citation38] using default parameters, paired-end mode. Duplicate reads were removed using SAMtools [Citation39]. Read counts were generated using StringTie [Citation40] using default parameters. Differential gene analysis was performed using R package DESeq2 [Citation41].
Results
Tet1 perturbation minimally impacts global methylation profiles
The goal of this study is to systematically dissect TET1’s catalytic and non-catalytic functions in the adult cortex through the investigation of 5mC and 5hmC profiles, gene expression, and brain phenotypes. To uncouple TET1’s catalytic function from its non-catalytic (scaffolding) requirement, we generated and characterized Tet1HxD/HxD (hereafter referred to as Tet1 HxD) catalytic dead mouse model [Citation20]. Tet1 HxD produces intact protein at wildtype levels with H1654Y and D1656A amino acid substitutions in the catalytic domain, rendering it unable to oxidize 5mC to 5hmC [Citation18–20] (). We maintained Tet1 HxD as heterozygous, Tet1 HxD/+ mutants (hereafter referred to as Tet1 HxDHet) to generate both Tet1 HxD and Tet1 HxDHet littermates. We also utilized previously characterized Tet1−/− (hereafter referred to as Tet1 KO), where exon 4 deletion, results in frameshift mutation that ablates the TET1 protein [Citation12,Citation21,Citation25].
To examine the DNA modification landscapes, we employed the Illumina Infinium mouse BeadChip array, which harbours > 285, 000 probes profiling methylation levels of individual CpG sites [Citation22]. The BeadChip interrogates biologically relevant CpGs that are representative of the mouse genome with manually curated coverage of gene promoters, enhancers, repetitive elements, and known CpG islands [Citation22,Citation42]. We employed the methylation array because it outperforms whole-genome bisulphite sequencing (WGBS) with 2–3 fold lower technical variability at 30× sequencing depth [Citation43]. The high sequencing coverage at each CpG and the inclusion of a large number of biological replicates enables the array a more robust statistical power in identifying differentially methylated regions (DMRs) relative to WGBS that are biologically meaningful [Citation42,Citation44]. To reliably distinguish between 5mC and 5hmC modification at individual CpG sites, we used bisulphite (BS) and bisulphite-assisted APOBEC3A-coupled epigenetic (bACE) conversion [Citation22,Citation45] (). Briefly, cortical genomic DNA (gDNA) was isolated from the whole cortex and split into two downstream workflows. In the first workflow, gDNA was treated with BS which deaminates unmodified C, but not modified 5mC or 5hmC. In the second workflow, gDNA was treated with BS and then the DNA deaminase APOBEC3A. The APOBEC3A enzyme preferentially deaminated residual 5mC, while cytosine 5-methylenesulfonate (CMS), the product of 5hmC reaction with BS was resistant to further deamination. Thus, while BS does not distinguish between 5hmC and 5mC (as both are sequenced as C), bACE provided a direct readout of 5hmC (as 5mC is sequenced as T post bACE treatment) (). Consequently, 5mC is deduced by subtraction of bACE array signals from BS array signals. By leveraging the Infinium mouse BeadChip array on both BS- and bACE-treated gDNA samples, we were able to simultaneously infer the 5hmC, 5mC and C levels at individual CpG sites. A strength of the array approach is that each individual CpG is sampled to the equivalent of > 100-fold depth, which is otherwise not practical for WGBS and of particular importance in studying 5hmC given the typical genomic levels (0.8% of cytosines) [Citation43,Citation46]. The analysis for the Infinium mouse BeadChip array employed the SEnsible Step-wise Analysis of Methylation (SeSAMe) pipeline [Citation22], where the raw Infinium IDAT files were processed into corrected Beta values. After removing probes with low Beta signal intensity (equivalent to cytosine modification depending on context), we detected around 200,473 bACE probes per sample and 235,032 BS probes per sample that passed the quality check.
We first looked at the global methylation and hydroxymethylation landscapes of adult Tet1 WT, Tet1 HxD, Tet1 HxDHet, and Tet1 KO (n = 8) whole cortices. As expected, the high sequencing coverage at each CpG by the BeadChip array minimized the variability in Tet1 biological replicates as the BS and bACE-treated samples clustered according to their respective treatment and genotype (Figure S1A). The global methylation level was computed from the average signals from all probes. We found that Tet1 KO, Tet1 HxD, and Tet1 HxDHet led to minor but statistically significant downregulation in the global 5hmC and upregulation in the global 5mC levels (, Figure S1B-S1D). We have also performed Kruskal–Wallis One-Way ANOVA with Dunn’s multiple comparisons test on the averaged bACE/BS levels from each mouse (Figure S1B-S1D). Although we observed statistical significance in pairwise comparison of most bACE/BS samples, samples of the same genotype have very similar median bACE/BS. Thus, we conclude that globally, the bACE and BS signals are minimally perturbed although statistically significant. This is in agreement with previous studies where the global changes were subtle, indicating that our analysis was working as expected [Citation12,Citation47].
TET1 regulates a subset of CpG sites in catalytic and non-catalytic manner
In order to examine the methylation changes in a locus-specific manner, we used SeSAMe’s Differentially Methylated Region (DMR) function [Citation22], which identified locus-specific differential 5hmC regions (DhMRs) between Tet1 WT and mutants, where each DhMR corresponds to a single probe on the array, using a False Discovery Rate (FDR) <0.05 (). We found 7,996 DhMRs in Tet1 HxD (vs Tet1 WT) and 12,900 DhMRs in Tet1 KO (vs Tet1 WT) (). Inspection of the methylation levels revealed that approximately 80% of the DhMRs had a decrease in 5hmC level (hypo-hydroxymethylation) and a reciprocal gain in 5mC level (hypermethylation) in both TET1 mutants (, Table S6). This reciprocal hypermethylation (5mC gain) and hypo-hydroxymethylation (5hmC loss) in the Tet1 mutants were consistent with the model by which Tet1 perturbation rendered it unable to oxidize substrate 5mC into 5hmC. Of note, Tet1 HxDHet was comparable to their WT counterparts, yielding merely 826 DhMRs (Figure S1E), largely excluding the possibility that the catalytic mutation has dominant negative effects.
To systematically disentangle the catalytic and non-catalytic mechanisms of TET1, we decided to focuson hypohydroxymethylated DhMRs (5hmC loss). We overlapped the hypohydroxymethylated DhMR distributions between Tet1 HxD and Tet1 KO. This generated three main subsets: 3,603 DhMRs were unique to the Tet1 HxD (HxD unique), 7,728 DhMRs were unique to Tet1 KO (KO unique), while 2,840 DhMRs were shared by the two mutants (common) (, Table S6). We classified the common subset as those that required TET’s bona fide catalytic activity to establish and maintain the 5hmC levels. For these loci, the loss of TET’s catalytic function (Tet1 HxD) phenocopied methylation changes that are observed in Tet1 KO. We postulated that the KO unique subset that was rescued in the presence of the full-length Tet1 HxD corresponded to sites that require putative TET1 scaffolding function (or the non-catalytic activity of TET1) to achieve a normal 5hmC level. The third subset, designated as HxD unique, was fully rescued when TET1 full-length protein was ablated in the Tet1 KO. As our analysis concerned 5hmC levels specifically and TET enzymes are the only known writers of 5hmC, we reasoned that one possible explanation for this group is that full-length TET1 partially hindered TET2 and TET3 from accessing these co-regulated sites. This finding suggested that in the adult cortex, distinct subsets of the genome have different requirements for TET1’s diverse functions to achieve stable 5hmC levels.
TET1 mainly exerts its function by modulating DhMRs in exons and introns
To further characterize the differentially impacted DhMR subsets in Tet1 mutants, we mapped their genomic locations. Compared to the annotated probe counts in the Infinium BeadChip array (Manifest), we found that approximately 50–60% of the DhMRs were located at the exon (p-value <0.0001) and intron (p-value <0.0001) regions of the gene bodies, followed by ~ 15% enrichment in the intergenic regions (p-value <0.0001) (). Because TET1 mainly exerted its function within the gene bodies, we then sought to compare the methylation changes within the transcription unit (5’UTR, promoter, exon, intron, 3’UTR) between Tet1 mutants and Tet1 WT. Overall, there was a significant loss of 5hmC () and gain of 5mC in all three DhMR subsets (Figure S2A-S2C). Comparing the degree of 5hmC loss across different subsets, we found that the effect was the most pronounced in the transcription unit of the common subset (), followed by the HxD unique subset (). This trend was congruent with our previously ascribed TET1 mode of regulation in , where TET1’s catalytic function is dominant for 5hmC generation in the common sites, and the HxD unique sites likely require TET2 or TET3’s catalytic functions which may be sterically hindered by the presence of full-length TET1 HxD. In the common subset, we speculated that these sites required TET1’s catalytic function to establish its 5hmC basal level of ~ 25% in the WT adult cortex (). Because the common subset was shared by TET1 HxD and TET1 KO, it enabled us to explore the implications when these same sites were subject to catalytic mutation (HxD context) or protein ablation (KO context). With this in mind, the perturbation of TET1’s catalytic activity alone was sufficient to elicit marked 5hmC loss of ~ 7% from Tet1 WT level (p-value <0.0001) (, Table S7) and 5mC hypermethylation of ~ 8% compared to Tet1 WT level (p-value <0.0001) (Figure S2A, HxD context, Table S7), similar to that observed in the Tet1 KO (Figure S2A, KO context, Table S7). The methylation changes in the HxD unique subset were relatively smaller compared to the common subset, where on average, 5hmC was decreased by ~ 5.5% from Tet1 WT level (p-value <0.0001) (, Table S7) and 5mC increased by ~ 7% compared to Tet1 WT (p-value <0.0001) (Figure S2B, Table S7). As TET1’s full-length protein is still intact in Tet1 HxD mice, we speculated that it may be blocking TET2 and TET3 from accessing these co-regulated sites, thus contributing to partial 5hmC loss. We classified the last subset of KO unique as TET1 non-catalytic sites exhibiting the least amount of perturbation, with ~ 3.7% 5hmC loss and ~ 5.5% 5mC gain compared to Tet1 WT (p-value <0.0001) (, Figure S2C, Table S7). Interestingly, for all DhMR subsets, the unmodified C was minimally affected. There was only ~ 0.4%, ~1.5%, and ~ 1.3% unmodified C loss in the common, HxD unique and KO unique subsets, respectively (Figure S2D-S2F, Table S7). Because TET has been implicated in regulating repetitive elements [Citation48–50], intergenic regions [Citation51,Citation52], and non-coding regions, we analysed their methylation changes at the Common (Figure S3A, S3D, S3G), HxD Unique (Figure S3B, S3E, S3H), and KO Unique (Figure S3C, S3F, S3I) subsets. Overall, these regions were similarly affected as the transcriptional unit. These findings were consistent with the model where 5hmC functions as a stable epigenetic mark, rather than an intermediate product for active removal of 5mC in the post-mitotic neurons of the cortex [Citation9,Citation53–56].
Figure 2. TET1 mainly exerts its function by modulating DhMRs in exons and introns.
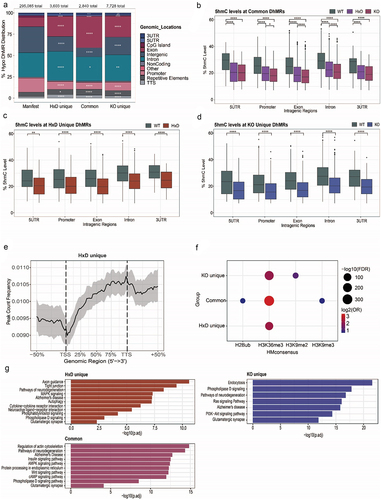
Because DhMRs were mostly enriched within the gene body, we next sought to examine their distribution by performing metagene profiling. In general, DhMRs were depleted from the transcriptional start site (TSS) while enriched towards the 3’ end of the gene body for HxD unique (), common (Figure S2G Left), and KO unique (Figure S2G Right). This mirrored the distribution of transcription elongation mark H3K36me3 [Citation53,Citation57,Citation58]. In fact, previous studies had observed a high correspondence between 5hmC profiles and H3K36me3 patterns within the gene bodies in various tissues [Citation57,Citation59–63]. To ascertain their relationship, we mined for histone modification consensus sequences at the DhMRs using SeSAMe pipeline. We identified H3K36me3 as the most enriched histone in all three subsets, in agreement with previous work [Citation57,Citation59–63] (). Additionally, we also performed transcription factor-binding motif mining at the DhMRs. Methyl-CpG-binding protein 2 (MeCP2) binding motif emerged as the top hit within the common and the KO unique subsets (Figure S2H). Notably, MeCP2 is a major 5mC reader in the brain [Citation8,Citation64]. It is conceivable that TET1 May keep the binding sites hypomethylated via its catalytic activity, thus repelling MeCP2 binding.
Next, we defined gene functions associated with DhMRs by performing Kyoto Encyclopedia of Genes and Genomes (KEGG) pathway analysis. We observed that HxD unique and common subsets were enriched for genes associated with neuron-specific functions. Specifically, HxD unique DhMRs were involved in axon guidance, dendritic growth and neurotransmission (, Table S6), while genes associated with common DhMRs were implicated in neuronal differentiation and development (, Table S6). In contrast, genes associated with KO unique DhMRs were involved in general cell survival and proliferation (, Table S6). This analysis underscored TET1’s neuronal niche where it contributed to critical neurodevelopmental processes via its canonical catalytic activity.
Tet1 catalytic mutants HxD and KO regulate distinct gene sets
To gain molecular insights into the effects of Tet1 perturbations on gene regulation, we performed bulk mRNA-Seq on Tet1 WT, Tet1 HxD, and Tet1 KO whole cortices. As a first-pass filter to evaluate the global transcriptomic differences between the three Tet1 genotypes, we performed a principal component analysis (PCA). PCA showed that the biological replicates cluster together, but the Tet1 mutants are well separated from WT on PC1 and PC2 (Figure S4A). Consistent with this observation, we found 146 genes to be significantly differentially expressed in the Tet1 HxD (vs WT), with 102 genes (69.86%) being downregulated (, Table S8). In contrast, Tet1 KO (vs WT) was more severely impacted with 283 significantly differentially expressed, of which 206 genes (72.79%) were downregulated (, Table S8). These results showed that intact TET1 directly or indirectly modulated gene activation in the cortex. The findings also suggested that deletion of Tet1 induced more severe outcomes in gene expression than the catalytic mutation alone, likely due to compound effects of both catalytic and non-catalytic functions.
Figure 3. Tet1 perturbation is associated with decreased 5hmC.
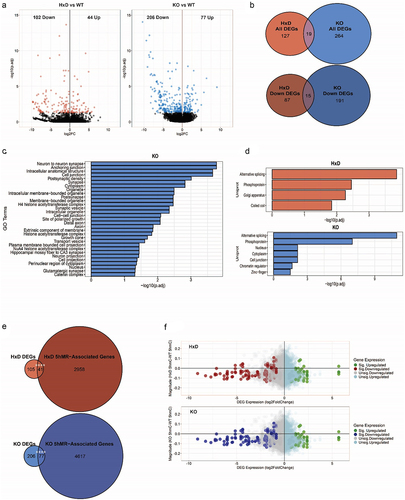
Overall, the Tet1 catalytic mutant did not phenocopy Tet1 loss, as there were only 19 differentially expressed genes (DEGs) shared between the two ( Top, Table S8). Likewise, only 15 of the downregulated DEGs were common between the two mutants ( Bottom, Table S8). These results suggested that TET1 could target distinct genes via its canonical catalytic role or potentially through the recruitment of regulatory-binding partners. Gene ontology (GO) analysis of all DEGs revealed that Tet1 KO elicited consequences in neuron development and synaptic functions (, Table S8). However, pathway analysis for DEGs in Tet1 HxD did not yield specific GO terms. To further explore the gene products that are affected, we ran Uniprot analysis on the DEGs. The most enriched pathway for DEGs in both Tet1 HxD and Tet1 KO cortices was genes associated with alternative splicing (, Table S8). Our RNA sequencing parameters (2 X 51bp) were sufficient for differential gene expression profiling but not for identifying novel variants of splice sites. Sequencing RNA with longer reads (e.g., 2X 125bp) is necessary to confidently identify alternative splicing events [Citation65].
Tet1 perturbation is associated with decreased 5hmC
To elucidate whether these DEGs can be explained by methylation changes, we overlapped the DEGs with their DhMR-associated genes. Forty-one of the 146 HxD DEGs (28.08%) (p-value <0.0001) and 77 of the 283 KO DEGs (27.21%) (p-value <0.0001) corresponded to genes associated with DhMRs (, Table S8). Next, we further dissected the relationship between 5hmC magnitude of change and gene fold-change directionality. By plotting all the probes with their corresponding gene expression, we observed that a majority of the downregulated genes preferentially clustered at the hypo-5hmC quadrant for both Tet1 HxD ( Top) and Tet1 KO ( Bottom). This trend held true even when we focused on probes that fall within the gene body (Figure S4B). We concluded that of the DEGs with accompanying methylation changes, most are associated with the loss of 5hmC () and hypermethylation (Figure S4C, S4D), consistent with the known mechanism of TET1 activity. To statistically test the relationship between DEGs and their corresponding methylation changes, we performed linear regression. In both mutants, their p-value did not meet the statistical cut-off.
Tet1 Catalytic Mutant HxD accumulates lysophospholipids LPC and LPE
Our KEGG analysis of DhMRs suggests that TET1 impacts gene subsets that may manifest in phenotypic differences (). One such examples suggested that phospholipid composition could be potentially disrupted phenotypes (). Lysophospholipid biosynthesis is a highly complex biochemical reaction with two important pathways: de novo synthesis of glycerophospholipid and subsequent fatty acid remodelling (Figure S5A). The de novo pathway converts glycerol 3-phosphate (G3P) to phospholipids, including phosphatidylcholine (PC) and phosphatidylethanolamine (PE). In the second pathway, the fatty acid compositions of the phospholipids PC and PE are then remodelled to generate lysophosphatidylcholine (LPC) and lysophosphatidylethanolamine (LPE), respectively. These pathways involved the concerted action of many key enzymes. To test if the LPC and LPE phenotype in Tet1 mutant cortices can be explained by the gene changes, we performed Gene Set Enrichment Analysis (GSEA) with a list curated genes involved in LPC and LPE biosynthesis [Citation66–72]. We observed that LPC and LPE genes are positively enriched in Tet1 HxD’s ranked gene set (Normalized Enrichment score (NES): 1.098, FDR q-value: 0.401) and conversely negatively enriched in Tet1 KO’s ranked gene set (NES: −0.650, FDR q-value: 0.929), although they did not meet the statistical FDR cut-off (Figure S4E). When we examined DEGs, we observed that two key enzymes involved in PC and PE remodelling, Pla215 and Lpcat1 (Table S8), are significantly changed in Tet1 HxD. PLA2 enzyme oxidized the fatty acid chain of PC and PE to generate lysphospholipids LPC and LPE, respectively [Citation73,Citation74]. The reverse reaction was catalysed by LPCAT enzyme which converted LPC back to PC (Figure S5A). Tet1 HxD mice exhibited an upregulation of the Pla2g15 gene and downregulation of Lpcat1 gene (Figure S4F–S4G).
To follow up on these findings, we investigated phospholipids in Tet1 WT and mutant cortices through High-performance Liquid Chromatography Mass-Spectrometry (HPLC-MS). Briefly, we harvested and flash froze whole cortices from Tet1 WT, Tet1 HxD, Tet1 HxDHet, and Tet1 KO (Figure S5B). These flash frozen tissues were then cut and weighed to ensure mean weight of ~10 mg/sample for downstream HPLC-MS processing. The sensitivity of HPLC-MS allowed unbiased quantification of all lipid species in the whole cortex including glycerophospholipids, lysophospholipids, glycosphingolipids, sphingolipids, and cholesterols [Citation31]. Lysophospholipids such as lysophosphatidylethanolamine (LPE) and lysophosphatidylcholine (LPC) were significantly altered in Tet1 HxD (vs WT) ( Top Left, Table S9). Specifically, 32 LPE and LPC species were significantly elevated in Tet1 HxD. Conversely, Tet1 KO (vs WT) only had three disrupted lipid species ( Bottom Left, Table S9). Consistent with the volcano plot, heatmap of the top 25 lipid classes yielded LPE and LPC as the most disrupted species ( Right, Table S9). Of note, we further confirmed that Tet1 HxDHet did not act in dominant negative fashion as the Tet1 HxDHet cortices are devoid of overt lipidomic phenotype (Figure S5C-S5E)
Figure 4. Tet1 HxD accumulates phospholipid LPC/LPE in the cortex while neurotransmitter levels remain intact.
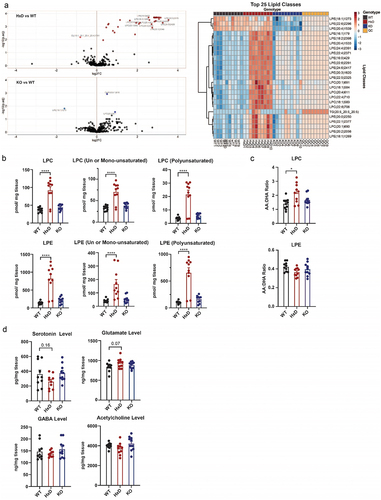
The fatty acid compositions of LPC and LPE could trigger divergent inflammatory signalling pathways in the cells [Citation75–77]. To classify the LPC and LPE species, we separated them based on their fatty acid chain. In Tet1 HxD, the LPE and LPC were driven by the upregulation of both un-/mono-unsaturated and polysaturated species including AA (20:4), DHA (22:6) and oleic acid (18:1) compositions (). In contrast, Tet1 KO did not have statistically significant changes in fatty acid compositions. Polyunsaturated fatty acid (PUFA) side chains such as Arachidonic acid (AA) [20:4] is pro-inflammatory [Citation75–79], while Omega-3 PUFAs Docosahexaenoic acid (DHA) [22:6] and Eicosapentaenoic acid (EPA) [20:5] are anti-inflammatory [Citation80]. To understand the pathology of lysophospholipid profiles in Tet1 mice, we measured the AA:DHA ratio of LPC and LPE. We observed that AA:DHA ratio of LPC was markedly elevated in Tet1 HxD and Tet1 HxDHet, but not in the Tet1 KO (). Together, this suggested that the TET1 catalytic activity is important for phospholipid metabolism in the cortex.
Neurotransmitter levels remain intact in Tet1 mutants
KEGG pathway analysis of DhMRs also implicated disruption in neurotransmitter signalling (), offering added opportunities to explore the linkage between TET genotypes and brain phenotype. The role of TET1 in modulating neurotransmission is inconclusive. Tet1 KO mice exhibited normal long-term potentiation and levels of N-methyl-D-aspartate receptor (NMDAR) subunits in the hippocampus [Citation12]. In contrast, short-hairpin RNA (shRNA) knockdown of Tet1 in neuronal culture caused increased neurotransmitter signalling accompanied by changes in surface AMPAR subunit glutamate receptor 1 (GluR1) levels [Citation81,Citation82]. Thus, we profiled the bulk neurotransmitter levels, including serotonin, glutamate, Gamma-Aminobutyric acid (GABA) and acetylcholine, in whole cortices (Figure S5B) [Citation32]. Measured neurotransmitter levels did not differ in Tet1 mutants (). There was, however, a trend towards reduced serotonin and increased glutamate in Tet1 HxD, suggesting that an increase in the sample size in the future may accentuate the subtle yet important trends in glutamate and serotonin levels.
Discussion
TET1 can regulate crucial cellular processes through a combination of catalytic and non-catalytic functions in vitro, but its dual contributions have yet to be defined in the adult cortex. This gap in knowledge stems from knockout approaches that deplete the TET1 protein, thus precluding the discerning of its enzymatic and non-enzymatic roles in vivo. We overcame this bottleneck by generating the Tet1 HxD mouse model with mutations that abrogate its catalytic activity. Furthermore, we quantified the relative levels of 5mC, 5hmC, and unmodified C at individual CpG sites by leveraging the high-throughput Infinium mouse BeadChip array on bisulphite- and bACE-treated samples. Our systematic investigation provided in vivo evidence that TET1 can have distinct dual contributions in adult cortex physiology.
By comparing the DhMR distributions between Tet1 HxD and Tet1 KO, we successfully parsed out the genomic regions that define TET1’s three different modes of regulation (): bona fide catalytic action (common subset), non-catalytic regulation (KO unique subset), and a third set, which we postulate are regions that are co-regulated with TET2/3 (HxD unique subset). We posit that the common subset relies on TET1 catalytic activity to generate 5hmC as the loss of TET1’s catalytic activity led to pronounced 5hmC loss to similar extent as the TET1 protein ablation. The marked 5hmC loss may be explained by the formative role of TET1 in establishing 5hmC in embryonic brain development and maintaining 5hmC levels in mature neurons at these sites. Longitudinal quantification of Tet paralogs in the brain of early embryos revealed that all Tet paralogs are highly expressed to similar degree at embryonic day 9.5–10.5 [Citation83,Citation84]. In the postnatal brain, however, Tet3 became the most abundant paralog, followed by Tet2 [Citation13]. Despite the lower reported expression of Tet1 in the brain, we have shown that TET1 could play a dominant and non-redundant role in establishing 5hmC levels at the common subset.
In contrast, HxD unique sites experience milder 5hmC loss. A possible explanation for DhMRs that are unique to Tet1 HxD cortices is that they correspond to genomic locations that require cooperation from the three TET paralogs to achieve physiological 5hmC levels. Cooperation between the three Tet paralogs in maintaining 5hmC levels has been observed previously in mESCs [Citation85,Citation86] and a pluripotent embryonic carcinoma cell model [Citation52]. Using knockouts of Tet1 or Tet2, these studies demonstrated the stepwise recruitment of different Tet paralogs to the same sites to oxidize 5mC. One study revealed that TET1 first initiated the 5mC oxidation to 5hmC, which in turn recruited transcription factor Saal-like protein 4A (SALL4A) that stabilized TET2 binding at the sites for subsequent 5fC/5caC oxidation [Citation85]. In another study, Tet2/3 small interfering RNA (siRNA) knockdown reduced 5hmC level at a subset of TET1 recruited sites, strongly suggesting co-dependence of TET paralogs [Citation52]. It has also been demonstrated that TET2 was mainly required to establish 5hmC in the naïve mESCs, while TET1 was subsequently recruited during transition to primed pluripotency [Citation86]. These studies underscored the hierarchical cooperation between the TETs, where one TET paralog has a stronger role in initiating the 5mC to 5hmC oxidation, and subsequently recruits other TET paralogs. It is conceivable that a similar TET1/2/3 co-regulation could operate at the HxD unique sites, where TET1 plays an initiating role of 5mC oxidation, followed by TET2 and/or TET3 at these HxD unique sites. We propose that upon catalytic mutation, Tet1 HxD’s full-length protein could still bind but failed to catalyse 5mC oxidation, thereby blocking TET2 and/or TET3 from accessing and compensating the 5hmC loss. Interestingly, the blocking effect on TET2 and/or TET3 is largely abrogated in the Tet1 HxDHet, potentially suggesting that the restoration of TET1’s catalytic function is instructive for TET1’s timely dissociation from the effector sites and subsequent recruitment of TET2 and/or TET3. Lastly, the KO unique subset encompassed sites that are independent of TET1’s catalytic activity. Studies in mESCs have shown that TET1 could form a complex with binding partners to regulate the underlying chromatin state [Citation14,Citation57,Citation87]. Specifically in the brain, TET1 has been shown to form complex with Early growth response factor 1 (EGR1) [Citation13], methyl CpG binding protein 2 (MeCP2) [Citation88], Hypoxia-inducible factor 1 alpha (HIF1α) [Citation89], and homeobox protein NANOG [Citation90] to modulate neuronal activity, expression of learning genes, stress-induced responses and medulloblastoma progression, respectively.
Furthermore, we found that TET1 predominantly exerts both its catalytic and non-catalytic roles at exons/introns, consistent with the 5hmC distribution observed in previous studies [Citation8,Citation9,Citation12,Citation64,Citation91]. Overall, GO analysis of HxD Unique DhMRS suggested that TET1 catalytic activity is associated with neuronal-specific functions, such as axon guidance, synaptic plasticity, and neuronal differentiation. In contrast, TET1 non-catalytic sites are involved in general cell survival and proliferation functions. Consistent with previous studies that investigated TET1 neuronal functions with either Tet1 overexpression in foetal brain [Citation92] or Tet1 deletion in the adult brain [Citation9,Citation10,Citation12], our data emphasized that these are largely driven by TET1’s canonical catalytic roles.
Our data also indicated that the Tet1 mutations have profound effects on the 5hmC and 5mC levels, while the unmodified C level is significantly but minimally perturbed in the Tet1 mutants. Mechanistically, this result suggests that in post-mitotic neurons, TET1 predominantly impacts the 5mC to 5hmC conversion step within gene bodies, and is minimally involved in the 5fC/5caC-mediated unmodified C restoration downstream. From the biochemistry standpoint, this can be explained by the distributive model of TET1-mediated oxidation [Citation52,Citation93–95]. Biochemical assays that support the distributive model have validated that TET1 dissociates from its DNA substrate after each turnover rather than oxidizing to 5fC/5caC iteratively [Citation52,Citation93–96]. Crystal structure further revealed that TETs have higher activity on 5mC than 5hmC and 5fC as the 5fC/5caC adopted a more restrained conformation within TET’s catalytic pocket. Therefore, it is conceivable that in the adult cortex, TET1 is tuned to initiate the first step of 5mC to 5hmC conversion and is less prone to conduct further oxidation until its activity is stimulated. This evolutionary conserved property of TET1 enabled the generation of 5hmC as a stable epigenetic mark, and not merely an intermediate to be eliminated in the adult cortex, as suggested in previous studies [Citation9,Citation53–56,Citation97]. It is postulated that the stable 5hmC can serve as signal to recruit downstream epigenetic proteins such as EGR1 [Citation13] and HIF1α [Citation89], or repel the binding of 5mC-binding factors such as MeCP2 [Citation8,Citation64].
The relationship between 5hmC abundance and gene expression can be challenging to decipher. Previous studies that interrogated the 5hmC: 5mC ratio in relation to ranked gene expression in cerebellar cell populations observed a high positive correlation between the two [Citation8,Citation64]. Here, we empirically tested this hypothesis by manipulating TET1 activity and leveraging CpG-level resolution to evaluate this relationship in adult cortex. In our experiments, TET1-mediated 5hmC loss could induce a mixture of downregulated and upregulated genes. However, there is little correspondence between DEGs and their methylation status, potentially due to the caveat of using whole cortex with mixed neuronal and non-neuronal cell populations. It is established that TET enzymes and 5hmC are highly enriched in NeuN+ post-mitotic neuronal cells, but less so in immature progenitor and glial cells [Citation10,Citation47,Citation97,Citation98], and gene expression signals are contributed by all cell types. Remarkably, single-cell method that simultaneously measured 5hmC and 5mC levels revealed that 5hmC signal is mostly derived from the neuronal population (~26% in neuronal cells vs ~ 9.5% in nonneuronal cells) in the adult mouse cortex [Citation27]. Importantly, when we focused on the DEGs with methylation changes, many significantly downregulated DEGs displayed corresponding loss of 5hmC and hypermethylation, consistent with the general trend observed in previous studies [Citation8,Citation64]. Further testing with linear regression of the relationship between DEGs and corresponding methylation changes did not meet the statistical cut-off, potentially due to confounding effects of using whole cortex with mixed cells. This emphasized on the importance of using purified neuronal cells for future experiments. Post-mitotic neuronal populations can be captured via fluorescence-activated cell sorting (FACS) with NeuN (or FOX-3 or RBFOX3) markers [Citation99].
Leveraging the ability of the Infinium BeadChip array to measure fractional methylation level at individual CpG sites, we observed that Tet1 manipulation can induce defects in 5mC oxidation to 5mC relative to wildtype at specific DhMRs, as well as changes in global gene expression. Interestingly, we observed that Uniprot analysis of DEGs showed enrichment for genes associated with alternative splicing. This finding suggests a crosstalk between the methylation status of the transcribed DNA template and alternative splicing machinery. Consistent with this, manipulation of TET1 protein and 5hmC levels has consequences in exon definition during alternative splicing [Citation88,Citation100,Citation101]. One proposed mechanism is that intragenic DNA methylation facilitates exon definition by impacting the recruitment of methyl-binding proteins that modulate Polymerase II pausing. One compelling candidate suggested by our transcription factor motif mining at DhMRs is the methyl-CpG-binding protein 2 (MeCP2). Biochemical studies have identified MeCP2 as the most abundant 5mC-reader in the brain [Citation8,Citation64]. MeCP2 binds with high affinity to 5mC and is repelled from 5hmC-enriched DNA. In the context of alternative splicing, the binding of MeCP2 to intragenic 5mC favours exon inclusion by obstructing RNA Polymerase II (RNA Pol II) elongation [Citation88,Citation102].
Another mechanism that links 5hmC distribution to alternative splicing is the enrichment of histone H3K36me3, which is the most prominent histone modification motif in all three DhMR subsets. Other studies have reported the striking correlation between genic 5hmC and H3K36me3 distribution in actively transcribed genes [Citation57,Citation59–63]. It was also observed that preferential H3K36me3 occupancy at exons correlates with exon inclusion [Citation103–107]. Mechanistically, H3K36me3 could affect exon recognition in two ways: H3K36me3 could function as ‘speed bumps’ that slow down RNA Pol II elongation rate, or H3K36me3 could serve as scaffold to recruit splicing factors [Citation107,Citation108].
It has been demonstrated that Tet1 KO mice display a delay in contextual fear memory extinction, potentially due to aberrant downregulation of immediate early genes such as Npas4, cFos, Arc [Citation10–12]. Our study shed light on novel Tet1 catalytic mutant phenotypes. Here, we reported that Tet1 HxD catalytic mutant accumulates high level of lysophospholipids LPC and LPE in the cortex. In the mammalian brain, PC (33%), PE (16%), and cholesterol (30%) are the major building blocks of the neural membrane [Citation109,Citation110]. Their abundance and fatty acid compositions are integral to membrane stability, fluidity, and permeability [Citation109] as well as the sensory signalling of membrane proteins, receptors, and ion channels [Citation110]. Alterations of LPC and LPE lysophospholipid levels have been associated with neurodegenerative diseases and traumatic brain injury [Citation110–113].
The fatty acid compositions of LPC and LPE play a large role in dictating their inflammatory profile. Polyunsaturated fatty acids (PUFAs) such as Arachidonic acid (AA) [20:4] are pro-inflammatory [Citation75–79], while Omega-3 PUFAs such as docosahexaenoic acid (DHA) [22:6] are anti-inflammatory [Citation80]. Therefore, the ratios of AA:DHA are used as markers for chronic inflammation, where high AA:DHA ratio indicates pro-inflammation, mitochondrial dysfunction, and lipotoxicity [Citation112,Citation114–116]. We observed that in Tet1 HxD cortices, the upregulated LPC is mainly the pro-inflammatory species with high AA:DHA ratio. Although we did not directly investigate the neuronal functional consequences of lysophospholipid accumulation in Tet1 HxD, reduced neuronal viablility phenotypes may occur based on analysis of LPC in the brain. Excess LPC has been shown to induce lipotoxicity in neuronal cells either by compromising cell membrane integrity or oxidative stress [Citation117–120]. Furthermore, injection of LPC with long fatty acid side chain (16:0, 18:0) induced lipotoxicity that correlated with brain injury [Citation113,Citation120,Citation121]. Excess LPC also induced neuronal cone collapse and neuronal death through excessive calcium influx in neurons [Citation122,Citation123]. It will be interesting to dissect how Tet-mediated 5hmC could contribute to the lysophospholipid accumulation in future experiments. For instance, mutating the methylation sites of metabolic enzymes involved in lysophospholipid metabolism, or measuring the post-translational changes in these metabolic enzymes could shed lights on the underlying mechanisms. Together, our study showed that Tet1 catalytic mutation alone could manifest in previously underappreciated lysophospholipid phenotype in the cortex.
In summary, our work has shown that Tet1 HxD does not completely phenocopy Tet1 KO in terms of methylation profile, gene expression and phenotypic outcomes, providing evidence that TET1 is linked to distinct cortical functions through its catalytic and non-catalytic roles. Our novel Tet1 HxD mouse model combined with careful parsing of the 5hmC and 5mC at individual CpG levels have provided an in vivo platform to investigate the regulatory roles of TET1. This led us to uncover the biological role of TET1’s catalytic activity in maintaining cortical membrane lipidomics. Our findings underscore the importance of investigating the relative contributions of TET1’s enzymatic and non-enzymatic actions in the development of other tissues or pathological contexts.
Supplemental Material
Download MS Word (23.9 KB)Supplemental Material
Download MS Word (2.7 MB)TableS7_Revision.xlsx
Download MS Excel (11.7 KB)TableS6_Revision.xlsx
Download MS Excel (2.2 MB)TableS8_Revision.xlsx
Download MS Excel (42.1 KB)TableS4_Revision.xlsx
Download MS Excel (10.7 KB)TableS9_Revision.xlsx
Download MS Excel (11.1 KB)TableS1_Revision.xlsx
Download MS Excel (9 KB)TableS2_Revision.xlsx
Download MS Excel (9 KB)TableS5_Revision.xlsx
Download MS Excel (9.1 KB)TableS3_Revision.xlsx
Download MS Excel (9.6 KB)Disclosure statement
No potential conflict of interest was reported by the author(s).
Data Availability Statement
Sequencing data have been deposited in GEO database under the accession number GSE271375 and GSE271376.
Supplementary material
Supplemental data for this article can be accessed online at https://doi.org/10.1080/15592294.2024.2374979
Additional information
Funding
References
- Wu X, Zhang Y. TET-mediated active DNA demethylation: mechanism, function and beyond. Nat Rev Genet. 2017;18(9):517–24. doi: 10.1038/nrg.2017.33
- Kohli RM, Zhang Y. REVIEW TET enzymes, TDG and the dynamics of DNA demethylation. Nature. 2013;502(7472):472–479. doi: 10.1038/nature12750
- Hu L, Li Z, Cheng J, et al. Crystal structure of TET2-DNA complex: insight into TET-Mediated 5mC oxidation. Cell. 2013;155(7):1545–1555. doi: 10.1016/j.cell.2013.11.020
- Tahiliani M, Koh KP, Shen Y, et al. Conversion of 5-methylcytosine to 5-hydroxymethylcytosine in mammalian DNA by MLL partner TET1. Science. 2009;324(5929):930–935. doi: 10.1126/science.1170116
- Lorsback RB, Moore J, Mathew S, et al. TET1, a member of a novel protein family, is fused to MLL in acute myeloid leukemia containing the t(10;11)(q22;23) [3]. Leukemia. 2003;17(3):637–641. doi: 10.1038/sj.leu.2402834
- Ono R, Taki T, Taketani T, et al. LCX, leukemia-associated protein with a CXXC domain, is fused to MLL in acute myeloid leukemia with trilineage dysplasia having t(10;11)(q22;q23). Cancer Res. 2002;62(62):4075–4080.
- Münzel M, Globisch D, Brückl T, et al. Quantification of the sixth DNA base hydroxymethylcytosine in the brain. Angew Chem - Int Ed. 2010;49(31):5375–5377. doi: 10.1002/anie.201002033
- Mellén M, Ayata P, Heintz N. 5-hydroxymethylcytosine accumulation in postmitotic neurons results in functional demethylation of expressed genes. Proc Natl Acad Sci USA. 2017;114(37):E7812–E7821. doi: 10.1073/pnas.1708044114
- Szulwach KE, Li X, Li Y, et al. Integrating 5-hydroxymethylcytosine into the epigenomic landscape of human embryonic stem cells. PLOS Genet. 2011;7(6):e1002154. doi: 10.1371/journal.pgen.1002154
- Kaas GA, Zhong C, Eason D, et al. TET1 controls CNS 5-Methylcytosine Hydroxylation, active DNA demethylation, gene transcription, and memory formation. Neuron. 2013;79(6):1086–1093. doi: 10.1016/j.neuron.2013.08.032
- Kumar D, Aggarwal M, Kaas GA, et al. Tet1 oxidase regulates neuronal gene transcription, active DNA hydroxymethylation, object location memory, and threat recognition memory. Neuroepigenetics. 2015;4:12–27. doi: 10.1016/j.nepig.2015.10.002
- Rudenko A, Dawlaty M, Seo J, et al. Tet1 is critical for neuronal activity-regulated gene expression and memory extinction. Neuron. 2013;79(6):1109–1122. doi: 10.1016/j.neuron.2013.08.003
- Sun Z, Xu X, He J, et al. EGR1 recruits TET1 to shape the brain methylome during development and upon neuronal activity. Nat Commun. 2019;10(1):1–12. doi: 10.1038/s41467-019-11905-3
- Chrysanthou S, Tang Q, Lee J, et al. The DNA dioxygenase Tet1 regulates H3K27 modification and embryonic stem cell biology independent of its catalytic activity. Nucleic Acids Res. 2022;50(6):3169–3189. doi: 10.1093/nar/gkac089
- Williams K, Christensen J, Pedersen MT, et al. TET1 and hydroxymethylcytosine in transcription and DNA methylation fidelity. Nature. 2011;473(7347):343–348. doi: 10.1038/nature10066
- Tsai Y, Chen H-F, Chen S-Y, et al. TET1 regulates hypoxia-induced epithelial-mesenchymal transition by acting as a co-activator. Genome Biol. 2014;15(12):1–13. doi: 10.1186/s13059-014-0513-0
- Ito K, Lee J, Chrysanthou S, et al. Non-catalytic roles of Tet2 are essential to regulate hematopoietic stem and progenitor cell homeostasis. Cell Rep. 2019;28(10):2480–2490.e4. doi: 10.1016/j.celrep.2019.07.094
- Ko M, Huang Y, Jankowska AM, et al. Impaired hydroxylation of 5-methylcytosine in myeloid cancers with mutant TET2. Nature. 2010;468(7325):839–843. doi: 10.1038/nature09586
- Caldwell BA, Liu MY, Prasasya RD, et al. Functionally distinct roles for TET-oxidized 5-methylcytosine bases in somatic reprogramming to pluripotency. Mol Cell. 2021;81(4):859–869.e8. doi: 10.1016/j.molcel.2020.11.045
- Prasasya RD, Caldwell BA, Liu Z, et al. Iterative oxidation by TET1 is required for reprogramming of imprinting control regions and patterning of mouse sperm hypomethylated regions. Dev Cell. 2024;59(8):1010–1027.e8. doi: 10.1016/j.devcel.2024.02.012
- Dawlaty M, Breiling A, Le T, et al. Combined deficiency of Tet1 and Tet2 Causes Epigenetic Abnormalities but is compatible with postnatal development. Dev Cell. 2013;24(3):310–323. doi: 10.1016/j.devcel.2012.12.015
- Zhou W, Hinoue T, Barnes B, et al. DNA methylation dynamics and dysregulation delineated by high-throughput profiling in the mouse. Cell Genomics. 2022;2(7):100144. doi: 10.1016/j.xgen.2022.100144
- Schutsky EK, DeNizio JE, Hu P, et al. Nondestructive, base-resolution sequencing of 5-hydroxymethylcytosine using a DNA deaminase. Nat Biotechnol. 2018;36(11):1083–1090. doi: 10.1038/nbt.4204
- Song C, Szulwach KE, Fu Y, et al. Selective chemical labeling reveals the genome-wide distribution of 5-hydroxymethylcytosine. Nat Biotechnol. 2011;29(1):68–72. doi: 10.1038/nbt.1732
- Dawlaty MM, Ganz K, Powell B, et al. Tet1 is dispensable for maintaining pluripotency and its loss is compatible with embryonic and postnatal development. Cell Stem Cell. 2011;9(2):166–175. doi: 10.1016/j.stem.2011.07.010
- Juan AM, Foong YH, Thorvaldsen JL, et al. Tissue-specific Grb10/Ddc insulator drives allelic architecture for cardiac development. Mol Cell. 2022;82(19):3613–3631.e7. doi: 10.1016/j.molcel.2022.08.021
- Fabyanic EB, Hu P, Qiu Q, et al. Joint single-cell profiling resolves 5mC and 5hmC and reveals their distinct gene regulatory effects. Nat Biotechnol. 2023;42(6):960–974. doi: 10.1038/s41587-023-01909-2
- Wang T, Luo M, Berrios KN, et al. Bisulfite-Free Sequencing of 5-Hydroxymethylcytosine with APOBEC-Coupled Epigenetic Sequencing (ACE-Seq). Methods Mol Biol. 2021;2198:194–201.
- Vrooman LA, Rhon-Calderon EA, Suri KV, et al. Placental abnormalities are Associated with Specific Windows of Embryo Culture in a mouse Model. Front Cell Dev Biol. 2022;10:884088. doi: 10.3389/fcell.2022.884088
- Mani S, Ghosh J, Rhon-Calderon EA, et al. Embryo cryopreservation leads to sex-specific DNA methylation perturbations in both human and mouse placentas. Hum Mol Genet. 2022;31(22):3855–3872. doi: 10.1093/hmg/ddac138
- Wang D, Ho ES, Cotticelli MG, et al. Skin fibroblast metabolomic profiling reveals that lipid dysfunction predicts the severity of Friedreich’s ataxia. J Lipid Res. 2022;63(9):100255. doi: 10.1016/j.jlr.2022.100255
- Wang S, Blair IA, C M. Analytical methods for mass spectrometry-based metabolomics studies. Adv Exp Med Biol. 2019;1140:3–12.
- Pang Z, Chong J, Zhou G, et al. MetaboAnalyst 5.0: narrowing the gap between raw spectra and functional insights. Nucleic Acids Res. 2021;49(W1):W388–W396. doi: 10.1093/nar/gkab382
- Information, I. Scientific T. XcaliburTM 4.3 Release Notes. 2019;XCALI-98088:1–6.
- Zhou W, Triche TJ, Laird PW, et al. SeSAMe: reducing artifactual detection of DNA methylation by infinium BeadChips in genomic deletions. Nucleic Acids Res. 2018;46:1–15. doi:10.1093/nar/gky691
- Larsson J, Godfrey J, Gustafsson P, et al. eulerr: Area-Proportional Euler and Venn Diagrams with Ellipses. CRAN. 2024. https://jolars.github.io/eulerr/
- Yu G, Wang LG, Han Y, et al. ClusterProfiler: an R package for comparing biological themes among gene clusters. Omics J Integr Biol. 2012;16(5):284–287. doi: 10.1089/omi.2011.0118
- Dobin A, Davis CA, Schlesinger F, et al. STAR: Ultrafast universal RNA-seq aligner. Bioinformatics. 2013;29(1):15–21. doi: 10.1093/bioinformatics/bts635
- Li H, Handsaker B, Wysoker A, et al. The Sequence Alignment/Map format and SAMtools. Bioinformatics. 2009;25(16):2078–2079. doi: 10.1093/bioinformatics/btp352
- Pertea M, Pertea GM, Antonescu CM, et al. StringTie enables improved reconstruction of a transcriptome from RNA-seq reads. Nat Biotechnol. 2015;33(3):290–295. doi: 10.1038/nbt.3122
- Love MI, Huber W, Anders S. Moderated estimation of fold change and dispersion for RNA-seq data with DESeq2. Genome Biol. 2014;15(12):1–21. doi: 10.1186/s13059-014-0550-8
- Heiss JA, Brennan KJ, Baccarelli AA, et al. Battle of epigenetic proportions: comparing Illumina’s EPIC methylation microarrays and TruSeq targeted bisulfite sequencing. Epigenetics. 2020;15(1–2):174–182. doi: 10.1080/15592294.2019.1656159
- Zhou L, Ng HK, Drautz-Moses DI, et al. Systematic evaluation of library preparation methods and sequencing platforms for high-throughput whole genome bisulfite sequencing. Sci Rep. 2019;9(1):1–17. doi: 10.1038/s41598-019-46875-5
- Martin EM, Grimm SA, Xu Z, et al. Beadchip technology to detect DNA methylation in mouse faithfully recapitulates whole-genome bisulfite sequencing. Epigenomics. 2023;15(3):115–129. doi: 10.2217/epi-2023-0034
- Schutsky E, DeNizio JE, Hu P, et al. Nondestructive, base-resolution sequencing of 5-hydroxymethylcytosine using a DNA deaminase. Nat Biotechnol. 2018;36(11):1083–1090. doi: 10.1038/nbt.4204
- Wagner M, Steinbacher J, Kraus TFJ, et al. Age-Dependent Levels of 5-Methyl-, 5-Hydroxymethyl-, and 5-Formylcytosine in Human and Mouse Brain Tissues. Angew Chem - Int Ed. 2015;54(42):12511–12514. doi: 10.1002/anie.201502722
- Szulwach KE, Li X, Li Y, et al. 5-hmC–mediated epigenetic dynamics during postnatal neurodevelopment and aging. Nat Neurosci. 2011;14(12):1607–1616. doi: 10.1038/nn.2959
- de la Rica L, Deniz Ö, Cheng KCL, et al. TET-dependent regulation of retrotransposable elements in mouse embryonic stem cells. Genome Biol. 2016;17(1):1–14. doi: 10.1186/s13059-016-1096-8
- Stolz P, Mantero AS, Tvardovskiy A, et al. TET1 regulates gene expression and repression of endogenous retroviruses independent of DNA demethylation. Nucleic Acids Res. 2022;50(15):8491–8511. doi: 10.1093/nar/gkac642
- Van Der Veer BK, Chen L, Custers C, et al. Dual functions of TET1 in germ layer lineage bifurcation distinguished by genomic context and dependence on 5-methylcytosine oxidation. Nucleic Acids Res. 2023;51(11):5469–5498. doi: 10.1093/nar/gkad231
- Yuita H, López-Moyado IF, Jeong H, et al. Inducible disruption of Tet genes results in myeloid malignancy, readthrough transcription, and a heterochromatin-to-euchromatin switch. Proc Natl Acad Sci. 2023;120(6). doi: 10.1073/pnas.2214824120
- Putiri EL, Tiedemann RL, Thompson JJ, et al. Distinct and overlapping control of 5-methylcytosine and 5-hydroxymethylcytosine by the TET proteins in human cancer cells. Genome Biol. 2014;15(6):1–20. doi: 10.1186/gb-2014-15-6-r81
- Hahn MA, Qiu R, Wu X, et al. Dynamics of 5-Hydroxymethylcytosine and chromatin marks in Mammalian Neurogenesis. Cell Rep. 2013;3(2):291–300. doi: 10.1016/j.celrep.2013.01.011
- Hahn MA, Szabó PE, Pfeifer GP. 5-Hydroxymethylcytosine: A stable or transient DNA modification? Genomics. 2014;104(5):314–323. doi: 10.1016/j.ygeno.2014.08.015
- MacArthur IC, Dawlaty MM. TET enzymes and 5-hydroxymethylcytosine in neural progenitor cell biology and neurodevelopment. Front Cell Dev Biol. 2021;9:1–8. doi:10.3389/fcell.2021.645335
- He XB, Kim M, Kim S-Y, et al. Vitamin C facilitates dopamine neuron differentiation in fetal midbrain through TET1- and JMJD3-dependent epigenetic control manner. Stem Cells. 2015;33(4):1320–1332. doi: 10.1002/stem.1932
- Wu H, D’Alessio AC, Ito S, et al. Dual functions of Tet1 in transcriptional regulation in mouse embryonic stem cells. Nature. 2011;473(7347):389–393. doi: 10.1038/nature09934
- Mikkelsen TS, Ku M, Jaffe DB, et al. Genome-wide maps of chromatin state in pluripotent and lineage-committed cells. Nature. 2007;448(7153):553–560. doi: 10.1038/nature06008
- Wu F, Li X, Looso M, et al. Spurious transcription causing innate immune responses is prevented by 5-hydroxymethylcytosine. Nature Genet. 2023;55(1):100–111. doi: 10.1038/s41588-022-01252-3
- Tsagaratou A, Lio CWJ, Yue X, et al. TET methylcytosine oxidases in T cell and B cell development and function. Front Immunol. 2017;8:1–15. doi: 10.3389/fimmu.2017.00220
- Thomson JP, Hunter JM, Nestor CE, et al. Comparative analysis of affinity-based 5-hydroxymethylation enrichment techniques. Nucleic Acids Res. 2013;41(22):e206–e206. doi: 10.1093/nar/gkt1080
- Lio CWJ, Rao A. TET enzymes and 5hMC in adaptive and innate immune systems. Front Immunol. 2019;10:1–13. doi: 10.3389/fimmu.2019.00210
- Cui XL, Nie J, Ku J, et al. A human tissue map of 5-hydroxymethylcytosines exhibits tissue specificity through gene and enhancer modulation. Nat Commun. 2020;11(1):1–11. doi: 10.1038/s41467-020-20001-w
- Mellén M, Ayata P, Dewell S, et al. MeCP2 binds to 5hmC enriched within active genes and accessible chromatin in the nervous system. Cell. 2012;151(7):1417–1430. doi: 10.1016/j.cell.2012.11.022
- Leung SK, Jeffries AR, Castanho I, et al. Full-length transcript sequencing of human and mouse cerebral cortex identifies widespread isoform diversity and alternative splicing. Cell Rep. 2021;37(7):110022. doi: 10.1016/j.celrep.2021.110022
- Wang X, Yu H, Gao R, et al. A comprehensive review of the family of very-long-chain fatty acid elongases: structure, function, and implications in physiology and pathology. Eur J Med Res. 2023;28(1):1–12. doi: 10.1186/s40001-023-01523-7
- Yamashita A, Hayashi Y, Nemoto-Sasaki Y, et al. Acyltransferases and transacylases that determine the fatty acid composition of glycerolipids and the metabolism of bioactive lipid mediators in mammalian cells and model organisms. Prog Lipid Res. 2014;53:18–81. doi: 10.1016/j.plipres.2013.10.001
- Shindou H, Shimizu T. Acyl-CoA: lysophospholipid acyltransferases. J Biol Chem. 2009;284(1):1–5. doi: 10.1074/jbc.R800046200
- Singh AB, Kan CFK, Kraemer FB, et al. Liver-specific knockdown of long-chain acyl-CoA synthetase 4 reveals its key role in VLDL-TG metabolism and phospholipid synthesis in mice fed a high-fat diet. Am J Physiol - Endocrinol Metab. 2019;316(5):E880–E894. doi: 10.1152/ajpendo.00503.2018
- Rodencal J, Dixon SJ. A tale of two lipids: lipid unsaturation commands ferroptosis sensitivity. Proteomics. 2023;23(6):1–14. doi: 10.1002/pmic.202100308
- Kim JW, Lee JY, Oh M, et al. An integrated view of lipid metabolism in ferroptosis revisited via lipidomic analysis. Exp Mol Med. 2023;55(8):1620–1631. doi: 10.1038/s12276-023-01077-y
- He M, Kuk ACY, Ding M, et al. Spns1 is a lysophospholipid transporter mediating lysosomal phospholipid salvage. Proc Natl Acad Sci USA. 2022;119(40). doi: 10.1073/pnas.2210353119
- Zhang YZ, Sui X, Xu Y, et al. NLRP3 inflammasome and lipid metabolism analysis based on UPLC-Q-TOF-MS in gouty nephropathy. Int J Mol Med. 2019;44:172–184. doi: 10.3892/ijmm.2019.4176
- Hishikawa D, Hashidate T, Shimizu T, et al. Diversity and function of membrane glycerophospholipids generated by the remodeling pathway in mammalian cells. J Lipid Res. 2014;55(5):799–807. doi: 10.1194/jlr.R046094
- Bowman ER, Kulkarni M, Gabriel J, et al. Altered Lipidome Composition Is Related to markers of monocyte and immune activation in antiretroviral therapy treated human immunodeficiency virus (HIV) infection and in uninfected persons. Front Immunol. 2019;10:785. doi: 10.3389/fimmu.2019.00785
- Oestvang J, Anthonsen MW, Johansen B. LysoPC and PAF Trigger Arachidonic Acid Release by Divergent Signaling Mechanisms in Monocytes. J Lipids. 2011;2011:1–11. doi: 10.1155/2011/532145
- Rong X, Albert C, Hong C, et al. LXRs regulate ER stress and inflammation through dynamic modulation of membrane phospholipid composition. Cell Metab. 2013;18(5):685–697. doi: 10.1016/j.cmet.2013.10.002
- Higgins AJ, Lees P. The acute inflammatory process, arachidonic acid metabolism and the mode of action of anti‐inflammatory drugs. Equine Vet J. 1984;16(3):163–175. doi: 10.1111/j.2042-3306.1984.tb01893.x
- Tallima H, El Ridi R. Arachidonic acid: physiological roles and potential health benefits – a review. J Adv Res. 2018;11:33–41. doi:10.1016/j.jare.2017.11.004
- Calder PC. Omega-3 fatty acids and inflammatory processes. Nutrients. 2010;2(3):355–374. doi: 10.3390/nu2030355
- Yu H, Su Y, Shin J, et al. Tet3 regulates synaptic transmission and homeostatic plasticity via DNA oxidation and repair. Nat Neurosci. 2015;18(6):836–843. doi: 10.1038/nn.4008
- Greer CB, Wright J, Weiss JD, et al. Tet1 isoforms differentially regulate gene expression, synaptic transmission, and memory in the mammalian brain. J Neurosci. 2021;41(4):578–593. doi: 10.1523/JNEUROSCI.1821-20.2020
- Hahn MA, Qiu R, Wu X, et al. Report Dynamics of 5-Hydroxymethylcytosine and Chromatin Marks in Mammalian Neurogenesis. CellReports. 2013;3(2):291–300. doi: 10.1016/j.celrep.2013.01.011
- Khoueiry R, Sohni A, Thienpont B, et al. Lineage-specific functions of TET1 in the postimplantation mouse embryo. Nat Genet. 2017;49(7):1061–1072. doi: 10.1038/ng.3868
- Xiong J, Zhang Z, Chen J, et al. Cooperative action between SALL4A and TET proteins in stepwise oxidation of 5-Methylcytosine. Mol Cell. 2016;64(5):913–925. doi: 10.1016/j.molcel.2016.10.013
- Mulholland CB, Traube FR, Ugur E, et al. Distinct and stage-specific contributions of TET1 and TET2 to stepwise cytosine oxidation in the transition from naive to primed pluripotency. Sci Rep. 2020;10(1):1–12. doi: 10.1038/s41598-020-68600-3
- Hrit J, Goodrich L, Li C, et al. OGT binds a conserved C-terminal domain of TET1 to regulate TET1 activity and function in development. Elife. 2018:e34870 1–23.
- Zheng Z, Ambigapathy G, Keifer J. MeCP2 regulates Tet1-catalyzed demethylation, CTCF binding, and learning-dependent alternative splicing of the BDNF gene in Turtle. Elife. 2017;6:1–22. doi:10.7554/eLife.25384
- Cheng Y, Sun M, Chen L, et al. Ten-eleven translocation proteins modulate the response to environmental stress in mice. Cell Rep. 2018;25(11):3194–3203.e4. doi: 10.1016/j.celrep.2018.11.061
- Kim H, Kang Y, Li Y, et al. Ten-eleven translocation protein 1 modulates medulloblastoma progression. Genome Biol. 2021;22(1):1–25. doi: 10.1186/s13059-021-02352-9
- Ehrlich M, Ehrlich KC. DNA cytosine methylation and hydroxymethylation at the borders. Epigenomics. 2014;6(6):563–566. doi: 10.2217/epi.14.48
- Kim H, Jang WY, Kang M-C, et al. TET1 contributes to neurogenesis onset time during fetal brain development in mice. Biochem Biophys Res Commun. 2016;471(4):437–443. doi: 10.1016/j.bbrc.2016.02.060
- Hashimoto H, Pais JE, Dai N, et al. Structure of naegleria tet-like dioxygenase (NgTet1) in complexes with a reaction intermediate 5-hydroxymethylcytosine DNA. Nucleic Acids Res. 2015;43(22):10713–10721. doi: 10.1093/nar/gkv870
- Tamanaha E, Guan S, Marks K, et al. Distributive processing by the Iron(II)/α-Ketoglutarate-dependent Catalytic Domains of the TET Enzymes Is Consistent with epigenetic roles for oxidized 5-methylcytosine bases. J Am Chem Soc. 2016;138(30):9345–9348. doi: 10.1021/jacs.6b03243
- Xu L, Chen Y-C, Chong J, et al. Pyrene‐Based quantitative detection of the 5‐Formylcytosine loci symmetry in the CpG duplex content during TET‐Dependent demethylation. Angew Chem. 2014;126(42):11405–11409. doi: 10.1002/ange.201406220
- An J, Rao A, Ko M. TET family dioxygenases and DNA demethylation in stem cells and cancers. Exp Mol Med. 2017;49(4):e323–e323. doi: 10.1038/emm.2017.5
- Bachman M, Uribe-Lewis S, Yang X, et al. 5-hydroxymethylcytosine is a predominantly stable DNA modification. Nat Chem. 2014;6(12):1049–1055. doi: 10.1038/nchem.2064
- Wheldon LM, Abakir A, Ferjentsik Z, et al. Transient accumulation of 5-carboxylcytosine indicates involvement of active demethylation in lineage specification of neural stem cells. Cell Rep. 2014;7(5):1353–1361. doi: 10.1016/j.celrep.2014.05.003
- Bowles KR, Julia TCW, Qian L, et al. Reduced variability of neural progenitor cells and improved purity of neuronal cultures using magnetic activated cell sorting. PLOS ONE. 2019;14(3):1–18. doi: 10.1371/journal.pone.0213374
- Shayevitch R, Askayo D, Keydar I, et al. The importance of DNA methylation of exons on alternative splicing. RNA. 2018;24(10):1351–1362. doi: 10.1261/rna.064865.117
- Marina RJ, Sturgill D, Bailly MA, et al. TET -catalyzed oxidation of intragenic 5-methylcytosine regulates CTCF -dependent alternative splicing. Embo J. 2016;35(3):335–355. doi: 10.15252/embj.201593235
- Maunakea AK, Nagarajan RP, Bilenky M, et al. Conserved role of intragenic DNA methylation in regulating alternative promoters. Nature. 2010;466(7303):253–257. doi: 10.1038/nature09165
- Luco RF, Pan Q, Tominaga K, et al. Regulation of alternative splicing by histone modifications published by: american association for the advancement of science linked references are available on JSTOR for this article: regulation of alternative splicing by histone modifications. Science. 2010;327(5968):996–1000. doi: 10.1126/science.1184208
- Andersson R, Enroth S, Rada-Iglesias A, et al. Nucleosomes are well positioned in exons and carry characteristic histone modifications. Genome Res. 2009;19(10):1732–1741. doi: 10.1101/gr.092353.109
- Kolasinska-Zwierz P, Down T, Latorre I, et al. Differential chromatin marking of introns and expressed exons by H3K36me3. Nat Genet. 2009;41(3):376–381. doi: 10.1038/ng.322
- Tilgner H, Nikolaou C, Althammer S, et al. Nucleosome positioning as a determinant of exon recognition. Nat Struct Mol Biol. 2009;16(9):996–1001. doi: 10.1038/nsmb.1658
- Schwartz S, Meshorer E, Ast G. Chromatin organization marks exon-intron structure. Nat Struct Mol Biol. 2009;16(9):990–995. doi: 10.1038/nsmb.1659
- Kornblihtt AR. Chromatin, transcript elongation and alternative splicing. Nat Struct Mol Biol. 2006;13(1):5–7. doi: 10.1038/nsmb0106-5
- Farooqui AA, Horrocks LA, Farooqui T. Glycerophospholipids in brain: their metabolism, incorporation into membranes, functions, and involvement in neurological disorders. Chem Phys Lipids. 2000;106(1):1–29. doi: 10.1016/S0009-3084(00)00128-6
- Yoon JH, Seo Y, Jo YS, et al. Brain lipidomics: from functional landscape to clinical significance. Sci Adv. 2022;8(37):1–15. doi: 10.1126/sciadv.adc9317
- Wang D, Cheng SL, Fei Q, et al. Metabolic profiling identifies phospholipids as potential serum biomarkers for schizophrenia. Psychiatry Res. 2019;272:18–29. doi: 10.1016/j.psychres.2018.12.008
- Cheng D, et al. Lipid pathway alterations in parkinson’s disease primary visual cortex. PLOS ONE. 2011;6. doi: 10.1371/journal.pone.0017299
- Ojo JO, Algamal M, Leary P, et al. Converging and differential brain phospholipid dysregulation in the pathogenesis of repetitive mild traumatic brain injury and Alzheimer’s disease. Front Neurosci. 2019;13:1–17. doi: 10.3389/fnins.2019.00103
- Lotrich FE, Sears B, McNamara RK. Elevated ratio of arachidonic acid to long-chain omega-3 fatty acids predicts depression development following interferon-alpha treatment: relationship with interleukin-6. Brain Behav Immun. 2013;31:48–53. doi:10.1016/j.bbi.2012.08.007
- Nelson JR, Raskin S. The eicosapentaenoic acid: arachidonic acid ratio and its clinical utility in cardiovascular disease. Postgrad Med. 2019;131(4):268–277. doi: 10.1080/00325481.2019.1607414
- Ghazali R, Mehta KJ, Bligh SA, et al. High omega arachidonic acid/docosahexaenoic acid ratio induces mitochondrial dysfunction and altered lipid metabolism in human hepatoma cells. World J Hepatol. 2020;12(3):84–98. doi: 10.4254/wjh.v12.i3.84
- Kim EA, Ae Kim J, Park MH, et al. Lysophosphatidylcholine induces endothelial cell injury by nitric oxide production through oxidative stress. J Matern Fetal Neonatal Med. 2009;22(4):325–331. doi: 10.1080/14767050802556075
- Henriksen JR, Andresen TL, Feldborg LN, et al. Understanding detergent effects on lipid membranes: a Model study of Lysolipids. Biophys J. 2010;98(10):2199–2205. doi: 10.1016/j.bpj.2010.01.037
- Engel KM, Schiller J, Galuska CE, et al. Phospholipases and reactive oxygen species derived lipid biomarkers in healthy and Diseased Humans and animals – a focus on Lysophosphatidylcholine. Front Physiol. 2021;12:732319. doi:10.3389/fphys.2021.732319
- Plemel JR, Michaels NJ, Weishaupt N, et al. Mechanisms of lysophosphatidylcholine‐induced demyelination: A primary lipid disrupting myelinopathy. Glia. 2018;66(2):327–347. doi: 10.1002/glia.23245
- Allen J, Pham L, Bond ST, et al. Acute effects of single and repeated mild traumatic brain injury on levels of neurometabolites, lipids, and mitochondrial function in male rats. Front Mol Neurosci. 2023;16:1208697. doi: 10.3389/fnmol.2023.1208697
- Zheng L, Xie C, Zheng J, et al. An imbalanced ratio between PC(16: 0/16: 0) and LPC(16: 0) revealed by lipidomics supports the role of the lands cycle in ischemic brain injury. J Biol Chem. 2021;296:100151. doi: 10.1074/jbc.RA120.016565
- Sun Y, Lee J-H, Kim N-H, et al. Lysophosphatidylcholine-induced apoptosis in H19-7 hippocampal progenitor cells is enhanced by the upregulation of fas ligand. Biochim Biophys Acta BBA - Mol Cell Biol Lipids. 2009;1791(1):61–68. doi: 10.1016/j.bbalip.2008.09.007