
ABSTRACT
Electric potential differences in living plants are explained by theories based on sap flow. In order to acquire more advanced knowledge about the spatial distribution of these electric potential measures in trees, this research aims to analyze electrical signals in a population of Aleppo pines (Pinus halepensis Mill.) in a representative Mediterranean forest ecosystem.
The specific research objective is to assess some of the most significant factors that influence the distribution pattern of those electric signals: tree age, measurement type and electrode placement.
The research has been conducted in representative forest stands, obtaining measurements of different representative trees. After a statistical evaluation of the obtained results, the main conclusions of our research are:
A.Tree maturity influences directly on electric potential.
B.Maximum electrical signals can be measured in young pines showing values of 0.6 V and 0.6 µA for voltage and current, respectively.
C.The distribution patterns of both voltage and short-circuit current depending on electrode placement are uniform.
1. Introduction
Plants have electrical activity; this fact was first revealed by Burdon-Sanderson1 and DarwinCitation2 by observing insectivorous plants. BoseCitation3 and then PickardCitation4 evidenced the existence of action potentials in some plants regardless of the presence of rapid leaf movements. Regarding trees, Wright and FisherCitation5 detected the existence of a difference in continuous electrical potential between the electrodes inserted in the tree’s phloem and the surrounding soil.
There are both, physical and biological hypotheses to explain the origin of the electrical signals measured in plants that have been scientifically documented.
On one hand, the biological hypothesis establishes that different parts of the plants develop in their evolution—an internal system.Citation6 Following this, the transmission of electrical signals at the cellular level activates physiological responses to external environmental stimuli.Citation6 In this context, different studies have reported the effect of different stimuli, such as light conditions,Citation7,Citation8 temperature variations,Citation9–Citation13 and mechanical wounds.Citation6,Citation14
According to some authorsCitation6,Citation15-Citation18 the variation of the electrical signals depends on the intensity of the stimulation that could be associated with changes in water tension or ion concentrations, creating a transient electrochemical imbalance. These electrical signals would be transmitted through the living cells of plants. Understanding mechanisms of electrical responses, changes in physiological processes and predicting responses to stress factors requires mathematical modeling of electrical activity in plant organisms, a review of such models can be found in Sukhova.Citation19
On the other hand, the physical hypothesis is based on the fact that trees continuously suck water, nutrients and charged particles into the xylem by transpiration.Citation15,Citation20 In this process, a pH imbalance is created between the tree and the soil, which causes an electric current that circulates between different parts of the trees.Citation20 Several experiments to support this hypothesis are available in different studies, e.g., the phloem,Citation15 the xylem and the leaves,Citation20 as well as other elements of the living tree and the adjacent soil.Citation21
Another physical theory is based on the fact that the electric current is the result of the electrokinetic phenomenon, which is caused by the movement of liquids in a porous medium.Citation22,Citation23 In order to model the physical models behind this potential, it is necessary to perform the experiments under the controlled conditions of a laboratory. Additionally, several works have been done with agricultural species under laboratory conditions.Citation6,Citation24-Citation26 We also have to take into account that some of these studies are limited only to analyzing just the voltage data.Citation23,Citation27
All these requirements make it difficult the researches about trees in forests, which could explain the reduced number of publications found. For example, the studies inCitation20,Citation21,Citation28,Citation29 observed electrical signals in individual trees, which do not allow analyzing the variability between individuals in an ecosystem. Furthermore, the few investigations that we have been able to document have been carried out mainly in Continental and central European climatic areas, e.g., Aesculus hippocastanumCitation30 and Populus nigraCitation23 both in France, Eucalyptus globulus in Portugal,Citation30 Salix alba in Austria,Citation31 Quercus spp. and Fagus sylvatica.Citation32,Citation33
Consequently, rigorous analysis of electrical signals has not been found related to, neither coniferous species nor Mediterranean ecosystems. For these reasons, the present study aims to fill this lack of knowledge. Focusing on the characterization and analysis of the electric signals under natural conditions (outside laboratories) exploring the behavior of the two components of electrical signals (voltage and short-circuit current (ISC)) in a representative population of Aleppo pines (Pinus halepensis Mill.) in the Mediterranean area.
A suitable application of these electrical signals measures is the idea of using plants as biosensors. This idea has been studied by other authors in research laboratories under controlled conditions.Citation24–Citation26,Citation34 In order to use trees in the wild forest as biosensors, we have to face the problem of the lack of information on electrical signals in natural uncontrolled conditions. Thus, we consider it necessary to create a good research base on the behavior of those electrical signals of trees, both statically and dynamically.
In the present work, we have evaluated the most significant static factors that influence on the distribution of voltage and ISC electrical signals, specifically: i) the influence of tree age, ii) the electrode placement (height and orientation of the assignment) and iii) the measurement settings (bipolar or referenced to ground setups).
2. Material and methods
Next, we describe the principal material and methods used in this study, which was carried out outside laboratory in representative pine trees belonging to a Mediterranean forest.
2.1 Sample stands
Conifer species are very representative of the Mediterranean area, and one of the most important of them is the Aleppo pine (Pinus halepensis Mill.).Citation35–Citation39 We surveyed a series of potential forests for this study using the layers for the Geographical Information System (GIS) of the Spanish National Forest Inventory.Citation40 We look for pole and pure mature stands of Pinus halepensis in Eastern Spain. Because of the different physiological behavior of the trees according to the age,Citation15,Citation41 we include the tree age as a critical variable in the research design and in the sample stands selection. Thus, to capture a representative tree population in these forests, we considered the following forest characteristics:
An arboreal population of the same species (pure stands),
Enough specimens for each age group,
A not affected area (at least in the last years) by substantial environmental disturbances (forest fires, pests or snow damages).
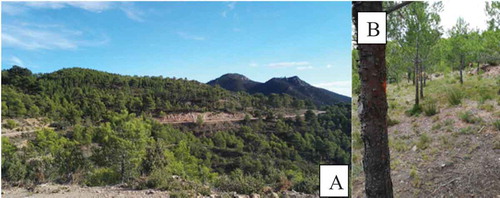
Crossing all GIS layers with these considerations, a representative sample forest was found in the Sierra Calderona Natural Park located in the region of Valencia, Spain. The chosen area, of approximately 20 hectares, contains pure stands of Aleppo pine trees. The trees clearly show that they belong to two different age classes, located very close to each other. These trees maintain the same edaphological conditions as well as insolation regime, orientation, and water availability. The two age classes are:
Young trees: about 26-year-old naturally regenerated stands originated after a forest fire in 1994.Citation42
Mature trees: even-aged pure stands, which were afforested around 50 years ago and survived forest fire of 1994.
The selected sample stand has an approximate size of 0.25 hectares and is located at latitude 39º 45ʹ 28.80” N and longitude 0º 30ʹ 36.36” W. shows the nature of the study area.
Figure 1. Study area location: (a) Panoramic view of the sample stand, (b) tree distancing in the sample stand.
2.2 Selection of representative trees
In the selected sample stand, a total of 121 trees were inventoried. The main dendrometric parameters, i.e. diameter at breast height (DBH at 1.3 m)Citation43 and total tree height (ht) have been measured. The results of this inventory are summarized in .
Table 1. Dendometric parameters of the tree population: breast-height diameter (DBH) and total tree height (ht).
Following the recommendations of Fernández-Puratich,Citation44 Oliver-VillanuevaCitation45 and Hapla,Citation46 we disregarded form the study those trees that: i) are located at the edge of the plot, ii) have grown with excessively braided shafts or iii) show affections of fungi or insects.
Furthermore, following the recommendations of Ríos-Rojas,Citation26 for a first phase of the study, we selected randomly different standard samples: two mature trees, two young trees and a standing dead tree. This phase was focussed on voltage and current measurements as a function of tree age.
In the second phase of the study, we conducted a statistical study to determine the population size following the methodology described by Hapla and Saborowski.Citation47 These authors made several measurements at different heights of the trees demonstrating that if the height and diameter of the trees do not differ more than a confidence interval the increasing number of samples does not improve the results significantly. For this phase, our tree population was reduced to 15 representative trees, to reach 95% confidence interval, considering the selection criteria used in different studies related to wood characteristics and physical properties of several tree species.Citation45,Citation46,Citation48-Citation52 The selected trees accomplish the following characteristics:
Height and diameter do not differ more than a standard deviation of the mean values.
Belong to KRAFT sociological class I (dominant trees) or class II (co-dominant trees).
Without significant or appreciable damage or disease present on the trunk.
Homogeneously distributed throughout the entire plot surface, to achieve a greater diversity of results.
Belong to the same age group and with enough level of electrical activity (measured in phase 1 of the study).
2.3 Measurement equipment
The electrical parameters were measured with a UT71D UNI-T multimeter with an input impedance of 2.5 GΩ, and an accuracy of 0.1% ± 2 millivolts (mV), as it is used in other studies.Citation53,Citation54
We used extracellular stainless-steel electrodes as in previous works.Citation23 To eliminate as far as possible the measurement overpotentials induced by the galvanic effect in bipolar measurements, we made sure that all our electrodes were manufactured with the same material.
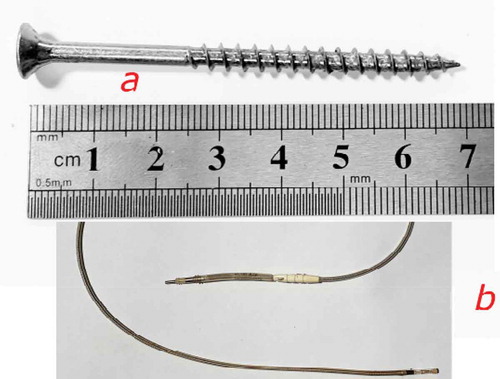
We chose screws as the electrodes because they can easily be inserted into and extracted from trees, causing a small injury. Besides, because of their thread, screws have a larger contact surface area than smooth electrodes.
For the measurements, as a ground connection to the circuit, we used a titanium nitride-coated platinum-iridium alloy electrode (1999/5/EC).Citation55 Non-polarization electrodes were used as earth to minimize false results induced by the charges freely crossing over between the electrode–electrolyte interface following the experiences of Prutchi.Citation56 Each electrode was connected with the measuring equipment through an electrical connector and a 0.5 mm copper conductor cable insulated with a flexible plastic coating (CE 0123). shows the materials and equipment used.
Figure 2. Equipment used for the measurement of the electrical signals (a) a 70 mm screw as an electrode, (b) an earth electrode.
2.4 Electrode placement and measurement
To record the voltage and short-circuit current (ISC) of the sample tree, electrodes were inserted directly into the trunk in contact with the phloematic tissue. This was ensured by inserting the electrodes using a torque wrench that allowed us to detect the change in hardness. According to other authors, phloemCitation6 plays an active role in the electrical response of the trees. OyarceCitation6 demonstrated that the living cells that compose these areas offer lower resistance to the current flow in comparison with the rest of the tissues of the plant.
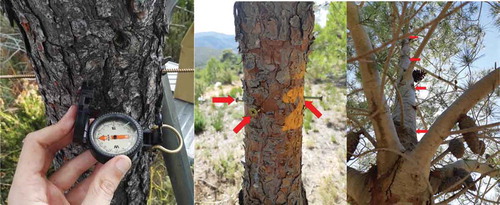
We placed the electrodes in a circular and longitudinal distribution to determine the distribution of the potential difference along the trunk of each tree. In the circular ring cuff configuration, the electrodes were placed at 1.5 m above the ground at the four cardinal compass points (north, east, south and west). Using the compass to select the orientation of the faces of the trees where the electrodes were inserted, as is shown in (left and middle). In the longitudinal configuration, the electrodes were longitudinally inserted into the trees every 50 cm, following a longitudinal line at the trunk’s north face. (right) shows this setup. The low-polarization electrode was buried 15 cm into the ground, a minimum of 3 m away from the tree to use as ground or reference electrode.
Figure 3. Electrode placement using a compass (left), identification of trees and radially location of the electrodes (center), electrodes separated longitudinally (right).
The electrode placement used was the same in bipolar mode or referenced to the ground, changing only the electrodes connection. So, measurements referenced to the ground were carried out between each electrode concerning to the ground. On the other hand, bipolar measurements were made between two nearby electrodes, with a fixed separation of 0.5 m between them. The first level was from the electrode located at 0 m to 0.5 m, the next level was from 0.5 m to 1 m, continuing thus, up to 3 m in height on the tree. shows a diagram of this configuration.
Figure 4. Electrode placement setup modes (left) measurements referenced to the ground, (right) bipolar setup.
The setup used for the electrodes to measure the potential difference was the same for the total population of trees. Between 18th and 19th November 2017, continuous measurements were carried out during 24 hours, sampling data every hour. In this measurement session, we did not intend to observe a difference in behavior, it was only to obtain voltage values between the two age groups.
After obtaining the results of the preliminary phase of the study, the trees that formed the population for the second phase were selected, based on the observed results. The voltage and intensity began to be measured in the 15 selected trees that made up this representative population, analyzing the distribution of the electrical potential in the trees.
2.5 Experimental conditions
Data collection was performed through measurements by inserting electrodes into the trees. With the intention that our collected data were not affected by external variables, the following two premises were followed.
First, given that we caused a small injury in the trunks by inserting the electrodes, the trees responded by forming border areas and compartmentalization barriers to prevent infection and to resist the spread of wood decay.Citation57 Generally, within 24 days’ post of the wound creation, an impervious boundary appears approximately 1 mm inside the wound surface.Citation57,Citation58 In conifer trees, the impermeability arises between 28 and 30 days after injury in these trees.Citation57 Following this, we carried out our study after leaving enough time for the generation of the boundary zone (necrofilactic periderm) of the tree bark.
Second, we have to address the fact that environmental conditions affect the behavior of the plant and generate changes in the electrical potential.Citation26,Citation29,Citation59,Citation60 To avoid that uncontrollable external factors that may influence our observations, we made the measurements of the fieldwork in days with similar air humidity and temperature, mainly in bright days without clouds. All measurements were made in the hour of zenith in the work area (between 1:30 pm and 2:00 pm CET). The decision to carry out the measurements at this time was based on the highest solar incidence, the lowest cloud presence and stable conditions.
2.6 Statistical analyzes
Each collected data of voltages and ISC were analyzed. We carried out normal distribution, homoscedasticity of variance and ANOVA tests. In our case, to check if the data follows a normal distribution t-Student parametric test was applied. This allows evaluating the comparison between the two tree ages as well as between bipolar and referenced to the ground electrode configuration data (for two samples).
The concept of data homoscedasticity implies constancy in the variance of the errors, and it is used to guarantee a variable prediction by calculating the average value of its set.Citation59
An analysis of the variance (ANOVA) was performed with north, east, south, and west (N, E, S, W) orientation data (for three or more samples). Besides, the Kruskal–Wallis test and Mann–Whitney U test were applied to check the heterogeneity of data for two and three samples, respectively.
3. Results
3.1 Influence of tree age
shows the obtained results for young and mature trees. Furthermore, this table also shows a significant influence of the tree age in the referenced to the ground measurements. Hence, there is a significant difference between the age groups (p-value <0.0001) with an average voltage of 0.929 V in young trees and 0.238 V in mature trees. On the other hand, the bipolar measurements show an average voltage of 0.010 V and 0.014 V for young and mature trees, respectively. In bipolar measurements, the age difference does not show significant differences between groups (p-value = 0.45).
Table 2. Observations summary using different configurations over mature and young tree groups, volts as unit of measurement.
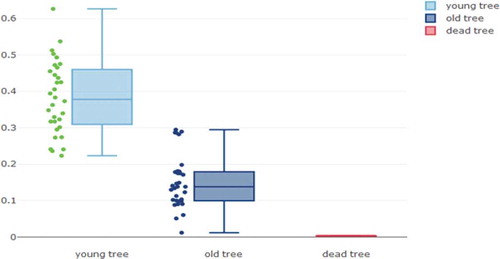
shows the main results obtained in 24 hours of referenced to the ground measurements. The average voltage in young trees is 0.383 V with a maximum value of 0.626 V. Mature trees show significantly lower values versus young trees (p-value < 0.0001) with an average voltage of 0.150 V and a maximum value of 0.295 V. The control dead tree shows values of 0 V, as expected.
Figure 5. Boxplots presenting the data dispersion for young, old, and dead tree 24 h measurements. The median voltages measured significantly differed according to the tree age, young trees showing much higher values than older individuals.
3.2 Influence of height
For the analysis of the longitudinal variation of the electric signals, only the young trees have been selected, since they show significantly higher values in the voltage measurements as the older trees.
3.2.1 Referenced to the ground measurements
and show values very constant at every height level. With a maximum voltage value of 0.626 V measured at ground level and a minimum value of 0.597 V at 2.5 m. The ISC show values even closer to each other than the voltage, with a maximum ISC value of 0.568 µA at 0 m and a minimum value of 0.519 µA measured at 2.5 m.
Table 3. Statistical mean and variance of referenced to the ground measurements for voltage and current considering the height at the tree.
Figure 6. Monopolar referenced to the ground measurements for voltage and current considering the height at the tree.
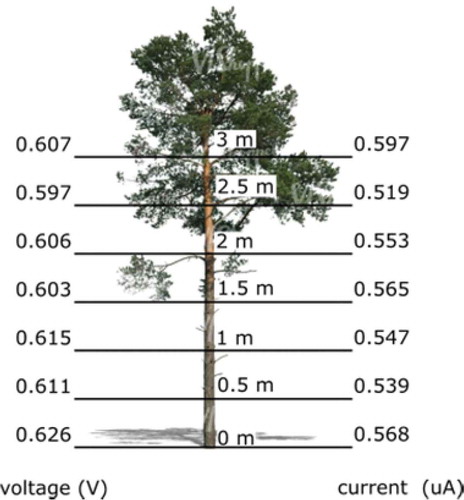
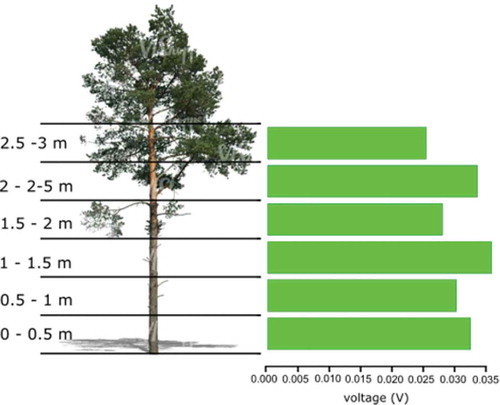
Figure 7. Bipolar voltage measurements considering the height at the tree.
Analyzing the data obtained, we found significant differences neither in voltage (p-value = 0.86) nor in ISC (p-value = 0.91) among the different height levels. Therefore, the measurement height shows no influence on the voltage or ISC referenced to the ground measurements.
3.2.2 Bipolar measurements
Both the voltage and the ISC show very close values between each height level for bipolar measurements. As can be seen in and , the highest values for voltage mean have been obtained between 1 m to 1.5 m above the ground (0.036 V) and the minimum values at 2.5–3.0 m (0.025 V). On the other hand, the maximum values for ISC were measured between 0.0 m to 0.5 m (0.471 µA) and the minimum values at 2.0–2.5 m (0.218 µA).
Nevertheless, the slight differences observed are not significant among levels of height, neither for voltage (p-value = 0.517) nor for ISC (p-value = 0.248).
3.3 Influence of orientation
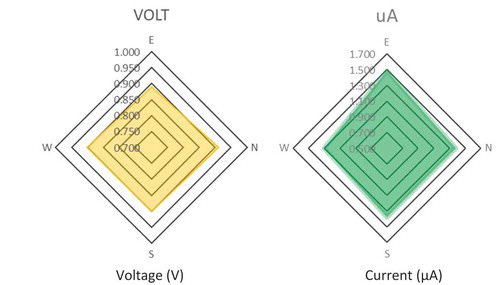
Very similar values and no significant differences can be found among the cardinal point placement of the electrodes (p-value = 0.871), as can be observed in . However, it is necessary to point out that a tiny significant difference was detected only for ISC between the east and the other cardinal points (p-value = 0.048). It was decided to continue to obtain data in order to analyze more in detail the possible influence of orientation on ISC. Thus, three other measurements were carried out on 21st April 5th and 12th May 2018. None of them showed statistically significant differences, neither for voltage nor for ISC, as can be seen in . Consequently, these additional measurements ruled out a possible influence of orientation on voltage and ISC.
Table 4. Statistical mean and variance of bipolar voltage measurements considering height at the tree.
Table 5. Statistical mean and variance of voltage measurements referenced to the ground considering orientation at the tree.
Figure 8. Average values for voltage and electrical current in function on the cardinal orientation.
3.4 Optimal electrode configuration
The results confirm significant differences (p-value < 0.001) in the data obtained according to electrode configuration, either referenced to the ground or bipolar. shows this result graphically.
Figure 9. Significant differences between the bipolar and referenced to the ground configurations in terms of voltage (left) and ISC (right) (p-value < 0.0001).
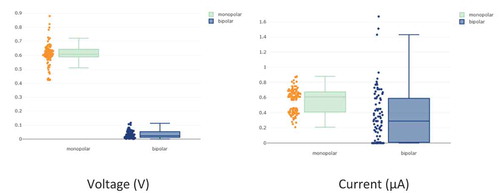
The obtained results demonstrate that the measured voltage values show a clear and significant difference between the electrode configurations, with an average value of 0.626 V for the referenced to the ground measurement and a value of 0.036 V for the bipolar measurement. On the other hand, the observed values for ISC show smaller differences than for the voltage (see ). Thus, the difference between the means is much smaller with an average of 0.597 µA for the referenced to the ground measurement and 0.471 µA for the bipolar measurement. However, these small differences are statically significant (p < .001).
4. Discussion
The first result to consider is the observation of a negative electric potential difference of the tree with respect to the ground. This observation is consistent with the different authors who have studied the voltage in several tree species.Citation6,Citation21,Citation23,Citation33 Regarding the direction of ISC, Le MouëlCitation29 concludes on the presence of positively charged islands that produce a reversal of current flow. During the fieldwork for this research, we have not been able to observe any reversal of the current direction. However, as mentioned in the materials and methods section, the different sets of measurements were made under meteorological conditions that were as similar as possible.
Moreover, the results indicate that the age of Mediterranean pines has a direct influence on the electrical potential, since young pines present a significantly higher voltage than mature trees (0.92 V and 0.24 V, respectively). Besides laboratory or nursery research,Citation6,Citation24-Citation26 there are research activities that were carried out with trees in the natural environment, but those activities were performed with a single tree. Thus, e.g., CardosoCitation27 analyzes the electrical signals of a eucalyptus tree (Eucaliptus globulus) with a height of 15 m and a diameter at breast height of 45 cm. Although the age of the tree was omitted, we concluded that they were done on mature trees considering the specified tree dimensions. The same happens in other works.Citation23,Citation30-Citation33
Additionally, when comparing the voltage values obtained by these authors with ours, they are close to those obtained with our sample of mature trees. Furthermore, the results obtained in our research on the electric signal difference between young and mature trees could be compared with other research related to physiological changes and age in trees. Thus, for example, SellinCitation61 observes that the sapwood thickness, in which the physiological activity is concentrated, decreases its relative proportion when the trees’ age. Also, RosenvaldCitation62 demonstrates that the main functional parameters for the tree’s mineral nutrition decrease as the age of the trees increases, reverting a behavior similar to the Pinus halepensis volumetric increase functions developed and published by Montero.Citation63
Furthermore, the results indicate that both voltage and ISC measurements show uniform distribution patterns in the trunks. Consequently, the measurement does not vary depending on the height or orientation positioning of the electrode in the trunk. Le MouelCitation29 shows a slight tendency to increase the voltage values with increasing electrode positioning height at the trunk. However, it should be borne in mind that this research was only carried out on a single tree. Our research cannot verify this presumed increase either in bipolar or referenced to the ground measurements. Thus, in the same way that we have been able to demonstrate with the results obtained in our research, GibertCitation23 and LoveCitation20 do not observe significant differences between the measurement of voltage at different heights of the electrode’s position in the trunk xylem respecting to the ground. Furthermore, our mean voltage values obtained are in the same order of magnitude as those of the literature consulted,Citation20,Citation23 despite the fact that these authors carried out their work outside and under laboratory conditions, respectively. Thus, in accordance to Gibert,Citation23 we can discard the assumption of the electrokinetic theory as a generator of the difference in electrical power in trees. According to the electrokinetic theory, the electric field would be proportional to the pressure gradient,Citation64 which transferred to a plant, would be the flow of sap per unit area. Therefore, this theory would imply a linear increase in the amplitude of the electrical potential with the height in the trunk, at least on average.
In the case of the electrode placement depending on the orientation, our voltage results also coincide with those obtained by other authors,Citation20,Citation33 which were obtained in measurements on individual trees. The values of current in short-circuit ISC are presented in only one work,Citation20 instantaneous current in short-circuit ISC values shown there are quite similar to our registered values. However, the distribution of the ISC is not mentioned. Since the voltage distribution is homogeneous, we expected the same with ISC, so we have not arguments against the hypothesis that the distribution of the ISC should behave differently.
In conclusion, the electrical current and voltage do not vary depending on the measurement height or the orientation of the electrode, which reduces the difficulty of fieldwork to collect data, expanding the possibilities of installation of measurement equipment. Furthermore, the use of young trees in ground-referenced measurements gives the possibility of working with higher value electrical signals. All this will allow us to optimize the placement of the measurement electrodes in the trees depending on the circumstances. And it also allows us to consolidate the knowledge of how static factors influence the measurement of electrical signals.
Consequently, this allows us the opportunity to continue researching the dynamic behavior of electrical signals on a population of Pinus halepensis in a Mediterranean ecosystem. We plan to evaluate the influence of other factors such as the trees’ cycle variations (daily, monthly and annual) or even the different characteristic meteorological variables of the Mediterranean climate. The present and future works will be the basis for the use of measurable electrical signals in trees as a means of indicating the state of individual trees and forest mass.
We work with long-term objective of developing low-cost and easy-to-use devices that could be integrated with other sensing technologies and would allow more accurate and correct decision-making in forest planning and management through constant monitoring of trees.
Geolocation information
Disclosure of interest
The authors report no conflict of interest.
References
- Burdon-Sanderson JS. Note on the electrical phenomena which accompany irritation of the leaf of Dionæa muscipula. Proc R Soc London. 1873;21:1–9.
- Darwin C. Insectivorous plants. New York (NY): D Appleton & Company; 1875. doi:10.5962/bhl.title.99933.
- Bose JC. Nervous mechanism of plants.. New York (NY).: Longmans, Green and Co.; 2011. doi:10.5962/bhl.title.139322.
- Pickard BG. Action potentials in higher plants. Bot Rev. 1973;39:172–201.
- Wright JP, Fisher DB. Measurement of the sieve tube membrane potential. Plant Physiol. 1981;67(4):845–848. doi:10.1104/PP.67.4.8456.
- Oyarce P, Gurovich L. Electrical signals in avocado trees: responses to light and water availability conditions. Plant Signal Behav. 2010;5(1):34–41. doi:10.4161/psb.5.1.10157.
- Datta P, Palit P. Relationship between environmental factors and diurnal variation of bioelectric potentials of an intact jute plant. Curr Sci. 2004:87;680–683.
- Gurovich LA, Hermosilla P. Electric signalling in fruit trees in response to water applications and light–darkness conditions. J Plant Physiol. 2009;166(3):290–300. doi:10.1016/j.jplph.2008.06.004.
- Rhodes JD, Thain JF, Wildon DC. The pathway for systemic electrical signal conduction in the wounded tomato plant. Planta. 1996;200(1):50–57. doi:10.1007/BF00196648.
- Volkov AG, Adesina T, Jovanov E. Closing of Venus flytrap by electrical stimulation of motor cells. Plant Signal Behav. 2007;2(3):139–145. doi:10.4161/psb.2.3.4217.
- Pyatygin SS, Opritov VA, Vodeneev VA. Signaling role of action potential in higher plants. Russ J Plant Physiol. 2008;55(2):285–291. doi:10.1134/S1021443708020179.
- Brenner ED, Stahlberg R, Mancuso S, Vivanco J, Baluška F, Van Volkenburgh E. Plant neurobiology: an integrated view of plant signaling. Trends Plant Sci. 2006;11(8):413–419. doi:10.1016/j.tplants.2006.06.009.
- Zimmermann MR, Maischak H, Mithöfer A, Boland W, Felle HH. System potentials, a novel electrical long-distance apoplastic signal in plants, induced by wounding. Plant Physiol. 2009;149(3):1593–1600. doi:10.1104/pp.108.133884.
- Schaller A, Oecking C. Modulation of plasma membrane H+-ATPase activity differentially activates wound and pathogen defense responses in tomato plants. Plant Cell. 1999;11(2):263–272. doi:10.2307/3870855.
- Fromm J, Lautner S. Electrical signals and their physiological significance in plants. Plant Cell Environ. 2007;30(3):249–257. doi:10.1111/J.1365-3040.2006.01614.X.
- Gelli A, Higgins VJ, Blumwald E. Activation of plant plasma membrane Ca2+-permeable channels by race-specific fungal elicitors. Plant Physiol. 1997;113(1):269–279. doi:10.1104/pp.113.1.269.
- Stankovic B, Zawadzki T, Davies E. Characterization of the variation potential in sunflower. Plant Physiol. 1997;115(3):1083–1088. doi:10.1104/pp.115.3.1083.
- Mwesigwa J, Collins DJ, Volkov AG. Electrochemical signaling in green plants: effects of 2, 4-dinitrophenol on variation and action potentials in soybean. Bioelectrochemistry. 2000;51(2):201–205. doi:10.1016/S0302-4598(00)00075-1.
- Sukhova E, Akinchits E, Sukhov V. Mathematical models of electrical activity in plants. J Memb R Biol. 2017;250(5):407–423. doi:10.1007/s00232-017-9969-7.
- Love CJ, Zhang S, Mershin A. Source of sustained voltage difference between the xylem of a potted Ficus benjamina tree and its soil. PloS One. 2008;3:8.
- Gora EM, Yanoviak SP. Electrical properties of temperate forest trees: a review and quantitative comparison with vines. Can J For Res. 2015;45(3):236–245. doi:10.1139/cjfr-2014-0380.
- Horwitz W. The theory of electrokinetic phenomena. J Chem Educ. 1939;16(11):519. doi:10.1021/ed016p519.
- Gibert D, Le Mouël JL, Lambs L, Nicollin F, Perrier F. Sap flow and daily electric potential variations in a tree trunk. Plant Sci. 2006;171(5):572–584. doi:10.1016/j.plantsci.2006.06.012.
- Gil PM, Gurovich L, Schaffer B. The electrical response of fruit trees to soil water availability and diurnal light-dark cycles. Plant Signal Behav. 2008;3(11):1026–1029. doi:10.4161/psb.6786.
- Gil PM, Gurovich L, Schaffer B, García N, Iturriaga R. Electrical signaling, stomatal conductance, ABA and ethylene content in avocado trees in response to root hypoxia. Plant Signal Behav. 2009;4(2):100–108. doi:10.4161/psb.4.2.7872.
- Ríos-Rojas L, Morales-Moraga D, Alcalde JA, Gurovich LA. Use of plant woody species electrical potential for irrigation scheduling. Plant Signal Behav. 2015;10(2):e976487. doi:10.4161/15592324.2014.976487.
- Cardoso SS, Carrondo LB, Marques JM, Narciso PN, Rocha MJ, Rodrigues IN, Soares A. (2004). Monitorization of the electrical signal generated by a tree. February 2004 – 4th luso-spanish assembly on geodesy and geophysics.
- Koppán A. Measurement of electric potential difference on trees. Acta Biologica Szegediensis. 2002;46:37–38.
- Le Mouël JL, Gibert D, Poirier JP. On transient electric potential variations in a standing tree and atmospheric electricity. C R Geosci. 2010;342(2):95–99. doi:10.1016/j.crte.2009.12.001.
- Morat P, Le Mouël JL, Granier A. Electrical potential on a tree. A measurement of the sap flow? Comptes rendus de l’Académie des sciences Série 3, Sciences de la vie. 1994;317:98–101.
- Gindl W, Loppert HG, Wimmer R. Relationship between streaming potential and sap velocity in Salix Alba L. PHYTON-HORN-. 1999;39:217–224.
- Koppán A, Szarka L, Wesztergom V. Temporal variation of electrical signal recorded in a standing tree. Acta Geodaetica et Geophysica Hungarica. 1999;34:169–180.
- Koppan A (2004). Variations of the natural electric potential differences occurring on tree trunks and their relationship with the xylem sap flow. PhD Thesis. University of West Hungary. Sopron, Hungary.
- Volkov AG, Ranatunga DRA. Plants as environmental biosensors. Plant Signal Behav. 2006;1:105–115.
- AAVV. (2008). Distribution map of aleppo pine. EUFORGEN 2009,[Retrieved 2020 July 16]. www.euforgen.org
- De Luis M, Čufar K, Di Filippo A, Novak K, Papadopoulos A, Piovesan G, Smith KT. Plasticity in dendroclimatic response across the distribution range of Aleppo pine (Pinus halepensis). PLoS One. 2013;8:12. doi:10.1371/journal.pone.0083550.
- Fadi B, Semerci H, Vendramin GG. 2003. EUROFORGEN technical guidelines for genetic conservation and use for aleppo pine (Pinus halepensis) and brutia pine (Pinus brutia). IPGRI, International plant genetic resources institute. Rome (Italy). p. 6. ISBN 92-9043-571-2.
- Mauri A, Di Leo M, de Rigo D, Caudullo G. 2016. Pinus halepensis and Pinus brutia in Europe: distribution, habitat, usage and threats. In: San-Miguel-Ayanz J, de Rigo D, Caudullo G, Houston Durrant T, Mauri A, editors. European Atlas of Forest TreeSpecies. Publ. Off. EU, Luxembourg. p. e0166b8+.
- Pausas JG, Ribeiro E, Vallejo R. Post-fire regeneration variability of Pinus halepensis in the eastern Iberian Peninsula. For Ecol Manage. 2004;203(1–3):251–259. doi:10.1016/J.FORECO.2004.07.061.
- IFN3. Tercer inventario forestal nacional (3rd National Forest Inventory of Spain). Ministerio para la Transformación Ecológica y el Reto Demográfico; Spain, 2007. [Retrieved 202 July 16] https://www.miteco.gob.es/es/biodiversidad/servicios/banco-datos-naturaleza/informacion-disponible/ifn3.aspx
- Linán ID, Gutiérrez E, Heinrich I, Andreu-Hayles L, Muntán E, Campelo F, Helle G. Age effects and climate response in trees: a multi-proxy tree-ring test in old-growth life stages. Eur J For Res. 2012;131:933–944.
- Moliner JIU. Análisis del régimen de incendios forestales en los montes de Portaceli durante el siglo XX (Serra, Valencia). Cuadernos De Geografía. 2004;76:50–59.
- Saket M, Altrell D, Vuorinen P, Dalsgaard S, Andersson,National forest inventory (field manual template) The Forest Resources Assessment (FRA), , http://www.fao.org/3/ae578e/AE578E06.htm.
- Puratich F, Wilson H (2013). Valorización integral de la biomasa leñosa agroforestal a lo largo del gradiente altitudinal en condiciones mediterráneas (Doctoral dissertation).
- Oliver-Villanueva JV, Becker G. Verwendungsrelevante Holzeigenschaften der Esche (Fraxinus excelsior L.) und ihre Variabilität im Hinblick auf Alter und Standraum. Forst und Holz. 1993;48:387–391.
- Hapla F, Oliver-Villanueva JV, González-Molina JM. Effect of silvicultural management on wood quality and timber utilisation of Cedrus atlantica in the European Mediterranean area. Holz als Roh-und Werkstoff. 2000;58(1–2):1–8. doi:10.1007/s001070050377.
- Hapla F, Saborowski J. Planning of sample size for wood anatomical investigations. Holz als Roh-und Werkstoff. 1987;45:141–144.
- Seeling U, Sachsse H (1991). Abnorme Kernbildung bei Rotbuche und ihr Einfluß auf holzbiologische und holztechnologische Kenngrößen [Abnormal heartwood formation in beech and its influence on the biological and technological features of the wood] (Doctoral dissertation, Doctoral thesis, 2nd).
- Sauter U. Technologische Holzeigenschaften der Douglasie (Pseudotsuga menziesii (Mirb.) Franco) als Ausprägung unterschiedlicher Wachstumsbedingungen. Freiburg i. Breisgau, Germany, 1992.
- Dix B, Roffael E, Becker G, Gruss K. Properties of pulps prepared from poplar wood of different clones, sites and ages. Papier. 1992;46:583–592.
- Wobst J (1995). Auswirkungen von Standortwahl und Durchforstungsstrategie auf verwertungsrelvante Holzeigenschaften der Douglasie (Pseudotsuga menziesii (Mirb. (Franco)) (Doctoral dissertation). UNIVERSITY OF GÖTTINGEN.
- Peters S (1996). Untersuchungen über die Holzeigenschaften der Stieleiche (Quercus robur L.) und ihre Beeinflussung durch die Bestandesdichte. Papierflieger, UNIVERSITY OF GÖTTINGEN.
- Krcmar P, Kuritka I, Maslik J, Urbanek P, Bazant P, Machovsky M, Merka P. Fully inkjet-printed cuo sensor on flexible polymer substrate for alcohol vapours and humidity sensing at room temperature. Sensors. 2019;19(14):3068. doi:10.3390/s19143068.
- Wang K, Zhang S. Extracellular electron transfer modes and rate-limiting steps in denitrifying biocathodes. Environ Sci Pollut Res. 2019;26(16):16378–16387. doi:10.1007/s11356-019-05117-x.
- DIRECTIVE 1999/5/EC OF THE EUROPEAN PARLIAMENT AND OF THE COUNCIL of 9 March 1999.
- Prutchi D, Norris M. Design and development of medical electronic instrumentation. Hoboken (New Jersey): John Wiley & Sons; 2004. p. 326–334.. doi:10.1002/0471681849.
- Woodward S, Pearce RB. The role of stilbenes in resistance of Sitka spruce (Picea sitchensis (Bong.) Carr.) to entry of fungal pathogens. Physiol Mol Plant Pathol. 1988;33(1):127–149. doi:10.1016/0885-5765(88)90049-5.
- Mullick DB. A new tissue essential to necrophylactic periderm formation in the bark of four conifers. Can J Bot. 1975;53(21):2443–2457. doi:10.1139/b75-271.
- Abbott DT, Crossley DA Jr. Woody litter decomposition following clear‐cutting. Ecology. 1982;63(1):35–42. doi:10.2307/1937028.
- Fensom DS. The bioelectric potentials of plants and their functional significance: V. Some daily and seasonal changes in the electrical potential and resistance of living trees. Can J Bot. 1963;41(6):831–851. doi:10.1139/b63-068.
- Sellin A. Variation in sapwood thickness of Picea abies in Estonia depending on the tree age. Scand J For Res. 1991;6(1–4):463–469. doi:10.1080/02827589109382683.
- Rosenvald K, Ostonen I, Uri V, Varik M, Tedersoo L, Lohmus K. Tree age effect on fine-root and leaf morphology in a silver birch forest chronosequence. Eur J For Res. 2013;132(2):219–230. doi:10.1007/s10342-012-0669-7.
- Montero G, Cañellas I, Ruiz-Peinado R. Growth and yield models for Pinus halepensis Mill. For Syst. 2002;10:179–201.
- Delgado ÁV, González-Caballero F, Hunter RJ, Koopal LK, Lyklema J. Measurement and interpretation of electrokinetic phenomena. J Colloid Interface Sci. 2007;309(2):194–224. doi:10.1016/j.jcis.2006.12.075.