
ABSTRACT
The use of plant cell suspension culture systems has demonstrated to be highly suitable for metabolomics investigations of inducible defense responses. Here we report on sorghum cell suspension cultures that were elicited with purified lipopolysaccharides from the sorghum pathogen Burkholderia andropogonis, to activate metabolic pathways involved in the chemical defenses of the plant. Metabolomic analysis using liquid chromatography coupled to mass spectrometry identified a resorcinol phenolic lipid, annotated as sorgoleone, as one of the biomarkers associated with the LPS-induced response. Sorgoleone is a semiochemical and an allelochemical, synthesized by specialized root hair cells and the major component of the hydrophobic root exudate of sorghum. Its detection in undifferentiated cells might indicate a previously undescribed role for this phytochemical in plant defense responses.
Introduction
Sorgoleone, 2-hydroxy-5-methoxy-3[(Z,Z)-8ʹ,11ʹ,14ʹ-pentadecatriene]-p-benzoquinone, is the major component of the hydrophobic root exudate of sorghum (Sorghum bicolor L. Moench).Citation1–Citation3 This lipid benzoquinone is a semiochemical and an allelochemical, contributing to the inhibition of germinating weed seedlings.Citation4 Sorgoleone synthesis is elemental in young sorghum plants and compartmentalized within specialized root hair cells.Citation1,Citation5 The presence of sorgoleone is linked to root growth and development of mature root hairs, but factors modulating the biosynthesis thereof are not well known. The biosynthesis of sorgoleone appears to be a dynamic process and factors such as environment and genetics are influential in expression of genes related to sorgoleone biosynthesis.Citation4,Citation6 Synthesis in sorghum seedlings is stimulated by root extracts from competing plants and may be controlled by feedback inhibition.Citation6
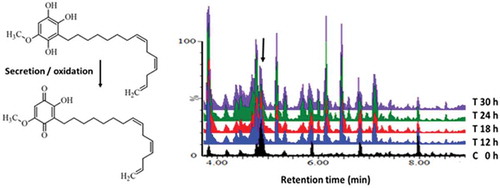
The biosynthetic pathway of the allelochemical is an interesting convergence of the fatty acid and polyketide synthase metabolic pathways.Citation1,Citation6,Citation7 A polyketide synthase is involved in formation of the quinone head of the molecule and the attachment of the fatty acid tail (). The enzyme catalyzing the condensation reaction is 5-pentadecatrienylresorcinol synthase (Sb-ARS1/2). The 3-methylether group is introduced by an O-methyltransferase (OMT) and the terminal double bond by a dedicated fatty acid desaturase (DES).Citation1 Biosynthetic genes, especially desaturase-2 (DES2), were demonstrated to be responsive to the auxin group of phytohormones.Citation2 Rapid oxidation of the non-phytotoxic precursor, dihydrosorgeolone (reduced form) upon exudation of oily droplets into the soil generates the phytotoxic sorgoleone.Citation2,Citation7,Citation9,Citation10 Sorgoleone analogues with aliphatic side chains of varying lengths and different degrees of saturation have been reported. Related analogues may also have an additional methoxy group at the third and fifth atom in the ring.Citation1,Citation11 Phytotoxicity is associated with the quinone moiety,Citation1 and is ascribed to inhibition of the photosynthetic apparatus in chloroplasts and inhibition of electron transport in chloroplasts and mitochondria, which is analogous to triazine herbicides activity.Citation9,Citation12
Figure 1. (a)The conversion of dihydrosorgoleone to sorgoleone. Rhizosecreton of the non-phytotoxic reduced form, dihydrosorgeolone, as oily droplets into the rhizosphere results in rapid oxidation into the phytotoxic benzoquinone, sorgoleone. (b)UHPLC-MS BPI chromatograms (ESI positive mode) of methanolic extracellular extracts of sorghum cells treated with LPS from Burkholderia andropogonis. The chromatograms of a control (non-treated 0 h) vs. treated samples (0–30 h) display variation related to treatment- and time-related metabolic changes occurring in the cells due to LPS elicitation.Citation8 The arrow indicates the sorgoleone peak (retention time = 4.98 min, m/z = 359.2298).
Sorghum is important grain crop for sustainable food security, particularly in semi-arid areas. ‘Leaf stripe’ is one of three major bacterial diseases of sorghum, caused by Burkholderia andropogonis, a pathogen that has a diverse and extensive geographical dispersion as well as host range.Citation13 The physiological and molecular mechanisms that determine the outcome of the phytopathogenic interaction between sorghum and B. andropogonishas only recently been investigated.Citation13 Unraveling the intricacies of the metabolic responses associated with sorghum defense responses to B. andropogonis infection could provide descriptive insights that can be explored for cultivar improvement. Of interest is also the differences in defense responses of differentiated plant tissues vs. that of undifferentiated cultured cells as model systems.Citation8
Materials and methods
Elicitation of sorghum cell suspensions with Burkholderia andropogonis lipopolysaccharides
Cell suspension cultures of Sorghum bicolor (‘Sweet White’ cultivated variety) (Agricol, Pretoria, South Africa) were cultured as previously described.Citation14 Purified lipopolysaccharides (LPS)(100 µg mL−1) from B. andropogonis,Citation8 was used in the elicitation of the cell suspensions. Following inoculation, the cultures were incubated on an orbital shaker at 130 rpm and 25°C. Harvesting of treated cells was done at 0 (control), 12, 18, 24, and 30 h post-inoculation (h.p.i.), by means of centrifugation at 5 000 × g to separate pelleted cells and culture media. These were snap frozen with liquid nitrogen and stored at – 80°C until both intracellular and extracellular metabolite extraction steps could be performed.Citation8 The experimental design included three independent biological repeats and three technical repeats of each extract (n = 9).
Ultra-high-performance liquid chromatography–high-definition mass spectrometry
Intracellular and extracellular cell extracts were analyzed on a Waters Acquity UHPLC system coupled to a SYNAPT G1 Q-TOF mass spectrometer (Waters Corporation, Milford, MA, USA). Chromatographic separation of the methanolic extracts was on a Waters HSS T3 C18 column (150 mm × 2.1 mm ×1.8 µm) with gradient elution.Citation13 High definition mass spectrometry (MS) was performed on a Waters SYNAPT G1 Q-TOF system with an electrospray ionization (ESI) source interface. The data were acquired with different collision energies (MSE) 10–50 eV. The MassLynx software (V4.1 SCN 872, Waters Corporation Milford, MA, USA) was used to control the system and perform initial data manipulation.
Data processing and metabolite annotation
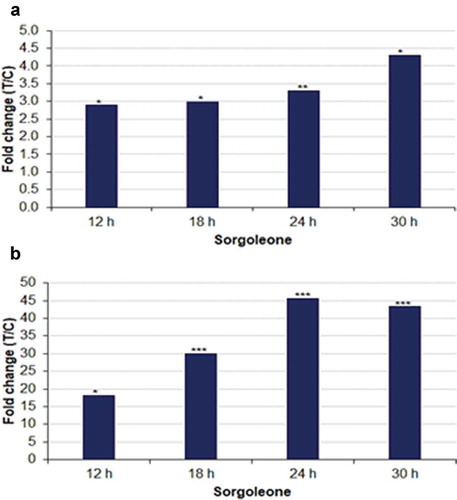
Raw data, obtained from UHPLC-HDMS, were extracted using MassLynxTM XS software and processed with MarkerLynx software (Waters Corporation, Manchester, UK). Data pre-processing included peak picking, peak alignment, noise filtering, peak area integration and normalization. Varying software parameters were used for data processing. The data matrices (samples = N, and retention time -m/z variables with integrated peak areas) obtained from MarkerLynx processing were exported into SIMCA 14 (Umetrics, Umea, Sweden) for statistical analyses.Citation8,Citation13 Fold changes calculated for sorgeolone were based on relative peak intensities obtained from the chromatograms reflecting the changed metabolomes at 12, 18, 24, and 30 h.
Metabolite annotation was performed at level 2 of the Metabolomics Standards InitiativeCitation15 as previously described.Citation8,Citation13 Metabolite annotation was achieved with the aid of the Taverna workbench (https://taverna.incubator.apache.org/),Citation16 for PUTMEDID_LCMS metabolite identification workflows. These comprise correlation analysis, annotation of mass spectrometric features (molecular ion, isotopologues, adducts), and metabolite annotation. The generated metabolite identity was confirmed with the aid of fragmentation patterns obtained from the MSE analyses and the MassFragment algorithms of the MassLynxTM XS software. The calculated molecular formula/elemental composition was also manually searched against online databases such as Dictionary of Natural Products (DNP) (dnp.chemnetbase.com), PlantCyc (www.plantcyc.org) and available literatureCitation1 to aid in metabolite annotation.
Metabolic network analysis
Biochemical and chemical correlational network analysis was constructed for visualization of the annotated metabolites’ relationships. MetaMapR (https://dgrapov.github.io/MetaMapR) was employed for the identification of metabolic precursors to produce relations based on KEGG identifiers.Citation17 Additionally, for the calculation of structural similarities, PubChem chemical identifiers (CID) were used.Citation18 The molecular fingerprints were linked with the structural similarity threshold set at a Tanimoto coefficient of 0.7.Citation17 The Cytoscape version 3 toolCitation19 was used for visualization of the established network.
Results and discussion
Adaptive defense responses to the lipopolysaccharides from the pathogen B. andropogonis in sorghum cells were investigated in an untargeted metabolomics study.Citation13 Following elicitation of sorghum cells in suspension culture, UHPLC-MS analysis of the hydromethanolic extracts and multivariate data analysis, one of the biomarkers that contributed to group discrimination between control and LPS-treated sorghum cells, both in extracts from cells as well the extracellular growth medium, was annotated as sorgoleone (C22H30O4 m/z = 359.2298 in positive ionization mode). The i-Fit (norm) was 0.0 and the mass accuracy 0.3–1.7 mDa. MSE data indicated fragment ions of 358.21, 341.21, 326.14, and 324.17 that were matched to the sorgoleone structure.
The representative MS chromatograms of control (non-treated 0 h) vs. treated samples (0–30 h) are presented in . The chromatograms display metabolic variation related to the LPS treatment, reflecting time-related metabolic changes occurring in the cells in response to the perception of the LPS.
In order to provide measurable evaluation of metabolic changes of sorgoleone in S. bicolor cells triggered by LPS treatment, relative quantities, expressed as fold changes, were calculated. These were derived from peak intensities of sorgoleone in extracts from treated samples vs. 0 h control, (T/C), and showed that the allelochemical significantly accumulated in the intracellular milieu and was also detected in the extracellular milieu in relatively higher levels. In general, the levels increase intracellularly as well as extracellularly over time (12–30 h) ( and b), following LPS treatment.
Figure 2. Relative quantification of sorgoleone across the time points, annotated in (a) intracellular and (b) extracellular extracts, synthesized in response to LPS treatment of sorghum cells. The graphs show the relative levels of the metabolite across different time points, expressed as fold changes, and computed from treated against control (C0 h), i.e. T/C, where fold change > 1 represents accumulation. The fold changes represented by * have p < .05, ** p < .005 and *** have p < .0005.
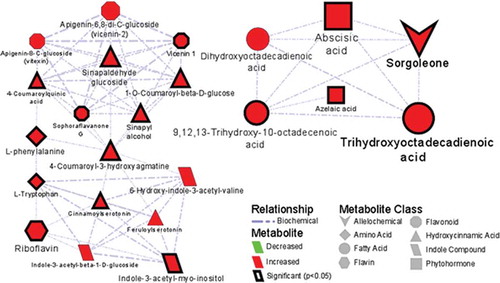
A metabolic network analysis of metabolites secreted by sorghum cells upon elicitation with LPS from B. andropogonis is presented in , displaying metabolic relationship patterns between chemometrically selected signatory markers and metabolic features related to the secretion of sorgoleone into the extracellular medium. The increasing presence of sorgoleone in the extracellular medium might be interpreted as a result of active secretion or passive diffusion.
Figure 3. Metabolic network analysis of metabolites synthesized and secreted by sorghum cells into the extracellular medium upon elicitation with lipopolysaccharides from Burkholderia andropogonis. A biochemical and empirical network displaying metabolic relationship patterns between chemometrically selected signatory biomarkersCitation8 and metabolic features related to the secretion of sorgoleone (upper right hand corner) into the extracellular medium. The edge type and thickness depict the relationship (biochemical, structural) and Tanimoto correlation coefficient (structural only, with a cut off of 0.5) between respective nodes. The node shape indicates the metabolite class. Node color and size reflect the direction (red – increased; green – decreased) and magnitude of change (fold-change). The graph was created using Cytoscape version 3.5.1.
Identification of sorgoleone as a biomarker in cultured sorghum cells has not been reported before and may be related to the undifferentiated state of the cells. In our previous studies on plant leaf tissue systems, this particular metabolite was not identified.Citation13 This might be explained by the phenomenon of restricted synthesis of some secondary plant metabolites by specialized cells within tissues/organs and associated with a certain stage of development.Citation20
Allelopathy involves the production and release of bioactive secondary metabolites (i.e. allelochemicals) by a plant species that interfere with the growth of another plant species.Citation9,Citation21 Production of this group of metabolites is characterized as a form of chemical warfare in plants competing for resources such as water, nutrients and light.Citation21,Citation22 S. bicolor is considered an allelopathic plant, due to its production of phytotoxins such as the sorgoleone,Citation4,Citation7,Citation23,Citation24 dhurrin, strigol, and sorgolactone.Citation23 The production and release of sorgoleone have been of particular interest in agriculture and plant chemical ecology due to its increased production in root hairs, functioning as a weed suppressant and effectiveness of its allelopathic activity at low concentrations.Citation12,Citation23 However, the type of plant species, and nature of abiotic and biotic stressors can influence the synthesis and secretion of allelochemicals.Citation21,Citation25 Cultivated commercial cultivars generally produce low levels of sorgoleone (14–240 µg mg−1 fresh weight)Citation26,Citation27 compared with those of wild and unimproved sorghum genotypes, where levels of 400–500 μg mg−1 root fw were reported.Citation24
In addition to herbicidal activity, some antifungal activities of the metabolite and production due to pathogen infection, have been reported.Citation6 Significant accumulation of sorgoleone in the intra- and extracellular milieu, following LPS treatment, also suggests a probable antimicrobial activity of the metabolite and thus a defense-related role. However, more research needs to be done in this regard.Citation28
Availability of data
Meta-data on which this communication is based were deposited to the EMBL-EBI metabolomics repository (MetaboLights50), with the identifier MTBLS1204 (http://www.ebi.ac.uk/metabolights/MTBLS.1204).
Acknowledgments
The University of Johannesburg is thanked for bursary support to CRM.
Additional information
Funding
References
- Dayan FE, Rimando AM, Pan Z, Baerson SR, Gimsing AL, Duke SO. Sorgoleone. Phytochemistry. 2010;71:1–5. doi:10.1016/j.phytochem.2010.03.011.
- Uddin MR, Thwe AA, Kim YB, Park WT, Chae SC, Park SU. Effects of auxins on sorgoleone accumulation and expression of genes for sorgoleone biosynthesis in sorghum roots. J Chem Ecol. 2011;39:712–722.
- Głąb L, Sowiński J, Bough R, Dayan FE. Allelopathic potential of sorghum (Sorghum bicolor (L.) Moench) in weed control: a comprehensive review. Adv Agron. 2017;145:43–95. 0065-2113. doi:10.1016/bs.agron.2017.05.001.
- Weston LA, Alsaadawi IS, Baerson SR. Sorghum allelopathy-from ecosystem to molecule. J Chem Ecol. 2013;39:142–153. doi:10.1007/s10886-013-0245-8.
- Dayan FE, Howell J, Weidenhamer JD. Dynamic root exudation of sorgoleone and its in planta mechanism of action. J Exp Bot. 2009;60:2107–2117. doi:10.1093/jxb/erp082.
- Dayan FE. Factors modulating the levels of the allelochemical sorgoleone in Sorghum bicolor. Planta. 2006;224:339–346. doi:10.1007/s00425-005-0217-5.
- Cook D, Rimando AM, Clemente TE, Schroder J, Dayan FE, Nanayakkara NPD, Pan Z, Noonan BP, Fishbein M, Abe I, et al. Alkylresorcinol synthases expressed in Sorghum bicolor root hairs play an essential role in the biosynthesis of the allelopathic benzoquinone sorgoleone. Plant Cell. 2010;22(3):867–887. doi:10.1105/tpc.109.072397.
- Mareya CR, Tugizimana F, Di Lorenzo F, Silipo A, Piater LA, Molinaro A, Dubery IA. Adaptive defence-related changes in the metabolome of Sorghum bicolor cells in response to lipopolysaccharides of the pathogen Burkholderia andropogonis, and the structural elucidation of the lipid A and O-polysaccharide chain of the LPS. Sci Rep. 2020;10:7626. doi:10.1038/s41598-020-64186-y.
- Yoneyama K, Natsume M. Allelochemicals for plant–plant and plant–microbe interactions. In: Mori K, editor. Comprehensive natural products II. Chemistry and biology. Vol. 4. Amsterdam, The Netherlands: Elsevier; 2010. p. 539–556. doi:10.1016/B978-0-12-409547-2.02802-X.
- Uddin MR, Thwe AA, Kim YB, Park WT, Chae SC, Park SU. Effects of jasmonates on sorgoleone accumulation and expression of genes for sorgoleone biosynthesis in sorghum roots. J Chem Ecol. 2013;39:712–722. doi:10.1007/s10886-013-0299-7.
- Kagan IA, Rimando AM, Dayan FE. Chromatographic separation and in vitro activity of sorgoleone congeners from the roots of Sorghum bicolor. J Agri Food Chem. 2003;51:7589–7595. doi:10.1021/jf034789j.
- Jesudas AP, Kingsley JS, Ignacimuthu S. Sorgoleone from Sorghum bicolor as a potent bioherbicide. Res J Recent Sci. 2014;3:32–36.
- Mareya CR, Tugizimana F, Piater LA, Steenkamp PA, Dubery IA, Madala NE. Untargeted metabolomics reveal defensome-related metabolic reprogramming in Sorghum bicolor against infection by Burkholderia andropogonis. Metabolites. 2019:9. doi:10.3390/metabo9010008.
- Madala NE, Steenkamp PA, Piater LA, Dubery IA. Different metabolite distribution patterns in isonitrosoacetophenone-elicited tobacco and sorghum cells as revealed by multivariate statistical models. Springer Plus Online. 2014;3:254. doi:10.1186/2193-1801-3-254.
- Sumner LW, Amberg A, Barrett D, Beale MH, Beger R, Daykin CA, Fan TWM, Fiehn O, Goodacre R, Griffin JL, et al. Proposed minimum reporting standards for chemical analysis: chemical analysis working group (CAWG) metabolomics standards initiative (MSI). Metabolomics. 2007;3(3):211–221. doi:10.1007/s11306-007-0082-2.
- Brown M, Wedge DC, Goodacre R, Kell DB, Baker PN, Kenny LC, Mamas MA, Neyses L, Dunn WB. Automated workflows for accurate mass-based putative metabolite identification in LC/MS-derived metabolomic datasets. Bioinformatics. 2011;27(8):1108–1112. doi:10.1093/bioinformatics/btr079.
- Grapov D, Wanichthanarak K, Fiehn O. MetaMapR: pathway independent metabolomic network analysis incorporating unknowns. Bioinformatics. 2015;31:2757–2760. doi:10.1093/bioinformatics/btv194.
- Bolton EE, Kim S, Bryant SH. PubChem3D: similar conformers. J Cheminform. 2011;3:13. doi:10.1186/1758-2946-3-13.
- Smoot ME, Ono K, Rucscheinski J, Wang P-L IT. Cytoscape 2.8: new features for data integration and network visualization. Bioinformatics. 2011;27:431–432. doi:10.1093/bioinformatics/btq675.
- Ncube EN, Steenkamp PA, Madala NE, Dubery IA. Metabolite profiling of the undifferentiated cultured cells and differentiated leaf tissues of Centella asiatica. Plant Cell Tissue Organ Culture (PCTOC). 2017;129:431–443. doi:10.1007/s11240-017-1189-4.
- Khanh TD, Anh LH, Nghia LT, Trung KH, Hien PB, Trung DM, Xuan TD. Allelopathic responses of rice seedlings under some different stresses. Plants. 2018;7:1–18. doi:10.3390/plants7020040.
- Li Z-H, Wang Q, Ruan X, Pan C-D, Jiang D-A. Phenolics and plant allelopathy. Molecules. 2010;15:8933–8952. doi:10.3390/molecules15128933.
- Albuquerque MB, Santos RC, Lima LM, de Albuquerque Melo Filho P, Nogueira RJMC, Câmara CAG, Ramos AdR. Allelopathy, an alternative tool to improve cropping systems, A review. Agron Sustainable Dev. 2011;31:379–395. doi:10.1051/agro/2010031.
- Tibugari H, Chiduza C, Mashingaidze AB, Mabasa S. Quantification of sorgoleone in sorghum accessions from eight southern African countries. South Afr J Plant Soil. 2018;36:41–50. doi:10.1080/02571862.2018.1469794.
- Yang X, Owens TG, Scheffler BE, Westoni LA. Manipulation of root hair development and sorgoleone production in sorghum seedlings. J Chem Ecol. 2004;30:199213. doi:10.1023/B:JOEC.0000013191.35181.03.
- Uddin MR, Park KW, Kim YK, Park SU, Pyon JY. Enhancing sorgoleone levels in grain sorghum root exudates. J Chem Ecol. 2010;36:914–922. doi:10.1007/s10886-010-9829-8.
- Uddin MR, Kim YK, Park SU, Pyon JY. Herbicidal activity of sorgoleone from grain sorghum root exudates and its contents among sorghum cultivars. Korean J Weed Sci. 2009;29:229–236.
- Hamany Djande CY, Pretorius C, Tugizimana F, Piater LA, Dubery IA. Metabolomics: a tool for cultivar phenotyping and investigation of grain crops. Agronomy. 2020;10:831. doi:10.3390/agronomy10060831.