
ABSTRACT
CFP/YFP-paired FRET is routinely used to estimate intracellular Ca2+ concentrations in vivo. This system, however, is excited with blue light, which is likely to invoke unexpected responses in plant cells. This report describes a new green light-excitable FRET system with an mKO2/mCherry pair. Plant cells expressing this newly constructed FRET system demonstrated its ability to monitor changes in cytosolic free calcium concentration. The new system is likely to find applications in studies of plant cells where undesirable blue light responses must be avoided.
The maintenance of intracellular Ca2+ concentration is crucial for plant cells. In response to abiotic and biotic stresses, free Ca2+ fluxes into the cytosolic space, facilitated by membrane-associated Ca2+ channels.Citation1,Citation2 Elevation of the cytosolic Ca2+ concentration triggers downstream signaling events, including protein phosphorylation and changes in gene expression.Citation1
Table 1. Comparison of calcium monitoring methods.3.
Many methods to monitor the cytosolic calcium level in living cells have been developed.Citation3,Citation4 In particular, live-cell imaging using fluorescent probes or fluorescent protein-based techniques has the advantage of allowing real-time monitoring of Ca2+ levels. An example is yellow cameleon (YC), a genetically engineered Ca2+ sensor protein that combines calmodulin (CaM) and the CaM-binding peptide of myosin light-chain kinase (M13) with two fluorescent proteins, CFP (cyan fluorescent protein) and YFP (yellow fluorescent protein). When Ca2+ binds to the CaM region of YC, CaM interacts with M13, causing a conformational change that brings the CFP and YFP regions closer together.Citation5 This increases the efficiency of fluorescence energy transfer (FRET) between the two fluorescent proteins, resulting in a Ca2+-dependent change in the YFP/CFP fluorescence ratio.Citation5 The FRET-based Ca2+ monitoring YC system has been introduced into plants to observe Ca2+ behavior during plant-specific phenomena such as root hair growth.Citation6,Citation7
Unfortunately, the blue-violet light required for CFP excitation (peak at 433 nm) also can promote plant photoresponses via UV-A/blue light photoreceptors, phototropins, or cryptochromes.Citation8 Thus, this blue excitation might trigger unintended cellular responses, leading to potential artifacts and misinterpretation of the results. Therefore, a Ca2+ sensor combining fluorescent donor and acceptor proteins that can be excited at non-blue wavelengths should be explored. In this study, we substituted the fluorescent proteins of the YC system (YC3.6)Citation9 with mKO2 and mCherry, because the acceptor, mKO2, can be excited at a green wavelength (peak at 551 nm).Citation10 The Ca2+ sensing domain of YC3.6 (CaM+M13) was inserted between the two fluorescent proteins to form mCherry-(CaM+M13)YC3.6-mKO2, as shown in . The CaM+M13 region derived from YC3.6 acts as a Ca2+ sensor that changes the conformation of the protein upon binding Ca2+, thereby enabling FRET between mKO2 and mCherry.
Figure 1. In vitro spectrometric analysis of the green light-excitable calcium sensor purified from an E. coli expression system. A. The emission spectrum of the engineered protein excited with 510 nm shows two peaks at 565 nm and 605 nm. The diagrams indicate the construct of the proposed FRET system. CFP and YFP was replaced with mCherry and mKO2, respectively. CaM+M13 is a Ca2+-sensing domain. B. The ratio (R: Em 605nm/Em 565nm) was 0.3 in saturated 10 mM CaCl2 or 0.29 in the presence of a Ca2+ chelator, 1 mM EGTA
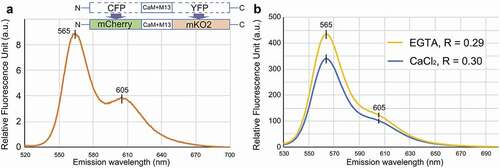
To test the new FRET system, we first analyzed its spectrographic properties in vitro. The DNA fragment for mCherry-(CaM+M13)YC3.6-mKO2 was integrated into the pDEST17 expression vector (Invitrogen) to produce a protein with an N-terminal 6xHis tag, and the resulting plasmid (pDEST17-mCherry-(CaM+M13)YC3.6-mKO2) was transformed into Escherichia coli BL21-AI competent cells (Invitrogen). Expression of the His-tagged protein was induced by adding 0.2% L-arabinose to the culture medium. After overnight incubation at 18°C, E. coli were treated with a lytic solution, and the His-tagged protein was collected with Ni-NTA beads. After washing the beads with 20-mM imidazole, the His-tagged protein was eluted and concentrated using an Ultracel-50 regenerated cellulose membrane, 0.5 mL sample volume (Merck). The final protein concentration was adjusted to 1 mg/mL with 20 mM MOPS (pH 7.2) buffer. shows an emission spectrum of the protein excited at 510 nm (Hitachi F-2700). The curve shows two emission peaks, at 565 nm and 605 nm. This is consistent with the reported emission wavelengths of the two fluorescent proteins: the first peak comes from mKO2,Citation10 and the second from mCherry.Citation11 Ratiometric analysis was performed to determine whether the FRET ratio (605 nm [mCherry]/565 nm [mKO2]) increased in the presence of Ca2+. The ratio was 0.30 in the saturated 10 mM of Ca2+ solution and decreased to 0.29 by removing free Ca2+ with the Ca2+ chelator, EGTA (). The in vitro analysis suggests that the proposed mCherry-(CaM+M13)YC3.6-mKO2 system can be used to detect changes in Ca2+ concentration.
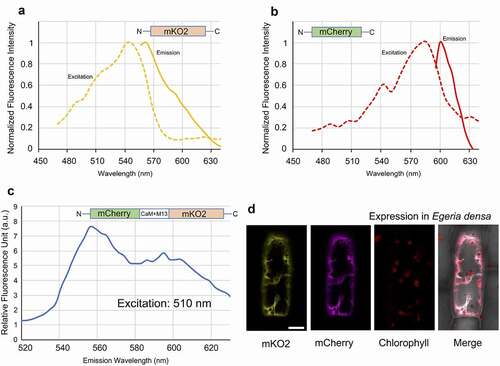
To test the new sensor in vivo, we transiently expressed and observed mCherry-(CaM+M13)YC3.6-mKO2 in Egeria densa, a well-known aquatic plant widely used in aquariums. The plant is easy to cultivate in fresh water in the laboratory, and its single cell layer leaves are suitable for microscopy analysis.Citation12 The DNA fragment for mCherry-(CaM+M13)YC3.6-mKO2 was integrated into the pGWT35S vectorCitation13 (pGWT35S-mCherry-(CaM+M13)YC3.6-mKO2) for transient expression in E. densa. Constructs expressing mCherry or mKO2 connected to the 35S promoter were used as controls. The constructs were introduced into E. densa leaves by particle bombardment with DNA-coated gold particles. The leaves were then incubated overnight in the dark at room temperature. A detailed protocol for particle bombardment of E. densa was described previously.Citation12 Imaging and spectral measurements of the E. densa leaves were conducted with a Leica SP8X confocal laser-scanning microscopy using the time-gating technique.Citation14 The intensity of fluorescence was calculated from each acquired image after background subtraction. and show the excitation (ex) and emission (em) spectra for leaves expressing mKO2 and mCherry fluorescent proteins alone, collected using the lambda-scanning mode of the Leica SP8X. The peaks for mKO2 and mCherry in E. densa were 542 nm (ex)/563 nm (em) and 587 nm (ex)/604 nm (em), respectively. These values are consistent with those obtained in the in vitro analysis (). For analysis of mCherry-(CaM+M13)YC3.6-mKO2 expressed in the E. densa cells, a 510-nm laser was used to excite the donor protein mKO2 to prevent excessive excitation of the acceptor mCherry. The two peaks emitted from the fluorescent proteins were observed at 556 nm and 595 nm (). shows a confocal image of an E. densa cell expressing the mCherry-(CaM+M13)YC3.6-mKO2 system in the cytosol. The transient expression analysis confirms that the fluorescent proteins in the mCherry-(CaM+M13)YC3.6-mKO2 system are functional in living E. densa cells.
Figure 2. In vivo spectrometric analysis of the green light-excitable calcium sensor expressed in living E. densa cells. A. Excitation and emission spectra of mKO2 expressed in E. densa. B. Excitation and emission spectra of mCherry expressed in E. densa. C. Emission spectrum of mCherry-(CaM+M13)YC3.6-mKO2 expressed in E. densa and excited at 510 nm. D. Confocal images of an E. densa cell expressing mCherry-(CaM+M13)YC3.6-mKO2 imaged with different color channels. Excitation was at 510 nm. Bar indicates 20 µm
Finally, we conducted FRET-based real-time Ca2+ monitoring with the mCherry-(CaM+M13)YC3.6-mKO2 system expressed in E. densa cells. Since the cytosolic Ca2+ level varies in response to chemical treatments, we tested the system using pharmacological experiments. Exogenous application of ATP (adenosine triphosphate) promotes an increase in cytosolic Ca2+ in plants,Citation15 and ATP has been used to elicit changes in the cytosolic level of Ca2+.Citation7 shows that, unexpectedly, a 1-hour treatment with 500 µM ATP dissolved in sodium phosphate buffer (20 mM, pH 7.0) caused a decrease in the FRET ratio, indicating a decrease in the Ca2+ level. This is inconsistent with the previous study, which showed increasing Ca2+ in response to exogenous ATP treatment in Arabidopsis thaliana.Citation7 Although the mechanism of the Ca2+ decrease in E. densa cell is unclear, the response to ATP observed in the current study must be elucidated. The ratio returned to the baseline after the ATP solution was washed out. The Ca2+ ionophore, A23187, was applied to the E. densa cells as another way to increase cytosolic Ca2+. A gradual increase in the FRET ratio was observed after adding 20 µM A23187, consistent with the results of a previous study using the conventional YFP/CFP-based FRET YC3.6 system.Citation6 The results shown in Fig. 3AB demonstrate the ability of the designed FRET system (mCherry-(CaM+M13)YC3.6-mKO2) to function as a genetically coded Ca2+ sensor in planta.
Figure 3. In vivo monitoring of changes in calcium level in E. densa cells expressing mCherry-(CaM+M13)YC3.6-mKO2. A. Ca2+ decreases after a 1-hour treatment with 500 µM ATP. B. The increase in cytosolic Ca2+ after treatment with 20 µM Ca2+ ionophore. The graph shows a representative plot from three independent experiments. C. The increase in Ca2+ after a 1-min irradiation with 405-nm light. The fluorescence value was calculated from confocal images of the region of interest in the cytosolic space of the E. densa cells. Different letters and error bars in the graphs indicate significant differences (Tukey’s HSD test, P < .05) and standard deviations, respectively. All experiments were replicated at least three times
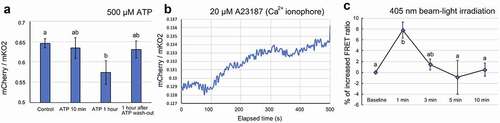
We then tested whether mCherry-(CaM+M13)YC3.6-mKO2 can be used to study UV-A/blue light responses, our original motivation for designing a new sensor system. In plants, UV-A and blue light responses are mediated by photoreceptors such as phototropins and cryptochromes. Upon blue illumination, phototropins provoke transient elevation of Ca2+ as a primary signaling event.Citation16 Owing to the nature of this plant response, it was challenging to observe the cytosolic Ca2+ change with conventional blue-excitable CFP-YFP paired FRET systems (). Here, we used the modified FRET system and excitation by laser to monitor blue light-induced Ca2+ changes without interruption. A circular, 10-µM diameter region of interest (ROI) was selected within the cytosol of the E. densa cell. The ROI was irradiated with a near UV-A/blue light (405 nm) laser for 1 min, and the FRET signal from the entire ROI was simultaneously monitored with 510 nm excitation for up to 10 min. shows that an increase in the FRET ratio, reflecting an increase in Ca2+, was detected immediately after the 405-nm irradiation, after which the ratio gradually returned to the baseline. Because phototropins expressed in many land plants absorb in the blue-light range,Citation17 this result suggests that the 405-nm irradiation led to a Ca2+ increase based on the action of phototropins. It suggests that a conventional CFP-YFP FRET system, which requires 433 nm for excitation, itself triggers the unfavorable cytosolic Ca2+ increase. With the proposed green light-excitable FRET system here, it enables us to monitor plant response to blue light without any disturbance. In the present study, we developed a genetically encoded Ca2+ sensor based on two fluorescent proteins, mKO2 and mCherry (). We showed that the new sensor was able to monitor Ca2+ increases and decreases in living E. densa cells. We also demonstrated possible use of the sensor for future studies to avoid undesired blue light responses in plants (). However, the ratio and efficiency of the new system still need to be optimized by appropriate mutations or replacements of, for example, the fluorescent proteins and linkers.
Author contributions
K.Y. and Y.K. designed the experiments. K.Y. performed the biochemical analysis and the microscopy. Both authors wrote and approved the final manuscript.
Acknowledgments
We thank Dr Atsushi Miyawaki, RIKEN, for providing YC3.6. This work was supported by the JST-ERATO (JPMJER1602: the Numata Organelle Reaction Cluster).
Disclosure statement
No potential conflict of interest was reported by the author(s).
Additional information
Funding
References
- Philip JW, Martin RB. Calcium in plants. Ann Bot. 2003;92(4):1–4. doi:https://doi.org/10.1093/aob/mcg164.
- Bose J, Pottosin II, Shabala SS, Palmgren MG, Shabala S. Calcium efflux systems in stress signaling and adaptation in plants. Front Plant Sci. 2011;2:85. doi:https://doi.org/10.3389/fpls.2011.00085.
- Kanchiswamy CN, Malnoy M, Occhipinti A, Maffei ME. Calcium imaging perspectives in plants. Int J Mol Sci. 2014;15(3):3842–3859. doi:https://doi.org/10.3390/ijms15033842.
- Brownlee C. Cellular calcium imaging: so, what’s new?. Trends Cell Biol. 2000 Oct;10(10):451–457. doi:https://doi.org/10.1016/s0962-8924(00)01799-2.
- Miyawaki A, Llopis J, Heim R, McCaffery JM, Adams JA, Ikura M, Tsien RY. Fluorescent indicators for Ca2+ based on green fluorescent proteins and calmodulin. Nature. 1997;388(6645):882–887. doi:https://doi.org/10.1038/42264.
- Monshausen GB, Messerli MA, Gilroy S. Imaging of the yellow cameleon 3.6 indicator reveals that elevations in cytosolic Ca2+ follow oscillating increases in growth in root hairs of arabidopsis. Plant Physiol. 2008;147(4):1690–1698. doi:https://doi.org/10.1104/pp.108.123638.
- Krebs M, Held K, Binder A, Hashimoto K, Den Herder G, Parniske M, Kudla J, Schumacher K. FRET-based genetically encoded sensors allow high-resolution live cell imaging of Ca2⁺ dynamics. Plant J. 2012;69(1):181–192. doi:https://doi.org/10.1111/j.1365-313X.2011.04780.x.
- Christie JM, Briggs WR. Blue light sensing in higher plants. J Biol Chem. 2001;276(15):11457–11460. doi:https://doi.org/10.1074/jbc.R100004200.
- Nagai T, Yamada S, Tominaga T, Ichikawa M, Miyawaki A. Expanded dynamic range of fluorescent indicators for Ca2+ by circularly permuted yellow fluorescent proteins. Proc Natl Acad Sci U S A. 2004;101(29):10554–10559. doi:https://doi.org/10.1073/pnas.0400417101.
- Sakaue-Sawano A, Kurokawa H, Morimura T, Hanyu A, Hama H, Osawa H, Kashiwagi S, Fukami K, Miyata T, Miyoshi H, et al. Visualizing spatiotemporal dynamics of multicellular cell-cycle progression. Cell. 2008;132(3):487–498. doi:https://doi.org/10.1016/j.cell.2007.12.033.
- Shaner NC, Campbell RE, Steinbach PA, Giepmans BN, Palmer AE, Tsien RY. Improved monomeric red, orange and yellow fluorescent proteins derived from discosoma sp. red fluorescent protein. Nat Biotechnol. 2004;22(12):1567–1572. doi:https://doi.org/10.1038/nbt1037.
- Osaki Y, Kodama Y. Particle bombardment and subcellular protein localization analysis in the aquatic plant egeria densa. PeerJ. 2017;5:e3779. doi:https://doi.org/10.7717/peerj.3779.
- Fujii Y, Yoshimura A, Kodama Y. A novel orange-colored bimolecular fluorescence complementation (BiFC) assay using monomeric kusabira-orange protein. Biotechniques. 2018;64(4):153–161. doi:https://doi.org/10.2144/btn-2017-0121.
- Kodama Y. Time gating of chloroplast autofluorescence allows clearer fluorescence imaging in planta. PLoS One. 2016;11(3):e0152484. doi:https://doi.org/10.1371/journal.pone.0152484.
- Demidchik V, Nichols C, Oliynyk M, Dark A, Glover BJ, Davies JM. Is ATP a signaling agent in plants?. Plant Physiol. 2003;133(2):456–461. doi:https://doi.org/10.1104/pp.103.024091.
- Harada A, Sakai T, Okada K. Phot1 and phot2 mediate blue light-induced transient increases in cytosolic Ca2+ differently in arabidopsis leaves. Proc Natl Acad Sci U S A. 2003;100(14):8583–8588. doi:https://doi.org/10.1073/pnas.1336802100.
- Briggs WR, Christie JM. Phototropins 1 and 2: versatile plant blue-light receptors. Trends Plant Sci. 2002;7(5):204–210. doi:https://doi.org/10.1016/s1360-1385(02)02245-8.