
ABSTRACT
Lilium Pumilum with wide distribution is highly tolerant to salinity. The blue copper protein LpCPC (Lilium pumilum Cucumber Peeling Cupredoxin) gene was cloned from Lilium pumilum, which has the conserved regions of type I copper protein. Moreover, LpCPC has the closest relation to CPC from Actinidia chinensis using DNAMAN software and MEGA7 software. qRT-PCR indicated that LpCPC expression was higher in root and bulb of Lilium pumilum, and the expression of the LpCPC gene increased and reached the highest level at 12 h in bulbs under 20 mM NaHCO3. The transgenic yeast was more tolerant compared with the control under NaHCO3 stress. Compared with the wild type, overexpressing plants indicated a relatively lower degree of wilting. In addition, the chlorophyll content, soluble phenol content, and lignin content of overexpressing lines were higher than that of wild-type, whereas the relative conductivity of overexpressing plants was significantly lower than that of wild-type plants. Expression of essential genes including NHX1 and SOS1 in salt stress response pathways are steadily higher in overexpression tobacco than that in wild-types. Transgenic lines had much higher levels of CCR1 and CAD, which are involved in lignin production, compared with wild-type lines. The yeast two-hybrid technique was applied to screen probable interacting proteins interacting with LpCPC. Eight proteins interacted with LpCPC were screened, and five of which were demonstrated to be associated with plant salinity resistance. Overall, the role of gene LpCPC is mediating molecule responses in increasing saline-alkali stress resistance, indicating that it is an essential gene to enhance salt tolerance in Lilium pumilum.
Introduction
The soil in the Northeast of China is heavily salinized. Lilies have high ornamental, medicinal, and edible value, but most species of lilies are extremely sensitive to saline stress. The Lilium pumilum is an excellent plant material because of its high salt tolerance and suitability for alkaline soils.Citation1,Citation2 We analyzed and compared the differential transcriptome of Lilium pumilum without treatment and under 20 mM NaHCO3 treatment. The results indicated that the expression of the CPC gene was significantly increased under 20 mM NaHCO3 treatment. CPC belongs to the blue copper protein. Copper ions are the important components of many biological enzymes in the metabolic processes of living organisms, which play an indispensable role in their lives. For example, it is related to many metabolic effects including plant photosynthesis.Citation3 Copper-binding proteins control the uptake, transport, chelation, and efflux of copper ions, which indirectly or directly regulate the metabolic activities of organisms. It can be divided into three categories according to the valence state of copper ions: type I copper proteins, type II copper proteins, and type III copper proteins.Citation4 As one of the members of the type I copper protein family, the blue copper protein was named because it has a dark blue absorption peak of Cu ion at 600 nm.Citation5,Citation6 Blue copper protein was found for the first time in Thiobacillus ferrooxidans.Citation7 It contains small redox-active proteins with similar structural folds and contain a single copper ion, whose primary role is to transport electrons in bacteria and plants.Citation8According to the different residues of copper ion ligands, spectral properties, and structural differences in the structural domains of precursors and mature proteins, the blue copper protein family can be divided into two groups, Plastocyanin (Pc) and Phytocyanin (Ph).Citation9,Citation10 Plastocyanin is an electron transfer protein in photosynthesis, which is mainly responsible for the electron transfer from cytochrome f to photosystem I, thus converting light energy into chemical energy.Citation11 In oxygenated organisms, Ph is the largest subfamily of blue-copper proteins that act as carriers of electron transfer between cytochromes and photosystems I, which can be classified into Stellacyanin (Sc), Plantacyanin (Pa), and Uclacyanin (Ua) according to their differences in copper-binding sites.Citation12,Citation13 Phycocyanin is mainly involved in response to light, oxidative stress, and aluminum toxicity, which plays an essential role in secondary cell formation in the biosynthesis of lignin.Citation14
CPC plays an essential role in plant photosynthesis as the mobile electron carrier between the Photosystem I reaction center complex and the cytochrome b 6/f complex.Citation15 In plants, CPC improves oxidative stress response through increasing peroxidase and catalase enzyme activities.Citation16 Oxidative stress-induced the overexpression of blue copper-binding protein AtBCB to confers oxidative aluminum resistance in Arabidopsis thaliana.Citation17 The expression levels of several SC genes were significantly increased when induced by salt stress in the Capsicum annuum.Citation18 PtSC18 could dramatically enhance the drought tolerance of transgenic plants by reducing water loss, regulating the H2O2 content, peroxidase, and enzymatic activities of catalase.Citation16 BCP diminished aluminum stress through the formation of lignin or the effect of miR408.Citation18,Citation19 The tolerance of salt stress was enhanced through higher antioxidant enzyme activities and BCP transcription levels ().Citation16,Citation20,Citation21
Table 1. Functions of blue copper-binding protein
NHX1 (Vacuolar Na+/H+ antiporter 1, Accession number: JX987081.1) and SOS1 (Plasma membrane Na+/H+ antiporter 1, Accession number: JK739016.1) are two key genes responding to salt tolerance. NHX1 decreases the accumulation of Na+ ions in the cytosol by pumping Na+ in the vacuole. SOS1 is responsible for efflux Na+ from the cytosol to apoplasts. NHX1 and SOS1 might be used as biomarkers to further investigate the interaction between genes and stress tolerance.Citation22–24
Lignin deposition on plant cell walls is considered to be one of the mechanisms contributing to the development of large erect plants adapting to terrestrial habitats. In the process of lignification, as lignin penetrates, the cell wall stiffness is increased, with the mechanical support of the cell being improved, leading to that the compressive strength is enhanced, facilitating the formation of mechanical tissue. It figures prominently in-plant support and drainage.Citation25 Salt stress has an impact on the biosynthesis of secondary cell walls in plant cells.Citation26 It is obvious that regulation of lignification by the accumulation of lignin in the cell wall has the possibility of raising the salinity tolerance of plants.Citation27,Citation28 In summary, lignification occurs as a common response to various environmental stresses and mechanical damage in many plant species, that are associated with plant resistance to stresses.Citation29
In this study, the LpCPC gene was selected and amplified from the Lilium pumilum bulb. The LpCPC gene belongs to the Phytocyanin’s subfamily of blue copper proteins, that are involved in plant photosynthesis, oxidative stress, and aluminum toxin response, promoting plant lignin synthesis. The gene was characterized by its expression in different organs of the Lilium pumilum, the phenotypic analysis of the transgenic LpCPC yeast and overexpressing Nicotiana benthamiana under NaHCO3 stress, and the determination of a series of physiological indicators, which provide a preliminary analysis of the gene function and a foundation for researches related to plant stress resistance gene.
Materials and methods
Cloning and bioinformatics analysis of LpCPC
Lilium pumilum was grown in a controlled growth chamber at 25 ± 2°C with a 16 h light/8 h dark cycle. Screening of the LpCPC from the Lilium pumilum transcriptome and design the primer sequences using SnapGene software (). Total RNA from Lilium pumilum bulb was isolated using RNeasy Plant Mini Kit (Qiagen, Hilden, Germany), and cDNA was synthesized by reverse transcribing 500 ng of total RNA with Prime-Script Reverse Transcriptase (Takara, Tokyo, Japan). The PCR amplification reaction using primers LpCPC F and LpCPC R was carried out with cDNA as a template. The PCR product was ligated into the pMD18-T vector (Takara, Tokyo, Japan), and then sequenced
Table 2. Primers were used in this study
Characterization of LpCPC expression in different organs using real-time quantitative PCR (RT-qPCR)
RNA was extracted from the roots, bulbs, leaves, flowers, and seeds of Lilium pumilum, then cDNA was obtained by reverse transcription. The qPCR primers (LpCPC qPCR- F and LpCPC qPCR- R) were designed based on the sequence of the LpCPC gene (). The primes of LpActin F and LpActin R was used as a control (). Citation30 A 20 μL reaction system was made with UltraSYBR Mixture reagents, and qRT-PCR was performed according to the standard reaction condition designed procedure: pre-denaturation at 94°C for 10 min, denaturation at 94°C for 30s, annealing at 55–60°C for 30s, extension at 72°C for 1 min; 40 cycles in total. All tests were repeated in triplicate.
Analysis of LpCPC expression under abiotic stress using RT-qPCR
Lilium pumilum seedlings were grown on MS medium containing 20 mM NaHCO3 for 6h, 12 h, 24 h, 36 h, 48 h to apply salt stress. There were 18 seedlings divided into 6 groups with 3 repetitions of each group. RNA was extracted from the Lilium pumilum’s bulbs after stress treatment, then reverse transcribed to cDNA and quantified according to the qPCR reaction.
Analysis of LpCPC yeast expression vectors
The LpCPC-T plasmid was amplified using the primers containing restriction sites (LpCPC-EcoR I -F and LpCPC-Xho I -R) () and the PCR product was subsequently ligated into the pMD18-T vector, before the pMD18-T and pYES2 plasmid were both digested with EcoR I and Xho I. Next, ligated them resulting in pYES2-LpCPC. Competent yeast strain INVSC1 was used to transform pYES2 or pYES2-LpCPC plasmids using the Gietz standard transformation methods.Citation31 After induction of protein expression in transgenic yeast cells, the obtained broth (OD 600 = 0.6) was subsequently diluted 10−1,10−2, 10−3,10−4. 3 μL spots were taken in SC-U + 2% glucose solid medium containing 0mM, 15 mM, 30 mM NaHCO3, then the yeast was incubated for 3 days at 30°C for yeast stress treatment analysis.
Genetic transformation, identification, and quantitative analysis of Nicotiana benthamiana transgenic lines
PCR was carried out to amplify LpCPC-T plasmid with the primers of LpCPC F and LpCPC R before the products were ligated into the pCXSN plasmid, then PCR was applied again to identify whether the gene was positive or negative with primers of LpCPC F and NOS R (). The pCXSN-LpCPC plasmid was transformed into Agrobacterium tumefaciens EH105 by electroshock transformation.
Nicotiana benthamiana leaves were placed in MS+0.5 mg/LBA+0.1 mg/LNAA medium for pre-culture 48 h. The leaves were infected by Agrobacterium tumefaciens EH105 with pCXSN-LpCPC, before co-cultured in the dark for 48 h, and then transferred to the screening medium (MS+0.5 mg/LBA+0.1 mg/LNAA+50 mg/L Hygromycin) for further incubation. Germinated leaves were transferred to 1/2 MS medium to generate root. DNA of selected Nicotiana benthamiana leaves in favorable growth conditions were extracted and then identified by PCR using the LpCPC F and NOS R primers. qPCR was performed to detect the expression of the LpCPC gene in transgenic plants. Primers of NbActin-F and NbActin-R were used as control.Citation32
Analysis of salt resistance in transgenic Nicotiana benthamiana
Wild-type and transgenic plants with the same growth condition were watered with 40 mL 500 mM NaHCO3 solution per day lasting 5 days to observe the phenotype. Chlorophyll was measured on Nicotiana benthamiana using a SPAD chlorophyll meter (SPAD-502Plus, Japan), repeating three times. The standard immersion method was used to measure the relative conductivity of Nicotiana benthamiana leaves. Stem segments and roots were taken for analysis of total soluble phenol and lignin content, as detailed in Ana.Citation33
The relative levels of the transcript were accumulated for the NHX1 and SOS1 genes by qPCR using the following primers: NbNHX1 qPCR-F, NbNHX1 qPCR-R, NbSOS1 qPCR-F, NbNHX1 qPCR-F, NbSOS1 qPCR-R (). The primes of LpActin F and LpActin R were used as a control. The expression of CCR1 (Cinnamoyl-CoA Reductase 1, LOC107804645) and CAD (Cinnamyl Alcohol Dehydrogenase, EC 1.1.1.195) involving in lignin biosynthesis were detected by qPCR. The gene-specific primers of qRT-PCR analysis were listed in . The expression of genes was normalized by NbActin with the primers of NbActin-F and NbActin-R.
Tobacco stem and root segments under the same growth conditions were stained by the methods with phloroglucinol, then the results were observed using a light microscope. The details of staining methods are as follow. (1) Slicing the stems section with a blade, before sections with the same size were treated with a drop of concentrated hydrochloric acid, and then leave them for two minutes. This step is not required for root staining. (2) Stain of phloroglucinol was used to stain the sections of roots and stems for 3 minutes. (3) After the samples were successfully stained, the results were observed using a light microscope.
All data are presented as mean ± standard deviation (SD), n = 3. Significant differences were statistically analyzed by Tukey HSD test using GraphPad Prism 8 software (GraphPad, USA).
Screening of LpCPC interacting protein by yeast two‐hybrid
LpCPC was cloned into the pGADT7 vector with the primers LpCPC-EcoR1-F and LpCPC-Sal1-R (). The recombinant plasmids pGADT7-LpCPC were identified by double enzyme digestion (EcoR1and Sal1), then they were transformed into Y2HGold strain. The proteins interacting with pGADT7-LpCPC were screened from the Lilium pumilum Yeast cDNA library. Yeast DNA was extracted and sequenced to obtain the interaction protein sequences.
Results and analysis
Cloning and sequence analysis of LpCPC in Lilium pumilum
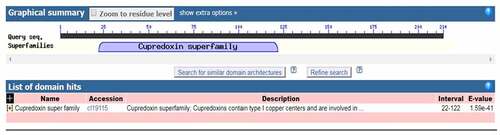
The LpCPC gene was successfully cloned from the leaf of Lilium pumilum. Small blue copper (type I) proteins are also called Cupredoxins. LpCPC has a highly conserved structural domain belonging to the Cupredoxin superfamily at amino acid position 22–122 (), and further BLAST analysis indicated that LpCPC falls into the Stellacyanins.
Figure 1. Analysis of the conserved domains of LpCPC genes.
Homologous sequence alignment and evolutionary tree analysis of LpCPC
According to Blast results, the homologous sequence comparison of the data expounded that the black area in the figure is the highly conserved amino acid region, while the blue part is the similar amino acid sequence region (). The gene was found to be homologous and have similar conserved regions to CPC in other plants, so the gene was named LpCPC. Based on a comparison of amino acid sequences and phylogenetic relationships, the results of the evolutionary tree analysis () showed that LpCPC is classified as a major evolutionary branch with Actinidia chinensis var. Chinensis, Solanum Lycopersicum and Trifolium pratense.
Figure 2. Protein alignment of the LpCPC deduced amino acid sequence with LpCPC proteins from other plant species. The amino acid sequence of this transcript was similar to that alignment of the CPC amino acid sequence from other species: Elaeis guineensis (African oil palm) XP_010922520.1; Dendrobium catenatum XP_020676538.1; Ananas comosus (pineapple) OAY72680.1; Phoenix dactylifera (date palm) XP_008779708.1; Chenopodium quinoa (quinoa) XP_021741754.1; Cucumis sativus (cucumber) XP_031744419.1; Cucumis melo (muskmelon) XP_008461120.1; Ricinus communis (castor bean) EEF35205.1; Ipomoea triloba (trilobed morning glory) XP_031106714.1; Prunus persica (peach) XP_007216148.1; Malus Domestica (apple) XP_008373963.2; Actinidia chinensis var. Chinensis PSS17849.1; Solanum Lycopersicum (Lycopersicon esculentum) XP_010323300.1; Trifolium pratensePNX74705.1).
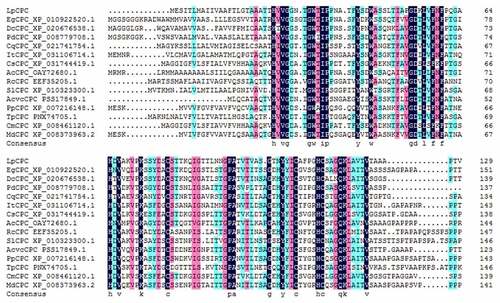
Figure 3. Phylogenetic tree of 14 selected plant CPC proteins. The MEGA3 program was used for the construction of phylogenetic trees. The bar represents 0.1 amino acid substitutions per site.
Analysis of LpCPC expression in different organs of Lilium pumilum
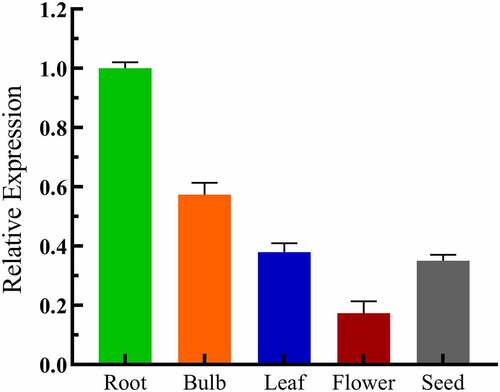
qRT-PCR was performed using cDNA from the roots, bulbs, leaves, flowers, and seeds of Lilium pumilum. The results revealed that the LpCPC was expressed at a higher level in the roots and bulbs, while the lowest level was in the flowers ().
Figure 4. Real-time quantitative PCR analysis of the expression levels of LpCPC genes in different organs in Lilium pumilum. cDNA was obtained from the roots, stems, leaves, flowers, and seeds of Lilium pumilum, and the expression levels of LpCPC were detected by Real-time Quantitative PCR.
Analysis of LpCPC expression in Lilium pumilum under NaHCO3 stress
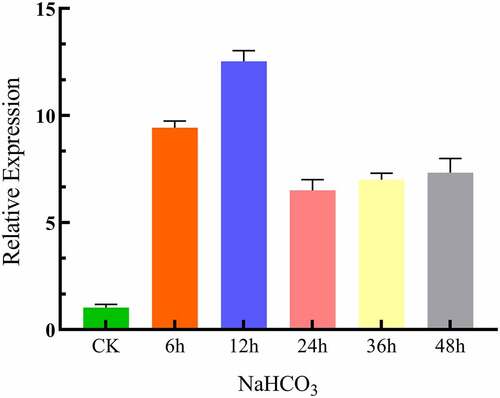
To find out the expression of the LpCPC gene in Lilium pumilum under NaHCO3 stress, qRT-PCR was performed on cDNA of the bulb after being treated by 20 mM NaHCO3 for 6 h, 12 h, 24 h, 36 h, and 48 h. Under 20 mM NaHCO3 treated, the expression of the LpCPC increased and reached the highest level at 12 h (). The analysis revealed that NaHCO3 stress promoted the expression of the LpCPC.
Figure 5. Real-time Quantitative PCR analysis of LpCPC expression in L.Pumilum under NaHCO3 stress, qRT-PCR was performed on bulb cDNA from L.Pumilum with 20 mM NaHCO3 treated for 6 h, 12 h, 24 h, 36 h, and 48 h. CK (No treatment) was used as a control.
Identification of resistance in transgenic yeast under saline stress
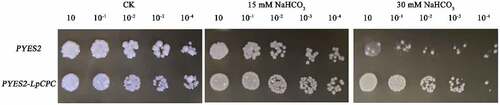
The induced yeast solution was diluted ten times, one hundred times, one thousand times, ten thousand times, and one hundred thousand times in a turn. 3 μL of yeast solution was spotted in SC-U + 2% glucose solid medium and SC-U + 2% glucose solid medium containing 15 mM, 30 mM NaHCO3, and incubated at 30°C for 3 days (). The result indicated that there was no significant difference between transgenic and wild-type yeast in the growth under no saline stress. By contrast, under 15 mM, 30 mM NaHCO3 stress conditions, the transgenic yeast grew better than the control yeast under 10−3 and 10−4 fold dilutions. When the concentration was increased to 30 mM, the control only had little growth, while the transgenic yeast could still produce colonies, demonstrating that the transgenic yeast was more tolerant under high NaHCO3 stress compared with the control. So, the LpCPC gene involved in the NaHCO3 stress reaction in transgenic yeast.
Figure 6. Resistance analysis of transgenic yeast under 0,15 and 30 mM NaHCO3 stress growth of LpCPC transgenic yeast cells under NaHCO3 stress. Ten-fold dilutions of yeast cells containing pYES2 (upper line) and pYES2-LpCPC vector (lower line) were spotted on solid YPG media supplemented with the indicated stresses and grew at 30°C for 3–7 d. No treatment is a control (CK).
Identification of LpCPC overexpression in Nicotiana benthamiana
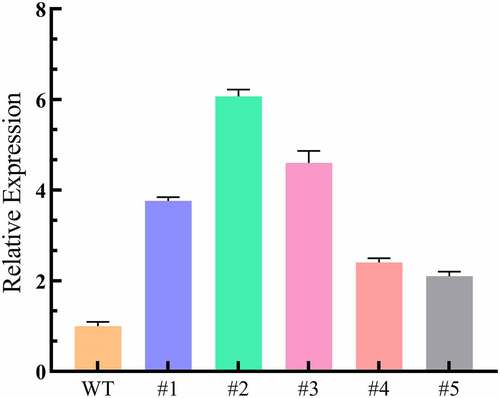
Overexpression Nicotiana benthamiana with LpCPC was quantified by qPCR. The result indicates that the expression of LpCPC in transgenic lines was higher than the wild-type lines (), and transgenic lines #1, #2, and #3 were selected for the subsequent experiment.
Figure 7. Identification of transgenic Nicotiana benthamiana lines by contrasting the expression of LpCPC in the wild-type and transgenic lines using RT-qPCR. WT: wild-type. #1–#5: LpCPC transgenic Nicotiana benthamiana lines.
Phenotypic analysis of tobacco plants under saline stress
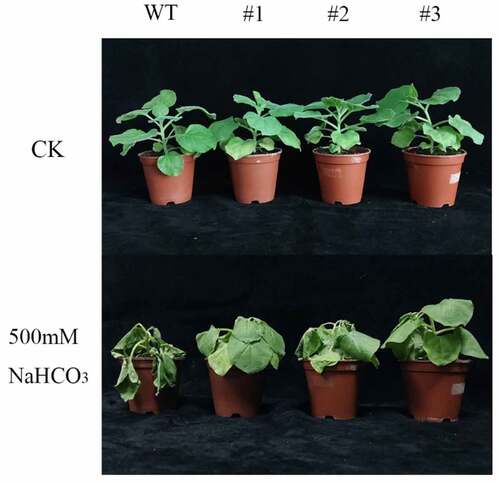
Wild-type and LpCPC transgenic plants in the same growth condition were watered using 500 mM NaHCO3 solution. The results demonstrated that with the accumulation of NaHCO3, plants started to wilt. Compared with the wild type, transgenic plants indicated a relatively lower degree of wilting (). According to the analysis of results, the transgenic plants had higher tolerance to salinity than wild-type plants.
Figure 8. Plant growth between wild-type and LpCPC transgenic plants under 500 mM NaHCO3 stresses. Plant growth in pot supplemented with 0 mM (CK), 500 mM NaHCO3. WT: Wild-type. #1, #2, and #3: LpCPC transgenic lines.
Analysis of the physiological indicators in Nicotiana benthamiana under NaHCO3 stress
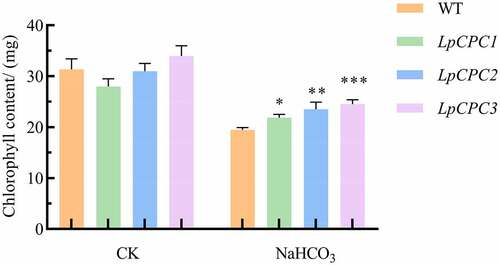
Chloroplasts are destroyed under saline stress and chlorophyll concentration is immediately affected. Chlorophyll was measured on Nicotiana benthamiana leaves before and after NaHCO3 treatment using a SPAD chlorophyll meter. The chlorophyll content of leaves was significantly reduced compared to that before salt stress treatment. Moreover, the chlorophyll content of transgenic plants was higher than that of wild-type (). This revealed that chloroplasts of transgenic plants were less damaged under saline stress.
Figure 9. Chlorophyll content change associated with stress response in wild type and transgenic lines. Plant in the pot was grown either with 500 mM NaHCO3 or without, and samples were harvested 24 h later. Chlorophyll contents were detected in the leaves of wild-type and transgenic lines. Each data point is the average of five replicates, and error bars represent ± SE. Error bars indicate ±SD. *Significance at P < .05, **Significance P < .01, ***Significance P < .001.
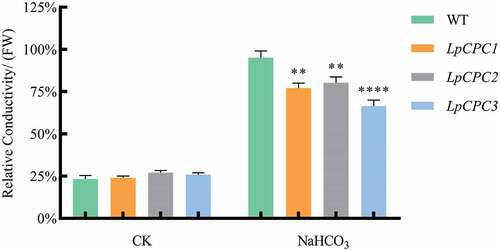
The relative conductivity of plants under stress was significantly higher compared to pre-treatment plants. However, the relative conductivity of transgenic plants was significantly lower than that of wild-type plants (). This demonstrated that Nicotiana benthamiana plants transgenic the LpCPC gene were significantly less cell-damaging compared to wild-type Nicotiana benthamiana plants, which means that plants transgenic the LpCPC gene were more tolerant to salinity.
Figure 10. Relative conductivity change associated with stress response in wild type and transgenic lines. Plant in the pot was grown either with 500 mM NaHCO3 or without, and samples were harvested 24 h later. Relative conductivity was detected in the leaves of wild type and transgenic lines. ****Significance P < .0001.
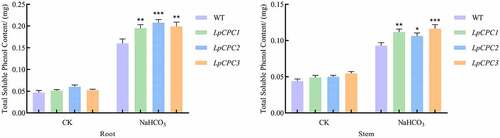
Measurement of total soluble phenol content in stems and roots of unstressed and post-stressed Nicotiana benthamiana. The content of soluble phenols increased with the accumulation of salinity stress. The total soluble phenol content of transgenic plants was higher compared with the wild type (). It can be inferred that overexpression Nicotiana benthamiana has higher phenol oxidase and peroxidase activity,Citation34 superior antioxidant capacity, and greater salinity tolerance.
Figure 11. Total soluble phenol content change associated with stress response in wild type and transgenic lines. Plant growth in the pot was grown either with 500 mM NaHCO3 or without, and samples were harvested 24 h later. Total soluble phenol content was detected in the leaves of wild type and transgenic lines.
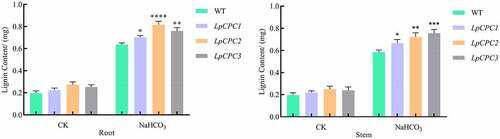
Lignin content was measured in stems and roots of Nicotiana benthamiana. Lignin content increased with the accumulation of salinity stress. Moreover, transgenic plants had more lignin content compared to the wild type (). It can be concluded that Nicotiana benthamiana overexpressing the LpCPC gene is more tolerant to salinity.
Figure 12. lignin content change associated with stress response in wild type and transgenic lines. Plant growth in the pot was grown either with 500 mM NaHCO3 or without, and samples were harvested 24 h later.
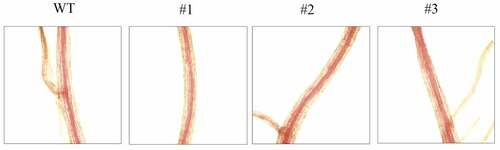
With the standard staining methods of phloroglucinol, analysis of stems and roots of NaHCO3-treated Nicotiana benthamiana indicated that the xylem of plants overexpressing LpCPC gene was significantly larger than that of wild-type ().
Figure 13. Lignin staining analysis of the cross-section of tobacco stem by phloroglucinol-HCl. WT: wild type; #1, #2, #3: staining of roots in Nicotiana benthamiana with over-expressing gene LpCPC.
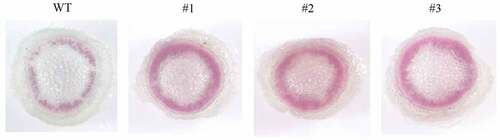
Figure 14. Lignin staining analysis of the cross-section of tobacco root by phloroglucinol-HCl. WT: wild type; #1, #2, #3: staining of roots in Nicotiana benthamiana with over-expressing gene LpCPC.
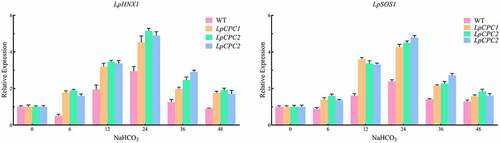
The expression levels of salt stress-related genes (NHX1 and SOS1) were determined under salt conditions. The results indicated that the expression of NHX1 and SOS1 were steadily increased in overexpression lines compared with that of WT ().
Figure 15. qRT-PCR determination of representative gene expression in leaves. The relative expression level of LpHNX1 and LpSOS1 were detected in leaves of wildtype tobacco and transgenic tobacco seedlings exposed to 500 mM NaHCO3 for 0 h, 6 h, 12 h, 24 h, 36 h. 48 h.
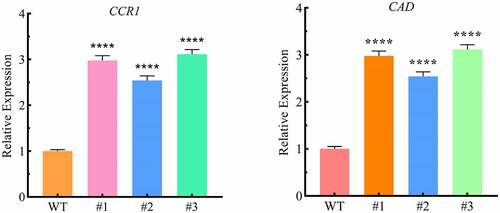
Whether LpCPC transgenic lines could affect the potential lignin biosynthesis gene in tobacco or not. We found that the expression of CCR1 and CAD genes involved in lignin biosynthesis was altered in the transgenic lines (). CCR1 and CAD, involved in lignin biosynthesis were significantly up-regulated in transgenic lines compared with wild-type lines.
Figure 16. Expression of CCR1and CAD, potential lignin biosynthesis genes. The qPCR analysis the expression levels of CCR1 and CAD genes related to lignin biosynthesis. Three biological replicates are used for each transgenic line and wild type.
Screening of LpCPC interacting protein by yeast two-hybrid
The positive protein was obtained from colonies grown on SD/-Trp-Leu-His-Ade+X-α-gal+AbA solid medium turned blue (). Through BLAST these colonies in NCBI, eight proteins were successfully compared. Five of these have been demonstrated to be associated with plant salinity resistance ().
Figure 17. Interactions between LpCPC and selected proteins. Yeast two-hybrid assays were performed by co-transforming strains that were spotted on SD-L-T/SD-L-T-H-A plates to examine potential direct interactions between the proteins. Yeast strains that contained “empty” BD or AD plasmids were used as negative controls. L: Leu, T: Trp, H: His, A adenine, BD: pGBKT7 vector, AD: pGADT7 vector, SD: synthetic dextrose.
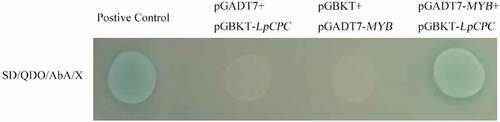
Table 3. Interacting proteins with LpCPC using yeast two-hybrid
Discussion
Biotic and abiotic stresses affect plants’ growth and development. Lilium pumilum is widely distributed and has strong resistance to disease, cold, and salinity. The expression of the LpCPC is significantly up-regulated in bulb transcriptome of Lilium Pumilum under 20 mM NaHCO3. We would like to find what role does LPCPC plays in the salt tolerance of Lilium pumilum. The LpCPC belongs to the blue copper protein family, which is involved in the electron transfer in plant photosynthesis and oxidative stress response. Expression of the blue copper protein family can enhance plant tolerance to biotic and abiotic stresses. For example, the Arabidopsis thaliana’s blue-copper protein gene protects cell walls and cell membranes from aluminum toxicity through electron transfer reactions.Citation44
In this study, the LpCPC gene was cloned from Lilium pumilum, which has the closest relation to CPC from Actinidia chinensis. The results of qRT-PCR revealed that the LpCPC gene was expressed at a higher level in the roots and bulbs, and it functions in the roots and bulbs, which are underground organs. Roots and bulbs are the first two organs to be exposed to salt stress, so the increased expression of LpCPC is conducive to plant resistance under salt stress. Under 20 mM NaHCO3 treated, the expression of the LpCPC increased and reached the highest level at 12 h. It indicated that LpCPC may react immediately and perform its function when plants are exposed to salt stress.
The resistance experiment is carried out in the eukaryote (Yeast). Although some experimental operation is relatively simple, yeast containing the recombinant LpCPC gene grew better under saline stress than the control, suggesting that the LpCPC may be involved in the stress response in yeast, making the transgenic yeast more tolerant to salinity. The chlorophyll content of the transgenic plants after the stress treatment was higher than the wild type, indicating that the chloroplasts of the transgenic plants were significantly less damaged by the stress treatment compared to the wild type. The relative conductivity of the transgenic lines was lower than the wild-type, suggesting that the cell membrane disruption of the transgenic strain was lower than the wild-type. The expression of NHX1 and SOS1 (salt-related marker genes) in overexpression lines were higher than that in WT, indicating that overexpression lines improve the resistance of plants under salt stress.
Phenol is related to salt stress tolerance, and the highest phenol content under salt stress was observed in the highest salt tolerance lines in cucumber.Citation45 Plants exposed to stress are accompanied with an increase in lignin content.Citation46 Multiple plants increase their tolerance to abiotic stresses through lignin accumulation.Citation27–29,Citation46 Silencing the AtBCB gene leads to a reduction of lignin accumulation.Citation47 Cinnamoyl-CoA reductase (CCR) and cinnamyl alcohol dehydrogenase (CAD) related to lignin biosynthesis and its transcriptional regulation are uncovered based on Zhong (2015).Citation48 LpCPC may affect the content of the soluble phenol and lignin under stress, the content of the soluble phenol and the lignin was detected in the roots and stems of transgenic Nicotiana benthamiana and wildtype. Overexpression of LpCPC caused higher expression of both lignin biosynthesis genes. The conserved induction gene expression suggests that LpCPC could retain functions in the regulation of lignin biosynthesis. Overexpression of LpCPC in tobacco enhanced the lignification of the cell wall. These results showed that the transgenic plants had a higher tolerance than the wild type. These physiological indices showed that the LpCPC transgenic lines were more tolerant than wild-type under NaHCO3 treatment.
Further studies are necessary to investigate the response mechanisms of the LpCPC gene involving in plant salinity stress and the synergistic relationships between genes. Eight positive interacting proteins were obtained using yeast two-hybrid, and five of these have been proven to be associated with plant salinity resistance. Gh_D01G0234 (RPL14B) knockdown significantly affected the cotton seedling’s performance under salt stress conditions as evidenced by a significant reduction in various morphological and physiological traits.Citation49 The overexpression of RPL6 resulted in tolerance of moderate (150 mM) and high (200 mM) levels of salt (NaCl).Citation50 Strictosidine synthases (Str), the key gene of terpenoid indole alkaloid biosynthetic pathway in response to salinity stress in Catharanthus roseus.Citation51 High Mobility Group (HMG) proteins are relatively abundant small proteins related to chromatin. The overexpression of HMGB1 decreased the seed germination rate in the presence of NaCl stress. Expression of HMGB2 and HMGB3 was significantly down-regulated under salt stress.Citation52 OsHMGB707 regulates rice tolerance by encouraging the expression of stress-related genes.Citation53 SNF1 (SnRK2) are important components of the signaling pathways of salinity stress in plants. The AtSnRK2 family comprises kinase proteins activated by abscisic acid (ABA). SnRK2s participate in the modulation of root system architecture in response to salinity stress.Citation54 Transcript factor R2R3-MYB participates in salt tolerance in Arabidopsis.Citation39
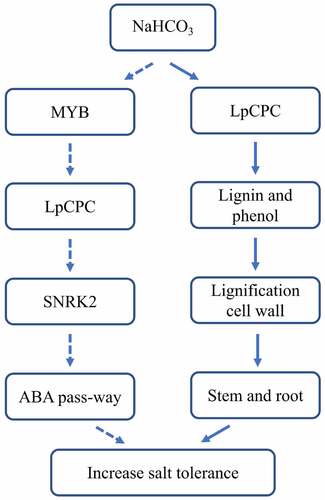
Overexpression lines of LpCPC can increase lignin and phenol content. High content of lignin and phenol content can improve the lignification of the cell wall, which resulted in improved tolerance to salt stresses. Another mechanism of LpCPC regulating plant salt tolerance was involved in the ABA pathway, salt increased the expression of R2R3MYB, MYB may regulate the transcription of LpCPC, LPCPC may interact with SNRK2 to improve the salt tolerance of plants through the ABA pathway ().
Figure 18. A mechanism model for the LpCPC regulating responded and tolerated to salt stress. A mechanism of LpCPC regulating plant salt tolerance was that LpCPC increased the lignification of the cell wall. The gene LpCPC would be directly activated after the treatment of NaHCO3, then contents of lignin and phenol are increased in plants, finally increased the thickness of cell wall in the stem and root. As a result, the tolerance of saline was improved. Another mechanism was involved in the ABA pathway. After NaHCO3 treatment, MYB expression was activated, then MYB expression increased the expression of gene LpCPC. LpCPC interacting with SNRK2. As a result, saline tolerance was enhanced after the activation of gene SNRK2 involving in the ABA pass-way. The solid line represented the experimental verification of the molecular pathway, and the dotted line represented the putative molecular pathway.
Conclusion
In this paper, the LpCPC was cloned based on the transcriptomic data of Lilium pumilum. Subsequently, bioinformatics and analysis of gene expression patterns were performed. The LpCPC gene was transformed into yeast and Nicotiana benthamiana to obtain transgenic strains and plants. The phenotype of transgenic yeast and plants under salinity was analyzed. What’s more, Physiological index analyses including chlorophyll content, relative conductivity, and lignin content revealed that overexpression of the LpCPC gene could improve the salt resistance of transgenic plants. Overexpression tobacco has consistently higher expression of key genes such as NHX1 and SOS1 involving in salt stress response pathways. When compared with wild-type lines, transgenic lines displayed considerably greater amounts of CCR1 and CAD, which are implicated in lignin synthesis. Eight positive interacting proteins were derived from two yeast-hybrids, ribosomal protein, SNF1-related protein kinase, HMG-box (high mobility group) DNA-binding family protein, MYB protein 1, and Strictosidine synthase 3 were shown to be associated with resistance to plant salinity.
Disclosure statement
No potential conflict of interest was reported by the author(s).
Correction Statement
This article has been corrected with minor changes. These changes do not impact the academic content of the article.
Additional information
Funding
References
- Lei F, Zhang H, Long Y, Deng S, Zhang A. Characteristics and phylogenetic analysis of the complete chloroplast genome of Lilium concolor Salisb. (Liliaceae) from Jilin, China. Mitochondrial DNA B Resour. 2022;7(1):30–12. doi:10.1080/23802359.2021.2006816.
- Jin J, Liu H, Zhong C, Xie J, Qin Y, Liang X, Chen L, Cai P, Zhang S. Characterization of the complete chloroplast genome of an endangered ornamental and medicinal plant Lilium pumilum. Mitochondrial DNA B Resour. 2020;5(1):1111–1112. doi:10.1080/23802359.2020.1726228.
- López-Millán AF, Duy D, Philippar K. Chloroplast iron transport proteins - function and impact on plant physiology. Front Plant Sci. 2016;7:178. doi:10.3389/fpls.2016.00178.
- Komori H, Higuchi Y. Structure and molecular evolution of multicopper blue proteins. Biomol Concepts. 2010;1(1):31–40. doi:10.1515/bmc.2010.004.
- Warren JJ, Lancaster KM, Richards JH, Gray HB. Inner- and outer-sphere metal coordination in blue copper proteins. J Inorg Biochem. 2012;115:119–126. doi:10.1016/j.jinorgbio.2012.05.002.
- Rydén LG, Hunt LT. Evolution of protein complexity: the blue copper-containing oxidases and related proteins. J Mol Evol. 1993;36(1):41–66. doi:10.1007/BF02407305.
- Cobley JG, Haddock BA. The respiratory chain of Thiobacillus ferrooxidans: the reduction of cytochromes by Fe2+ and the preliminary characterization of rusticyanin a novel “blue” copper protein. FEBS Lett. 1975;60(1):29–33. doi:10.1016/0014-5793(75)80411-x.
- De Rienzo F, Gabdoulline RR, Menziani MC, Wade RC. Blue copper proteins: a comparative analysis of their molecular interaction properties. Protein Sci: A Publ Protein Soc. 2000;9(8):1439–1454. doi:10.1110/ps.9.8.1439.
- Cao J, Li X, Lv Y, Ding L. Comparative analysis of the phytocyanin gene family in 10 plant species: a focus on Zea mays. Front Plant Sci. 2015;6:515. eCollection 2015. doi:10.3389/fpls.2015.00515.
- Höhner R, Pribil M, Herbstová M, Lopez LS, Kunz HH, Li M, Wood M, Svoboda V, Puthiyaveetil S, Leister D, et al. Plastocyanin is the long-range electron carrier between photosystem II and photosystem I in plants. Proc Natl Acad Sci U S A. 2020;117(26):15354–15362. doi:10.1073/pnas.2005832117.
- Gough J, Chothia C. The linked conservation of structure and function in a family of high diversity: the monomeric cupredoxins. Structure (London, England: 1993). 2004;12(6):917–925. doi:10.1016/j.str.2004.03.029.
- Nersissian AM, Shipp EL. Blue copper-binding domains. Adv Protein Chem. 2002;60:271–340. doi:10.1016/s0065-3233(02)60056-7.
- Armstrong GD, Chapman SK, Sisley MJ, Sykes AG, Aitken A, Osheroff N, Margoliash E. Preferred sites on cytochrome c for electron transfer with two positively charged blue copper proteins, Anabaena variabilis plastocyanin and stellacyanin. Biochemistry. 1986;25(22):6947–6951. doi:10.1021/bi00370a031.
- Van Gysel A, Van Montagu M, Inzé D. A negatively light-regulated gene from Arabidopsis thaliana encodes a protein showing high similarity to blue copper-binding proteins. Gene. 1993;136(1–2):79–85. doi:10.1016/0378-1119(93)90450-h.
- Katoh S. Early research on the role of plastocyanin in photosynthesis. Photosynth Res. 2003;76(1–3):255–261. doi:10.1023/A:1024924711453.
- Lan Y, Zhang K, Wang Y, Wu J, Lin M, Yan H, Xiang Y. Comparative analysis of the stellacyanins (SCs) family and focus on drought resistance of PtSC18 in Populus trichocarpa. Gene. 2022;813:146106. doi:10.1016/j.gene.2021.146106.
- Ezaki B, Katsuhara M, Kawamura M, Matsumoto H. Different mechanisms of four aluminum (Al)-resistant transgenes for Al toxicity in Arabidopsis. Plant Physiol. 2001;127(3):918–927. doi:10.1007/s00425-010-1326-3.
- Ezaki B, Sasaki K, Matsumoto H, Nakashima S. Functions of two genes in aluminium (Al) stress resistance: repression of oxidative damage by the AtBCB gene and promotion of efflux of Al ions by the NtGDI1gene. J Exp Bot. 2005;56(420):2661–2671. doi:10.1093/jxb/eri259.
- Zhang JP, Yu Y, Feng YZ, Zhou YF, Zhang F, Yang YW, Lei MQ, Zhang YC, Chen YQ. MiR408 regulates grain yield and photosynthesis via a phytocyanin protein. Plant Physiol. 2017;175(3):1175–1185. doi:10.1104/pp.17.01169.
- Ruan XM, Luo F, Li DD, Zhang J, Liu ZH, Xu WL, Huang GQ, Li XB. Cotton BCP genes encoding putative blue copper-binding proteins are functionally expressed in fiber development and involved in response to high-salinity and heavy metal stresses. Physiol Plant. 2011;141(1):71–83. doi:10.1111/j.1399-3054.2010.01420.x.
- Wu H, Shen Y, Hu Y, Tan S, Lin Z. A phytocyanin-related early nodulin-like gene, BcBCP1, cloned from Boea crassifolia enhances osmotic tolerance in transgenic tobacco. J Plant Physiol. 2011;168(9):935–943. doi:10.1016/j.jplph.2010.09.019.
- Rao YR, Ansari MW, Sahoo RK, Wattal RK, Tuteja N, Kumar VR. Salicylic acid modulates ACS,NHX1,sos1 and HKT1;2 expression to regulate ethylene overproduction and Na(+) ions toxicity that leads to improved physiological status and enhanced salinity stress tolerance in tomato plants cv.Pusa Ruby. Plant Signal Behav. 2021;16(11):1950888. doi:10.1080/15592324.2021.1950888.
- Li SJ, Wu GQ, Lin LY. AKT1,HAK5,SKOR,HKT1;5,SOS1 and NHX1 synergistically control Na + and K + homeostasis in sugar beet (Beta vulgaris L.) seedlings under saline conditions. J Plant Biochem Biot. 2021;31(1):71–84. doi:10.1007/s13562-021-00656-2.
- Calzone A, Cotrozzi L, Pellegrini E, Lorenzini G, Maathuis F, Maathuis F. Can the transcriptional regulation of NHX1, SOS1 and HKT1 genes handle the response of two pomegranate cultivars to moderate salt stress? Sci Hortic (Amsterdam). 2021;288:110309. doi:10.1016/j.scienta.2021.110309.
- Zhao Q, Dixon RA. Transcriptional networks for lignin biosynthesis: more complex than we thought? Trends Plant Sci. 2011;16(4):227–233. doi:10.1016/j.tplants.2010.12.005.
- Jbir N, Chaïbi W, Ammar S, Jemmali A, Ayadi A. Root growth and lignification of two wheat species differing in their sensitivity to NaCl, in response to salt stress. Comptes rendus de l’Academie des sci Serie III, Sci de la vie. 2001;324(9):863–868. doi:10.1016/s0764-4469(01)01355-5.
- Shafi A, Dogra V, Gill T, Ahuja PS, Sreenivasulu Y, Pandey GK. Simultaneous over-expression of PaSOD and RaAPX in transgenic Arabidopsis thaliana confers cold stress tolerance through increase in vascular lignifications. PLoS One. 2014;9(10):e110302. doi:10.1371/journal.pone.0110302.
- Park SC, Kim YH, Jeong JC, Kim CY, Lee HS, Bang JW, Kwak SS. Sweetpotato late embryogenesis abundant 14 (IbLEA14) gene influences lignification and increases osmotic- and salt stress-tolerance of transgenic calli. Planta. 2011;233(3):621–634. doi:10.1007/s00425-010-1326-3.
- Kim MD, Kim YH, Kwon SY, Yun DJ, Kwak SS, Lee HS. Enhanced tolerance to methyl viologen-induced oxidative stress and high temperature in transgenic potato plants overexpressing the CuZnSOD, APX and NDPK2 genes. Physiol Plant. 2010;140(2):153–162. doi:10.1111/j.1399-3054.2010.01392.x.
- Liang Y, Yuan S, Feng H, Xu L, Yuan Y, Liu C, Ming J. Cloning and expression analysis of actin gene(lilyActin)from Lily. Acta Horticulturae Sinica. 2013;40:1318–1326.
- Gietz D, St Jean A, Woods RA, Schiestl RH. Improved method for high efficiency transformation of intact yeast cells. Nucleic Acids Res. 1992;20(6):1425. doi:10.1093/nar/20.6.1425.
- Ha JH, Jang HA, Moon KB, Baek KH, Choi GJ, Choi D, Cho HS, Kwon SY, Jeon JH, Oh SK, et al. Nicotiana benthamiana matrix metalloprotease 1 (NMMP1) gene confers disease resistance to phytophthora infestans in tobacco and potato plants. J Plant Physiol. 2017;218:189–195. doi:10.1016/j.jplph.2017.08.010.
- de Ascensao AR, Dubery IA. Soluble and wall-bound phenolics and phenolic polymers in Musa acuminata roots exposed to elicitors from Fusarium oxysporum f.sp. cubense. Phytochemistry. 2003;63(6):679–686. doi:10.1016/s0031-9422(03)00286-3.
- Min L, Geng Y, Cong R, Liu D, University BF. Impacts of wood vinegar on enzyme activity in saline alkaline soil. Sci Soil Water Conserv. 2015;13:112–117.
- Petibon C, Ghulam MM, Catala M, Elela SA. Regulation of ribosomal protein genes: an ordered anarchy. Wiley Interdiscip Rev RNA. 2021;12(3):e1632. doi:10.1002/wrna.1632.
- Chen X, Ding Y, Yang Y, Song C, Wang B, Yang S, Guo Y, Gong Z. Protein kinases in plant responses to drought, salt, and cold stress. J Integr Plant Biol. 2021;63(1):53–78. doi:10.1111/jipb.13061.
- Lildballe DL, Pedersen DS, Kalamajka R, Emmersen J, Houben A, Grasser KD. The expression level of the chromatin-associated HMGB1 protein influences growth, stress tolerance, and transcriptome in Arabidopsis. J Mol Biol. 2008;384(1):9–21. doi:10.1016/j.jmb.2008.09.014.
- Prouse MB, Campbell MM. The interaction between MYB proteins and their target DNA binding sites. Biochim Biophys Acta Gene Regul Mech. 2012;1819(1):67–77. doi:10.1016/j.bbagrm.2011.10.010.
- Gong Q, Li S, Zheng Y, Duan H, Xiao F, Zhuang Y, He J, Wu G, Zhao S, Zhou H, et al. SUMOylation of MYB30 enhances salt tolerance by elevating alternative respiration via transcriptionally upregulating AOX1a in Arabidopsis. Plant Journal. 2020 [Epub 2020 Feb 18];102(6):1157–1171. doi:10.1111/tpj.14689.
- Yuan M, Wang S. Rice MtN3/saliva/SWEET family genes and their homologs in cellular organisms. Mol Plant. 2013 [Epub 2013 Feb 21];6(3):665–674. doi:10.1093/mp/sst035.
- Zeng XW, Liu CC, Han N, Bian HW, Zhu MY. Progress on the autophagic regulators and receptors in plants. Yi Chuan. 2016;38(7):644–650. doi:10.16288/j.yczz.15-525.
- Stöckigt J, Barleben L, Panjikar S, Loris EA. 3D-Structure and function of strictosidine synthase–the key enzyme of monoterpenoid indole alkaloid biosynthesis. Plant Physiol Biochem. 2008;46(3):340–355. doi:10.1016/j.plaphy.2007.12.011.
- Pospisilova H, Frebort I. Aminohydrolases acting on adenine, adenosine and their derivatives. Biomed Pap Med Fac Univ Palacky Olomouc Czech Repub. 2007;151(1):3–10. doi:10.5507/bp.2007.001.
- Ezaki B, Gardner RC, Ezaki Y, Matsumoto H. Expression of aluminum-induced genes in transgenic arabidopsis plants can ameliorate aluminum stress and/or oxidative stress. Plant Physiol. 2000;122(3):657–665. doi:10.1104/pp.122.3.657.
- Tiwari JK, Munshi AD, Kumar R, Pandey RN, Arora A, Bhat JS, Sureja AK. Effect of salt stress on cucumber: na+–K+ ratio, osmolyte concentration, phenols and chlorophyll content. Acta Physiologiae Plantarum. 2010;32(1):103–114. doi:10.1007/s11738-009-0385-1.
- Moura JC, Bonine CA, de Oliveira Fernandes Viana J, Dornelas MC, Mazzafera P. Abiotic and biotic stresses and changes in the lignin content and composition in plants. J Integr Plant Biol. 2010;52(4):360–376. doi:10.1111/j.1744-7909.2010.00892.x.
- Zhu W, Gao E, Shaban M, Wang Y, Wang H, Nie X, Zhu L. GhUMC1, a blue copper-binding protein, regulates lignin synthesis and cotton immune response. Biochem Biophys Res Commun. 2018;504(1):75–81. doi:10.1016/j.bbrc.2018.08.128.
- Zhong R, Ye ZH. Secondary cell walls: biosynthesis, patterned deposition and transcriptional regulation. Plant Cell Physiol. 2015;56(2):195–214. doi:10.1093/pcp/pcu140.
- Shiraku M, Magwanga RO, Cai X, Kirungu JN, Fang L, Mehari TG, HOU Y, Wang Y, Wang K, Peng R. Knockdown of 60S ribosomal protein L14-2 reveals their potential regulatory roles in enhancing drought and salt tolerance in cotton. J Cotton Res. 2021;4(4):14. doi:10.1186/s42397-021-00102-7.
- Moin M, Saha A, Bakshi A, Madhav MS, Kirti PB. Constitutive expression of ribosomal protein L6 modulates salt tolerance in rice transgenic plants. Gene. 2021;789:145670. doi:10.1016/j.gene.2021.145670.
- Dutta A, Sen J, Deswal R. New evidences about strictosidine synthase (Str) regulation by salinity, cold stress and nitric oxide in Catharanthus roseus. J Plant Biochem Biotechnol. 2013;22(1):124–131. doi:10.1007/s13562-012-0118-1.
- Kwak KJ, Kim JY, Kim YO, Kang H. Characterization of transgenic Arabidopsis plants overexpressing high mobility group B proteins under high salinity, drought or cold stress. Plant Cell Physiol. 2007;48(2):221–231. doi:10.1093/pcp/pcl057.
- Xu K, Chen S, Li T, Yu S, Zhao H, Liu H, Luo L. Overexpression of OsHMGB707, a high mobility group protein, enhances rice drought tolerance by promoting stress-related gene expression. Front Plant Sci. 2021;12:711271. doi:10.3389/fpls.2021.711271.
- Kawa D, Meyer AJ, Dekker HL, Abd El Haliem AM, Gevaert K, Van-De-Slijke E, Maszkowska J, Bucholc M, Dobrowolska G, De Jaeger G, et al. SnRK2 protein kinases and mRNA decapping machinery control root development and response to salt. Plant Physiol. 2020;182(1):361–377. doi:10.1104/pp.19.00818.