
Abstract
For applications in micro- and nanotechnologies the lateral resolution of optical 3-D microscopes becomes an issue of increasing relevance. However, lateral resolution of 3-D microscopes is hard to define in a satisfying way. Therefore, we first study the measurement capabilities of a highly resolving white-light interference (WLI) microscope close to the limit of lateral resolution. Results of measurements and simulations demonstrate that better lateral resolution seems to be achievable based on the envelope evaluation of a WLI signal. Unfortunately, close to the lateral resolution limit errors in the measured amplitude of micro-structures appear. On the other hand, results of interferometric phase evaluation seem to be strongly low-pass filtered in this case.
Furthermore, the instrument transfer characteristics and the lateral resolution capabilities of WLI instruments are also affected by polarization. TM polarized light is less sensitive to edge diffraction and thus systematic errors can be avoided. However, apart from ghost steps due to fringe order errors, the results of phase evaluation seem to be closer to the real surface topography if TE polarized light is used. The lateral resolution can be further improved by combining WLI and structured illumination microscopy. Since the measured height of rectangular profiles close to the lateral resolution limit is generally too small compared to the real height, we introduce a method based on phase evaluation which characterizes the heights of barely laterally resolved rectangular gratings correctly.
NOMENCLATURE
| 2/3-D | = |
two/three-dimensional |
| ITF | = |
instrument transfer function |
| MTF | = |
modulation transfer function |
| ISO | = |
International Organization of Standardization |
| TM | = |
transverse-magnetic |
| TE | = |
transverse-electric |
| WLI | = |
white-light interferometry |
| SIM | = |
structured illumination microscopy |
| DMD | = |
digital micromirror device |
| PV | = |
peak-to-valley |
| NA | = |
numerical aperture |
| DVD | = |
digital versatile disc |
| FT | = |
Fourier transform |
| λ | = |
light wavelength |
| δ Rayleigh | = |
Rayleigh resolution |
| δ | = |
Dirac delta function |
| f s | = |
spatial frequency |
| f c | = |
spatial carrier frequency |
| Δh | = |
height difference |
| I | = |
signal intensity |
1. INTRODUCTION
3-D optical microscopes such as white-light interference microscopes, confocal microscopes, and structured illumination microscopes are well-established instruments in micro- and nanotechnology.
As structure dimensions are becoming smaller these instruments need to operate close to their lateral resolution limits. In context with lateral resolution interference microscopes are often assumed to work linear, i.e., the spatial frequency transfer characteristic related to a measured profile is supposed to be a band-pass filter with a higher edge frequency according to the Rayleigh resolution limit (see ISO 25178-604). However, linear transfer characteristics can be assumed only if the maximum height differences on the measured surface are very small compared to half the wavelength of light. In this weak amplitude approximation the original phase object is treated as an amplitude object. Under this condition the instrument transfer function (ITF) of an interference microscope agrees with the modulation transfer function (MTF) of a conventional light microscope.[ Citation 1 ] As a consequence an ITF value of 0.5, which means that the measured amplitude of a sinusoidal surface is 50% of the real amplitude, occurs if the period of the sinusoid is twice the lateral resolution limit according to the Rayleigh criterion.[ Citation 2 ] This is defined as the lateral resolution of an interference microscope (ISO 25178-604).
Though, if the surface height differences exceed several tens of nanometers the weak amplitude approximation no longer holds and different transfer characteristics occurs leading to different lateral resolution.[ Citation2-4 ] For example, it was pointed out that the shape of a measured rectangular surface grating depends on the evaluation wavelength used for phase evaluation.[ Citation 4 ] Hence, by an appropriate wavelength adaption the measured surface profile comes closer to the real profile. If the envelope position is evaluated, the results depend on both, the central wavelength and the coherence length of the used light.[ Citation 3 , Citation 5 ]
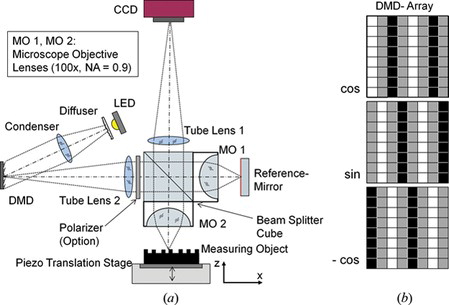
For the results shown here, we use a Linnik interferometer according to Figure (a) providing a magnification of 100× and a numerical aperture NA = 0.9. In order to have full access to all components of the system we built this interferometer in our lab using commercially available components. The Rayleigh resolution of the instrument at λ = 600 nm is 0.4 µm. In an advanced configuration we combine the Linnik interferometer with a programmable structured illumination unit based on a digital micro-mirror array (DMD) also shown in Figure (a). This allows studying the benefits of either confocal or structured illumination in white-light interference microscopy. Furthermore, the micro-mirror device can be used for bright field illumination too. In addition, blocking the reference arm of the Linnik interferometer enables us to investigate confocal or structured light microscopy without interference phenomena. In the following sections we address three points of our research, namely the characteristics of WLI instruments at the lateral resolution limit, the polarization dependence of white-light interferometry (WLI) measurements close to the lateral resolution limit as well as a combination of WLI and structured illumination microscopy (SIM) in order to improve the lateral resolution capabilities.[ Citation 6 , Citation 7 ] A similar approach has been recently applied in digital holographic microscopy.[ Citation 8 ] As reported by Dan et al. a DMD device can be applied to generate illumination patterns in SIM.[ Citation 9 ]
Figure 1 (a) Scheme of the Linnik interferometer configuration with a digital micro-mirror device (DMD) used for either full field or structured illumination using a DMD, (b) subsection of 8 × 8 DMD pixels showing a structured illumination sequence.
2. WLI MEASUREMENT OF PIT STRUCTURES
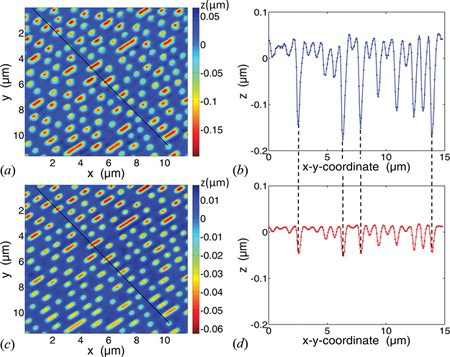
As an example of the capability of the instrument operated as a conventional WLI microscope Figure shows measurement results obtained from a DVD (digital versatile disc) structure with a nominal pit depth of approximately 100 nm. Figure (a) and (b) display the results of determining the envelope positions of coherence scanning interference signals and plot the resulting 3-D topography (a) or a 2-D profile (b) along the line plotted in Figure (a). Figure (c) and (d) exhibit the corresponding results of the interferometric phase evaluation by a lock-in technique[ Citation 10 ] of the same set of interference signals. In both cases the DVD structure is well-resolved. However, the measured depths of the pits differ from their nominal depth in a characteristic way: The depth of the pits obtained from the results of envelope evaluation is approximately 150 nm, whereas phase evaluation leads to a measured pit depth of only 50 to 60 nm. This is a typical result often observed in WLI measurements: As structure dimensions are close to the lateral resolution limit phase evaluation measures surface amplitudes too small whereas the height differences appear too high if the envelope is evaluated.
Figure 2 (a) 3-D topography of a DVD structure obtained by determination of the envelope's position in WLI, (b) profile of the topography along the line plotted in (a); (c) same 3-D topography obtained by evaluating the phase of the WLI signals, (d) profile of the topography along the line plotted in (c).
In order to study these effects systematically, we carried out simulations of WLI measurements of grooves of different depth and width. The simulation is based on Kirchhoff diffraction theory and models the whole WLI depth scan, finally leading to interference signals which can be evaluated by the same algorithms as the original WLI signals obtained from measurement.[ Citation 3 ] The simulation model considers that, due to the obscuration by the edges less light reflected from the bottom of the profile contributes to the WLI signal.
The simulation results are assembled in Figure . Each subfigure represents a groove of well-defined width and depth. The diagrams depict the original groove profiles together with the simulated WLI results obtained from envelope and phase evaluation. The groove depth decreases from left to right, whereas the groove width increases from bottom to top. Obviously, the groove profile resulting from WLI measurement depends on the both, the depth and width of the groove. If the width of the groove corresponds to twice the Rayleigh resolution δ Rayleigh apart from edge effects the correct height value results independently of the depth of the groove. If the groove width equals the Rayleigh resolution especially the result of envelope evaluation differs from the original groove profile. The strongest discrepancy occurs for a groove depth of λ/4, where the batwing effect is maximal.[ Citation 3 ] Note that the wavelength which needs to be considered here is an effective wavelength. This effective wavelength differs from the wavelength value used to obtain the lateral resolution e.g., from the Rayleigh criterion. It exceeds the central wavelength of the light source due to the numerical aperture effect occurring if high aperture objective lenses are used.[ Citation11-13 ]
Figure 3 Simulations of WLI measurement results for single rectangular grooves of different depths and widths showing the original groove profile (dotted lines), the profile obtained from envelope evaluation (black lines) of WLI signals and the profile obtained via phase evaluation (gray lines).
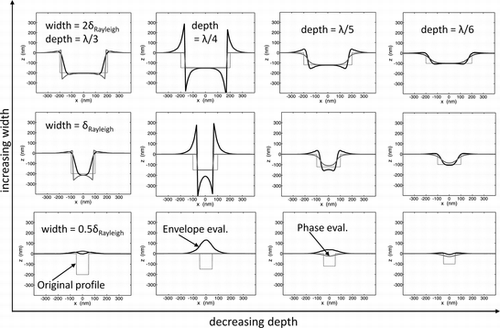
Since the batwings overlap as the groove width decreases an elevation can be observed in the groove obtained from envelope evaluation corresponding to a depth of λ/4 and a width of half the Rayleigh resolution limit. Finally, the simulation results confirm that the profiles obtained from phase evaluation suffer from a low pass filtering effect as the groove width decreases.
3. DEPENDENCE ON POLARIZATION
The measuring object used throughout the following sections is the RS-N resolution standard produced by SiMetrics.[ Citation 14 ] This standard comprises nine one-dimensional rectangular gratings with pitch lengths between 0.3 µm and 6 µm and peak-to-valley (PV) amplitudes ranging from 140 nm to 193 nm etched in a silicon substrate. Nevertheless, the results shown in the following are not restricted to periodical or one-dimensional structures only.
As it is indicated in Figure (a) a polarizer can be placed in the illumination path of the interferometer in order to study the dependence of the measurement results on polarization. According to Figure (a) the xz plane represents the plane of incidence and x is the lateral coordinate of the one-dimensional height structure h(x). The light is TE or s polarized, if the vector of electric field is oriented in the direction of the y axis and TM or p polarized, if the vector of magnetic field shows in the direction of the y axis. According to an earlier investigation by Tavrov et al.[ Citation 15 ]there should be significant polarization influence, especially if rectangular structures are measured. Figure displays height profiles obtained with full field illumination from a grating of 0.8 µm pitch length and 170 nm PV-amplitude. For the results shown in Figure (a) non-polarized light was used for reference. For Figure (b) TE polarized light was used, whereas the results according to Figure (c) correspond to TM polarization. The upper curves in the diagrams of Figure are obtained by evaluating the position of the envelope of a WLI signal, the lower curves result if the phase of the interference signals is evaluated.
Figure 4 Polarization dependence of WLI measurement results of a one-dimensional rectangular grating of 0.8 µm pitch length and 170 nm PV-amplitude, upper curves: results of envelope evaluation, lower curves: results obtained from phase evaluation, using a) non-polarized light, b) TE polarized light, and c) TM polarized light.
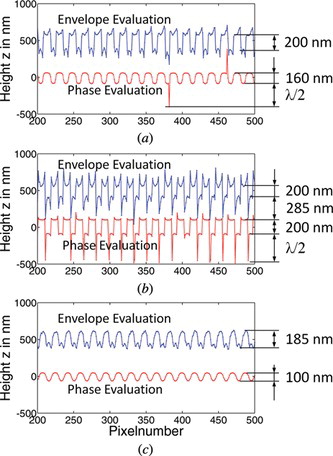
It is well known that an optical grating can be used as a polarizer.[ Citation 16 ] Hence, it was to be expected that the edges of the measured profiles appear low-pass filtered and the rectangular structure is hard to recognize if TM polarized light is used. Nevertheless, the profile according to Figure (c) obtained from envelope evaluation shows nearly the correct period and amplitude, whereas the result of phase evaluation is characterized by low-pass filtering with approximately 50% amplitude transfer at 0.8 µm period as it is predicted by the above mentioned considerations (see Sect. 1). In the case of TE polarization batwings appear at the edges for both kinds of evaluation, i.e., the light from the edges becomes more dominant (see Figure (b)). The measured amplitude seems to be too high. Due to the strong batwings in the envelope evaluation result phase jumps appear in the result of phase evaluation. These arise from fringe order errors based on the envelope evaluation result according to Figure (b). Apart from the regions close to the edges the phase evaluation yields nearly the correct rectangular shape of the profile. Comparison of the results obtained for TM and TE polarization demonstrates that the transfer characteristic of an optical profiler does not only depend on the period and the amplitude of the (rectangular) measuring object but also on the polarization state of the used light.
4. COMBINATION OF WLI AND SIM
A lateral resolution down to the Rayleigh limit or even below is hard to achieve with a conventional optical profiler, since there are disturbing effects such as batwings on the one hand and low-pass filtering effects on the other.
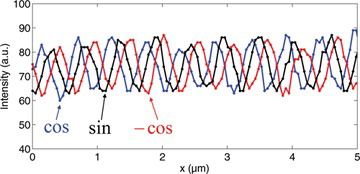
In order to improve the lateral resolution capabilities we combine WLI with the SIM technique.[ Citation 6 , Citation 7 ] The structured low-coherent illumination is based on the DMD array shown in Figure (a). Three approximately sinusoidal fringe patterns according to Figure (b) are generated to illuminate the object under investigation sequentially. Intensity signals obtained from a single line of the CCD corresponding to the three different illumination patterns are shown in Figure exemplarily. To explain the basic idea we assume a white-light interference pattern I (x,z) depending on the lateral x coordinate and the position z of the depth scanner, as well as a structured light illumination sequence with the spatial carrier frequency f c given by:
Figure 5 Illuminating intensity patterns according to Figure 1(b) on the surface of the specimen, captured by a single CCD line.
Fourier transform of Equations 1 and 3 with respect to the x coordinate denoted as FT x {…} first results in the Fourier transform of I (x, z):
The frequency shifted Fourier transform of I (x, z) is then given by:
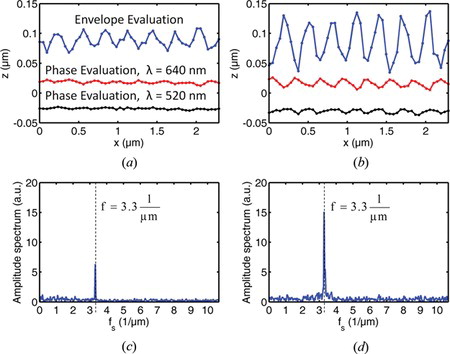
The convolution with the δ-function shifts the high frequency contributions of I (x, z) to lower spatial frequencies f x which pass the aperture of the microscope objective. If these contributions are shifted numerically to the correct frequency in the spatial frequency domain and the low-frequency components are added, an interference pattern with enhanced high spatial frequency information results. This procedure must be repeated for all scanner positions along the z axis in order to obtain an image stack, which can be evaluated with conventional WLI signal processing algorithms. Figure shows a comparison of results of conventional WLI (a) and the combination of WLI and SIM (b). The grating pitch length of 0.3 µm is below the Rayleigh resolution limit of the imaging system. By combining WLI and SIM the lateral resolution capabilities could be significantly improved. Although the contrast of the structured illumination patterns shown in Figure is low and the patterns are not perfectly sinusoidal, the measured amplitude of the grating has doubled as the spectra shown in Figure (c) and (d) reveal. Although the pitch length of the grating can be obtained from the results shown in Figure (b) the measured PV amplitude is lower than the nominal value of 140 nm. Furthermore, in Figure (b) the profiles obtained from phase evaluation are phase shifted depending on the evaluation wavelength (640 nm or 520 nm, respectively). Obviously, the phase of the wavefront in the measuring arm of the interferometer no longer reflects the correct rectangular structure of the measured phase object.
Figure 6 WLI measurement results obtained from a rectangular grating of 0.3 µm pitch length and 0.14 µm PV-amplitude; (a) using WLI with conventional bright field illumination, (b) using sinusoidal illumination according to Figure 1(b); (c) and (d): the amplitude spectra of the profiles obtained by envelope evaluation.
5. STEP HEIGHT MEASUREMENT OF BARELY RESOLVED RECTANGULAR STRUCTURES
Based on the phase evaluation results corresponding to different evaluation wavelengths according to Figure (b) an interesting effect can be observed, if the evaluation wavelength used for the phase evaluation is systematically varied and the standard deviation of the calculated profile is analyzed. This result is shown in Figure .
Figure 7 Standard deviation of the phase evaluation result depending on the evaluation wavelength; the wavelength at the minimum corresponds to a height difference Δh = λ/4.
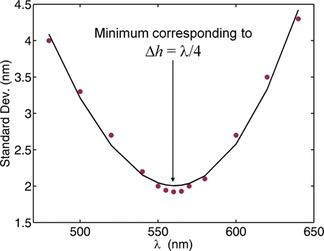
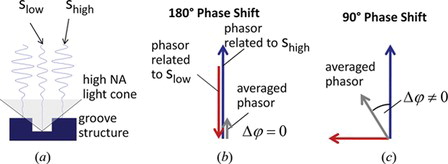
The diagram exhibits a minimum value at a wavelength of 560 nm, which corresponds to 4 times the PV-amplitude of the rectangular profile. At this wavelength the waves reflected from the upper and the lower level of the grating are 180° phase shifted. Since the intensity of the light reflected from the upper level is higher compared to the intensity of light from the lower level the resulting interference signal is minimally affected if a 180° phase shift or an integer multiple of 180° can be assumed. This is explained in Figure by a phasor model where the two WLI signals from the upper and the lower level correspond to different phasors in the complex plane. Due to diffraction these phasors are averaged.
Figure 8 (a) Phasor model related to Figure 7, (b) for a phase shift of an integer multiple of 180° the averaged phase compared to the stronger signal (from the higher level) remains unchanged, (c) in all other cases the averaged phase value differs from the phase value related to the signal from the higher level.
Different intensity of light reflected from the upper and the lower level of a rectangular grating is a consequence of the relatively high aspect ratio and the high numerical aperture of the objective lens. For the lower level part of the illumination aperture will be obscured by the edges of the grating. This means that the standard deviation of the result of phase evaluation for such a structure will be at a minimum if the real height difference is an integer multiple of a quarter of the evaluation wavelength as it is shown in Figure . This consideration results in the correct PV-value of the measuring object. Note that the procedure is basically independent on whether the WLI signals are obtained by conventional full field illumination or by a combination of WLI and SIM.
6. CONCLUSION
In this contribution we study the measurement capabilities of a highly resolving WLI microscope close to the limit of lateral resolution. Measurement results and simulations demonstrate that higher lateral resolution seems to be achievable based on the envelope evaluation. The envelope position is more affected by batwings, whereas the results of phase evaluation can be described by a low-pass filtering process.
In addition, it is shown that the instrument transfer characteristics and the lateral resolution capabilities of WLI instruments are also affected by polarization. TM polarized light is less sensitive to edge diffraction and thus batwings can be nearly avoided. However, apart from ghost steps due to fringe order errors, the results of phase evaluation seem to be closer to the real surface topography if TE polarized light is used.
Furthermore, in a preliminary investigation the lateral resolution could be improved by combining WLI and SIM. Analysis of the measured interference signals at different evaluation wavelengths yields the correct height of a rectangular grating profile although the measured profile doesn't show the correct amplitude. Further effort is necessary to reduce the noise of the structured illumination intensity patterns and, thereby, to improve the measuring uncertainty for such high frequency structures.
An interesting subject for future investigations is WLI based on structured illumination using polarized light.
Notes
Color versions of one or more of the figures in the article can be found online at www.tandfonline.com/uopt.
REFERENCES
- De Groot , P. ; Colonna de Lega , X. Interpreting interferometric height measurements using the instrument transfer function . Proc. Fringe 2005 , 30 – 37 .
- Lehmann , P. ; Xie , W. ; Kühnhold , P. ; Niehues , J. Interferometric measurement of functional surfaces . SPIE Proc. 2013 , 8769 , 876904 .
- Xie , W. ; Lehmann , P. ; Niehues , J. Lateral resolution and transfer characteristics of vertical scanning white-light interferometers . Appl. Opt. 2012 , 51 , 1795 – 1803 .
- Lehmann , P. ; Xie , W. ; Niehues , J. Transfer characteristics of rectangular phase gratings in interference microscopy . Opt. Lett. 2012 , 37 , 758 – 760 .
- Harasaki , A. ; Wyant , J.C. Fringe modulation skewing effect in white-light vertical scanning interferometry . Appl. Opt. 2000 , 39 , 2101 – 2106 .
- Lukosz , W. ; Marchand , M. Optischen Abbildung unter Überschreitung der beugungsbedingten Auflösungsgrenze . Optica Acta 1963 , 10 , 241 – 255 .
- Gustafsson , M.G.L. Surpassing the lateral resolution limit by a factor of two using structured illumination microscopy . J. Microscopy 2000 , 198 , 82 – 87 .
- Gao , P. ; Pedrini , G. ; Osten , W. Resolution enhancement and autofocusing in digital holographic microscopy using structured illumination . SPIE Proc. 2013 , 8788 , 09-1 – 09-7 .
- Dan , D. ; Lei , M. ; Yao , B. ; Wang , W. ; Winterhalder , M. ; Zumbusch , A. ; Qi , Y. ; Xia , L. ; Yan , S. ; Yang , Y. ; Gao , P. ; Ye , T. ; Zhao , W. DMD-based LED-illumination Super-resolution and optical sectioning microscopy . Scientific Reports 2013 , 3 , Article No. 1116 .
- Fleischer , M. ; Windecker , R. ; Tiziani , H. Fast algorithms for data reduction in modern optical three-dimensional profile measurement systems with MMX technology . Appl. Opt. 2000 , 39 , 1290 – 1297 .
- Biegen , J.F. Calibration requirements for Mirau and Linnik microscope interferometers . Appl. Opt. 1989 , 28 , 1972 – 1974 .
- Creath , K. Calibration of numerical aperture effects in interferometric microscope objectives . Appl. Opt. 1989 , 28 , 3333 – 3338 .
- Sheppard , C.J.R. ; Larkin , K.G. Effect of numerical aperture on interference fringe spacing . Appl. Opt. 1995 , 34 , 4731 – 4734 .
- Homepage of SiMetrics company. www.simetrics.de (accessed March 04, 2014).
- Tavrov , A. ; Schmit , J. ; Kerwien , N. ; Osten , W. ; Tiziani , H. Diffraction-induced coherence levels . Appl. Opt. 2005 , 44 , 2202 – 2212 .
- Ingersoll , L.R. Polarization of radiation by gratings . Astrophysical Journal 1920 , 51 , 129 – 139 .
- Color versions of one or more of the figures in the article can be found online at www.tandfonline.com/uopt.