
ABSTRACT
Photoacoustic spectroscopy has been used to measure optical absorption coefficient and the application of tens of wavelength bands in photoacoustic spectroscopy was reported. Using optical methods, absorption-related information is, generally, derived from reflectance or transmittance values. Hence measurement accuracy is limited for highly absorbing samples where the reflectance or transmittance is too low to give reasonable signal-to-noise ratio. In this context, this paper proposes and illustrates a hyperspectral photoacoustic spectroscopy system to measure the absorption-related properties of highly absorbing samples directly. The normalized optical absorption coefficient spectrum of the highly absorbing iris is acquired using an optical absorption coefficient standard. The proposed concepts and the feasibility of the developed diagnostic medical imaging system are demonstrated using fluorescent microsphere suspensions and porcine eyes as test samples.
Nomenclature
| F | = | local fluence |
| FV | = | area under photodiode signal |
| I0 | = | incident light intensity |
| I | = | light intensity |
| L | = | thickness of OAC standard |
| P0 | = | initial pressure rise |
| PV | = | maximum amplitude of UST signal after Hilbert transformation |
| R | = | reflectance of OAC standard |
| T | = | transmittance of OAC standard |
| Temp | = | temperature |
| Γ | = | Grüneisen parameter |
| λ | = | optical wavelength |
| μ | = | optical absorption coefficient |
| Subscripts | = | |
| N | = | normalized |
| sam | = | sample |
| std | = | OAC standard |
1. Introduction
Biomedical optics has been used for diagnostic and therapeutic applications by imaging and measuring parameters of healthy and diseased sites.[Citation1Citation2Citation3] It plays an important role in diagnostic medical applications as it can highlight functional or structural changes in the body leading to diseases.[Citation4] Uveal melanoma is a type of intraocular cancer which can occur in the iris and if left untreated, can lead to blindness and deaths.[Citation5,Citation6] Characterization of different conditions of the eyes can be used to diagnose the type and condition of diseases. This has been demonstrated in the measurement of oxygen saturation in the radial iris arteries using photoacoustic (PA) method.[Citation7]
When a sample is irradiated by a pulsed optical excitation, some of the optical energy is absorbed and converted into thermal energy.[Citation8] The proportion of the energy absorbed is directly proportional to the sample’s optical absorption coefficient (OAC). This is followed by a transient temperature rise resulting in thermoelastic expansion, producing an initial pressure rise and broadband PA wave.[Citation9,Citation10] The PA wave can be detected using an ultrasound transducer (UST).
Using PA instead of optical methods to measure the OAC of the highly absorbing iris is beneficial. PA measurement is a direct measurement of OAC itself and it gives an enhanced detection limit and dynamic range.[Citation11] PA techniques had been used in imaging[Citation3,Citation12,Citation13] and measurement of OAC,[Citation11,Citation14Citation15Citation16Citation17] thermal diffusivity[Citation15] and Grüneisen parameter.[Citation18,Citation19] In most of these cases, only one or few excitation wavelengths were used in the measurement,[Citation3,Citation11,Citation14Citation15Citation16,Citation19] though some of the reported cases used few tens of wavelength bands.[Citation13,Citation17,Citation18] However, the necessity for higher measurement accuracy and the need for better spectral details have led the researchers to look for new methodologies.
The common method to measure fluence in many PA setups is to use a beam sampler/splitter to direct part of the excitation source to an energy sensor, such as a photodiode. The transmittance and reflectance of the optical components along the light path between the photodiode and the sample is wavelength-dependent. When this is not accounted, the photodiode cannot correctly measure the relative fluence applied to the sample at different wavelengths. It has been used to correct the pulse-to-pulse energy fluctuations but this does not account for the wavelength-dependent transmittance and reflectance of these optical components. For accurate measurement, calibration is required to adjust the energy measurement to give the actual relative fluence applied to the sample. In general, for a simple setup with a short spectral range and few optical components, it is assumed that the optical components between the photodiode and sample have wavelength-independent transmittance and reflectance. However, this does not apply in setups using multiple optical components between the photodiode and sample across a broad wavelength range, covering the visible and near-infrared light.
In this context, this paper presents and demonstrates a novel concept based on hyperspectral photoacoustic spectroscopy (HS-PAS) to acquire the normalized OAC spectrum of the highly absorbing iris. This allows the OAC characterization of healthy iris and uveal melanoma in the iris using PA method, which can be used to detect diseases. Such characterization is important to determine the optimal wavelength for PA excitation so that there is good contrast between healthy iris and uveal melanoma. More wavelength bands for interrogation within a spectral band enable OAC characterization with detailed spectral signatures, higher spectral precision and resolution. Enucleated porcine eyes were used as the test samples. The use of an OAC standard is also proposed to serve as a reference whose PA measurement is compared with that of the sample. This removes the need to perform spectral calibration to account for the wavelength-dependent transmittance and reflectance of the optical components. Optical components can also be added or removed from the setup without performing another spectral calibration.
2. Theory
The initial pressure rise of the PA wave P0 is an indication of its strength, and is governed by Eq. (1) where μ is OAC and F represents the local fluence.[Citation9,Citation20,Citation21] Both μ and F are functions of optical wavelength λ. Γ is the unitless Grüneisen parameter and is a function of temperature Temp.
PV is the maximum amplitude of the UST signal after Hilbert transformation, which is widely used in analytical signal analysis to pick up the envelopes of vibration signals.[Citation22] PV,sam(λ) is compared with PV,std(λ) in Equation (2). FV is the area under the photodiode signal and a measure of the fluence used for excitation. Equation (2) is then rewritten as Equation (3). Two functions (smooth and norm) are applied to Equation (3) to acquire the normalized OAC spectrum of the sample μsam_N(λ) as shown in Equation (4). The function smooth is an 11-point moving average, and norm is a division of the spectrum by its maximum value. The experimental data and the normalized OAC spectrum of the standard are required in Equation (4) to obtain the sample’s normalized OAC spectrum.
It is to be mentioned that Temp is kept constant during the measurements. Therefore Γstd(Temp), Γsam(Temp), and Temp are constants and they do not appear in Equation (4) which involves normalization. Due to fluctuation of the laser energy even under the same laser setting, the ratio of is not always one. This ratio is used to account for such deviation in Equation (4). In short, using the OAC reference standard removes the need to perform spectral calibration to account for the wavelength-dependent transmittance and reflectance of the optical components.
3. Methods
3.1. Experimental setup
For ocular measurement, both the eye and the OAC standard used the configuration shown in . The configuration in was used to validate the proposed concept to measure the normalized OAC spectrum, using fluorescent microsphere suspensions as test sample. Although light passes through different media between objective lens 2 and the sample in the two configurations, it is assumed that the glass slide, water and air have flat transmittance spectra from 410 to 870 nm.
Figure 1. HS-PAS setup for (a) ocular measurement with eye and OAC standard and (b) validation.
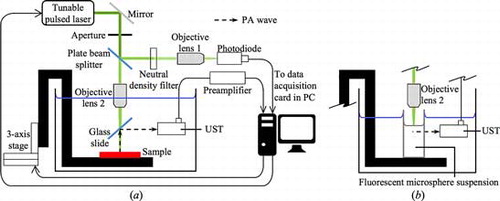
A tunable pulsed laser (5-ns nominal pulse length, Vibrant 355 II, Opotek Inc.) provided optical excitation for PA measurement. The spectral range of interest was 410–870 nm with 1 nm wavelength resolution step. 461 wavelength bands were used for each measurement. The number of wavelength used far exceeded the number of wavelength used in hyperspectral measurement (∼100–200), as defined by Fresse et al.[Citation23] The laser had an optical parametric oscillator producing collinear Signal (410–710 nm) and Idler (710–2400 nm) beams. Under the same laser settings (energy and transmission), the pulse energy generally decreases with wavelength. A Glan-laser polarizer separated the Signal and Idler beams. The polarizer was initially positioned for the emission of Signal beam from 410 to 710 nm. To use the 711–810 nm bands, the polarizer had to be manually repositioned for the emission of Idler beam.
The laser fired 40 pulses at 10 Hz for each wavelength. When the pulse reached the plate beam splitter (BSW10, Thorlabs), the reflected light was directed toward the neutral density filter (ND30A, Thorlabs) and focused by objective lens 1 (UPlan FLN 10×, Olympus) onto the photodiode (SM05PD2B, Thorlabs). The pulse detected by the photodiode triggered the digitizer (200 MS/s, Razor CompuScope 1622, GaGe). The transmitted light through the plate beam splitter travelled toward objective lens 2 (MPlan N 5×, Olympus), which was partially submerged in water as shown in the configuration in . Light passed through a glass slide before reaching the sample held in place by a three-axis stage (T-LS28M, Zaber Technologies). Upon sample excitation, the PA wave produced was directed by the glass slide toward the UST (V110-RM, Olympus Panametrics-NDT) for detection. A pre-amplifier (5662, Olympus Panametrics-NDT) with a 54 dB gain amplified the detected signal before reaching the digitizer. When the digitizer was triggered, the signals from both the photodiode and UST were acquired. The signals were averaged over 40 pulses for each wavelength, so as to improve the signal-to-noise ratio. Custom-developed LabView® software was used to control the laser, three-axis stage and digitizer, and to save the averaged signals.
3.2. Preparation of porcine eye sample
Randomly selected enucleated eye samples from porcine (Sus scrofa domestica) were acquired from local abattoir. Extraocular tissues were removed from the ex vivo eye samples before being placed and transported on ice. This helps to keep the eye samples fresh until the experiments began. Visual inspections were conducted on the eye samples. Only the eye samples found to be free of signs of deterioration were used for testing. The study was conducted within 6 h after sample acquisition and followed NTU’s biosafety regulations and regulations of Agri-Food & Veterinary Authority of Singapore.
3.3. Data processing
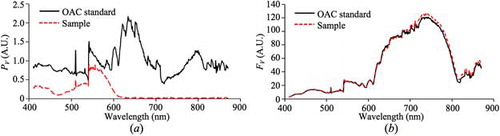
The data acquired from the sample and OAC standard were processed by custom-written script in MATLAB®. Hilbert transformation was applied to the UST signal and the peak amplitude of the transformed signal PV was acquired. The area under the photodiode signal was calculated, giving FV. UST and photodiode signals acquired from the OAC standard using excitation of 500 nm are shown in . By repeating for all the wavelengths, PV(λ) and FV(λ) spectra are acquired. The PV(λ) and FV(λ) spectra of the OAC standard and a sample (Red fluorescent microsphere) are shown in .
Figure 2. (a) UST and (b) photodiode signals of OAC standard under 500 nm excitation.
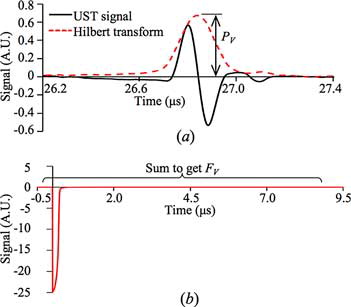
Figure 3. (a) PV(λ) and (b) FV(λ) of the OAC standard and sample.
4. Experimental results
4.1. Normalized OAC spectrum of OAC standard
A grey tape was used as the OAC standard. Optical method was used to acquire the normalized OAC spectrum since its reflectance and transmittance were sufficiently high within 410–870 nm to give reasonable signal-to-noise ratio. The attenuation of light through the OAC standard was assumed to comply with Beer–Lambert law, as stated in Equation (5).[Citation15] T, R, and L are the transmittance, reflectance, and thickness of the OAC standard respectively. The assumed behavior of light through the OAC standard is shown in , where I0 is the incident intensity and I is the intensity as it travelled from the front to the back surface in x-direction. Equation (6), derived from Equation (5),[Citation15] calculates the normalized OAC spectrum of the standard. L is a constant and does not appear in Equation (6) which involves normalization.
A broadband source (MI-150, Edmund Optics) and two lenses (LB1761-A and LB1471-A, Thorlabs) were used to produce the collimated white light. The setup in measured T(λ), where the OAC standard was placed before the integrating sphere (4P-GPS-060-SF, Labsphere). Part of the transmitted light travels through the optical fiber (QP400-1-VIS-NIR, Ocean Optics) and was detected by the spectrometer (USB4000, Ocean Optics). The SpectraSuite® software (Ocean Optics) calculated T(λ) after taking into account the dark current of the spectrometer and 100% transmittance reference (blank sample). The setup in measured R(λ), where the reference was a 99% reflectance standard (SRS-99-010, Labsphere). After measuring T(λ) and R(λ), they were applied in Equation (6) to calculate μstd_N(λ). μstd_N(λ) is relatively flat ranging from 0.94 to 1, as shown in . μstd_N(λ) and the earlier acquired PV,std(λ), PV,sam(λ), FV,std(λ), and FV,sam(λ) from Section 3.3 were applied in Equation (4) to get μsam_N(λ).
Figure 4. (a) Assumed behavior of light in OAC standard. Experimental setup to measure (b) transmittance, and (c) reflectance of OAC standard.
Figure 5. Normalized OAC spectrum of standard μstd_N(λ).
4.2. Validation using fluorescent microsphere suspensions
The configuration in was used to validate the proposed method to measure the normalized OAC spectrum, using Red, Crimson, and Nile Red fluorescent microsphere suspensions (F8858, F8816, and F8825, respectively, from Life Technologies) as test samples. Each suspension appeared to be opaque and was placed in a cuvette. The data acquired [μstd_N(λ), PV,std(λ), PV,sam(λ), FV,std(λ), and FV,sam(λ)] were incorporated in Equation (4) to find the normalized OAC spectrum of the sample ().
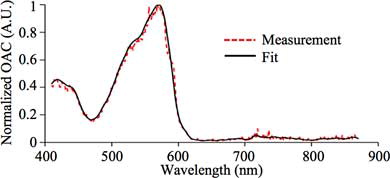
Figure 6. μsam_N(λ) of Red fluorescent microsphere suspension.
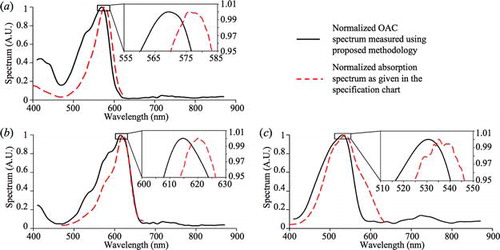
Four measurements were taken for each fluorescent microsphere suspension and each set of results were averaged and normalized. compares the acquired normalized OAC spectra of the three suspensions with their respective normalized absorption spectra (provided online by Life Technologies). There is dependence between the OAC and absorption spectra which are evident from which indicates that a rise in OAC will lead to a rise in absorption, and vice versa. This trend is clearly evident in all three suspensions, and it verifies that the proposed concept is capable of giving the characteristics of the OAC spectrum of highly absorbing samples with 1 nm resolution. The peak wavelengths of the acquired normalized OAC spectrum and the given absorption spectrum (as per the specifications) differ from each other by 4–7 nm. These differences may be a result of the different setups used to acquire the OAC and absorption spectra. Using HS-PAS, the normalized OAC spectra from 410 to 870 nm of highly absorbing samples were acquired with 1 nm resolution. Such a detailed OAC spectrum allows the precise selection of suitable wavelengths for spectroscopic or multispectral imaging purposes. Also, using the proposed OAC standard removes the need to perform spectral calibrations to account for the wavelength-dependent transmittance and reflectance of the optical components between the photodiode and sample.
Figure 7. Validation results using (a) Red, (b) Crimson and (c) Nile Red fluorescent microsphere suspensions.
4.3. Experiments on enucleated porcine eye samples
4.3.1. HS-PAS of the iris of enucleated porcine eye sample
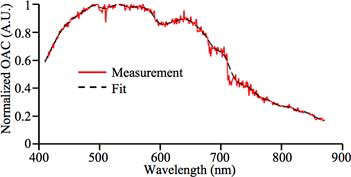
The configuration in was used to acquire the normalized OAC spectrum of the iris of an enucleated porcine eye sample. The result in shows the normalized OAC spectrum of the top surface of the iris.
Figure 8. Measured normalized OAC spectrum of iris in porcine eye sample.
4.3.2. Multispectral PA imaging of enucleated porcine eye sample
In this study, three wavelengths of different normalized OAC of the iris were selected based on the results in the above section. The selected wavelengths, 465, 750, and 870 nm, had an OAC ratio of 1:0.421:0.183 for the iris. The laser settings of these wavelengths were adjusted to have the same fluence. When a sample is excited by different wavelengths of the same fluence, the strength of the UST signal (PV) is directly proportional to the OAC only. Therefore, the ratio of the UST signal strength using the selected wavelengths having the same fluence should be close to that of the measured normalized OAC of 1:0.421:0.183.
The laser transmissions of the selected wavelengths were adjusted to have the same fluence using the OAC standard as the sample. The OAC standard had a relatively flat normalized OAC spectrum (). When the PV of the three wavelengths are close to each other when the OAC standard is used, it implies that the fluence of these wavelengths is about the same. The laser transmissions for 465, 750, and 870 nm were found to be 1, 7, and 21% respectively.
Each B-scan image was acquired using the earlier mentioned LabView® software, which included the synchronization of the three-axis stage to move 199 steps, each covering 80 µm. 20 pulses of the same wavelength were fired at each position. Each B-scan measurement took ∼10 min to complete. The data were processed similarly as described in Section 3.3.
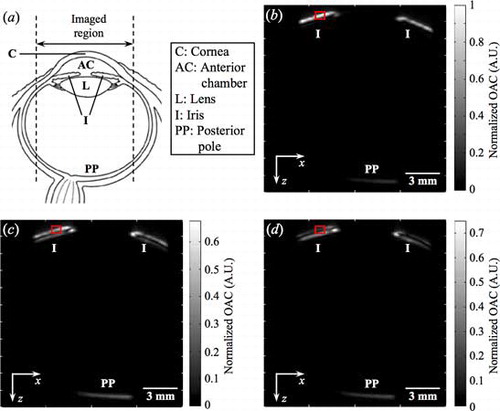
shows the schematic of the eye and show the B-scan images at 465, 750, and 870 nm, respectively. Each B-scan image is made up of 2200 × 200 pixels2 (z-depth × x-position). When compared with , the B-scan images in show features which are identified as the iris and posterior pole. The pigmented iris contains melanin and the posterior pole contains blood vessels, both melanin and blood are highly absorbing. Thus strong PA signals were acquired from these regions,[Citation24,Citation25] but not from other parts like the optically clear cornea. The strength of the UST signals from the top of the iris at different wavelengths of the same fluence was calculated by averaging the maximum amplitudes of 10 A-scans (PV) within the red box in each B-scan image. The PV ratio in the B-scan images of 465, 750, and 870 nm was calculated to be 1:0.457:0.184. This ratio is very close to the ratio of 1:0.421:0.183 in the measured normalized OAC spectrum of the iris using HS-PAS. The similarity between these two ratios shows that the proposed concept and methodology are able to acquire finer spectral details (1 nm resolution) of the normalized OAC spectrum of the iris accurately.
Figure 9. (a) Schematic of the eye. B-scan images across the center of the eye using (b) 465 (c) 750, and (d) 870 nm.
A major limitation using conventional optical methods to measure the OAC of highly absorbing iris is that the transmittance and reflectance signals may be too low to give accurate data for analysis (low signal-to-noise ratio). Although optical methods are nondestructive, fast, and inexpensive,[Citation26] they do not enable direct measurement of absorption properties itself. Optical methods need to measure transmittance and reflectance values before absorption-based information is acquired. For this, common methods such as those based on Beer–Lambert law[Citation15] and the theory of oblique-incidence reflectometry are used.[Citation26Citation27Citation28] Also, optical methods measuring transmittance need access to both the front and back of the iris, thus the eye cannot be left intact. When the sample is highly absorbing, using PA instead of conventional optical method for the OAC characterization of the iris is more suitable. PA method is directly proportional to OAC and the PA signals increase with OAC, providing an enhanced detection limit and improved dynamic range.[Citation11]
4.3.3. Adherence to guideline on exposure limit to laser radiation
For the potential diagnostic clinical applications to characterize healthy and diseased sites in the iris for the detection of uveal melanoma, the system is subjected to guidelines defined by International Commission on NonIonizing Radiation Protection on the exposure limit for the skin.[Citation29] For this purpose, where the illumination is targeted at the iris and not the cornea and retina, the exposure limit for the skin is used as the guideline to protect the anterior parts of the eye.[Citation29]
Eight wavelengths within the spectral range of 410–870 nm were selected to represent all the wavelengths in the spectral range. The selected wavelengths, respective laser transmission settings and the measured pulse energy (Nova Display and 12AV1, Ophir) are in . The detailed calculations and analysis on the adherence to guideline on exposure limit to laser radiation for different wavelengths are given in the Supplementary information. The results show that the ratios of the measured pulse energy to the energy limit under different situations are very small and well below the exposure limit. The highest of them all is 2.17% which occurs at 541 nm under single pulse exposure (Rule 1). Therefore, the system can potentially be used on the iris for the intended applications.
Table 1. Selected wavelengths and measured pulse energy.
5. Conclusion
A HS-PAS system to acquire the normalized OAC spectrum of the highly absorbing samples is proposed in this paper. This allows the characterization of healthy iris and uveal melanoma in the iris using PA method, which can be used to detect diseases. Such characterization is important to determine the optimal wavelength for PA excitation so that there is good contrast between healthy iris and uveal melanoma. The use of an OAC standard removes the need to perform spectral calibrations for the optical components between the photodiode and the sample, which can have wavelength-dependent transmittance and reflectance. Optical components can be removed or added to the PA setup without the need to perform yet another spectral calibration. Normalized OAC spectra made up of 461 spectral bands were acquired from 410 to 870 nm with a spectral interval of 1 nm. The proposed methodology enables precise wavelength selection of 1-nm resolution, which can be used for spectroscopic or multispectral imaging applications. It is also illustrated that this proposed HS-PAS system and methodology can be used to determine the normalized OAC spectrum of highly absorbing targets using fluorescent microsphere suspensions and iris region of the eye as test samples. The acquired spectra from a healthy iris can be used as reference spectra for ocular disease diagnosis. It is expected that this proposed approach can also be adopted for the measurement of other highly absorbing materials for a variety of applications.
Declaration
The authors declare that the manuscript has not been published elsewhere and that it has not been submitted simultaneously for publication elsewhere.
uopt_a_1392661_sm6697.docx
Download MS Word (47.8 KB)Additional information
Funding
References
- Kujawińska, M.; Krauze, W.; Kus, A.; Kostencka, J.; Kozacki, T.; Kemper, B.; Dudek, M. Problems and Solutions in 3-D Analysis of Phase Biological Objects by Optical Diffraction Tomography. Int. J. Optomechatronics 2014, 8, 357–372.
- Murukeshan, V. M.; Sujatha, N. U. Integrated Simultaneous Dual-Modality Imaging Endospeckle Fluoroscope System for Early Colon Cancer Diagnosis. Opt. Eng. 2005, 44, 110501.
- Lim, H.-T.; Matham, M. V. Hybrid-Modality Ocular Imaging Using a Clinical Ultrasound System and Nanosecond Pulsed Laser. J. Med. Imaging 2015, 2, 036003.
- Ren, Z.; Liu, G.; Huang, Z.; Zhao, D.; Xiong, Z. Exploration and Practice in Photoacoustic Measurement for Glucose Concentration Based on Tunable Pulsed Laser Induced Ultrasound. Int. J. Optomechatronics 2015, 9, 221–237.
- Quigley, H. A.; Broman, A. T. The Number of People with Glaucoma Worldwide in 2010 and 2020. Brit. J. Ophthalmol. 2006, 90, 262–267.
- Damato, B. Developments in the Management of Uveal Melanoma. Clin. Exp. Ophthalmol. 2004, 32, 639–647.
- Hu, S.; Rao, B.; Maslov, K.; Wang, L. V. Label-Free Photoacoustic Ophthalmic Angiography. Opt. Lett. 2010, 35, 1–3.
- Zhang, L.; Sun, L.; Ma, X. Characteristics of the Photoacoustic Signal Excited by an Intensity-Modulated Continuous-Wave Laser. Laser Phys. Lett. 2013, 10, 055601.
- Niederhauser, J. J.; Jaeger, M.; Lemor, R.; Weber, P.; Frenz, M. Combined Ultrasound and Optoacoustic System for Real-Time High-Contrast Vascular Imaging in Vivo. IEEE T. Med. Imaging. 2005, 24, 436–440.
- Chatni, M. R.; Xia, J.; Sohn, R.; Maslov, K.; Guo, Z.; Zhang, Y.; Wang, K.; Xia, Y.; Anastasio, M.; Arbeit, J.; Wang, L. V. Tumor Glucose Metabolism Imaged in Vivo in Small Animals with Whole-Body Photoacoustic Computed Tomography. J. Biomed. Opt. 2012, 17, 076012.
- Schmid, T.; Panne, U.; Niessner, R.; Haisch, C. Optical Absorbance Measurements of Opaque Liquids by Pulsed Laser Photoacoustic Spectroscopy. Anal. Chem. 2009, 81, 2403–2409.
- Estrada, H.; Sobol, E.; Baum, O.; Razansky, D. Hybrid Optoacoustic and Ultrasound Biomicroscopy Monitors’ Laser-Induced Tissue Modifications and Magnetite Nanoparticle Impregnation. Laser Phys. Lett. 2014, 11, 125601.
- Wang, P.; Wang, P.; Wang, H. W.; Cheng, J. X. Hyperspectral Vibrational Photoacoustic Imaging of Lipids and Collagen. Proc. SPIE. 2012, 8223, 82231I.
- Shen, Y.; Lu, Z.; Spiers, S.; MacKenzie, H. A.; Ashton, H. S.; Hannigan, J.; Freeborn, S. S.; Lindberg, J. Measurement of the Optical Absorption Coefficient of a Liquid by Use of a Time-Resolved Photoacoustic Technique. Appl. Opt. 2000, 39, 4007–4012.
- Fuente, R.; Apiñaniz, E.; Mendioroz, A.; Salazar, A. Simultaneous Measurement of Thermal Diffusivity and Optical Absorption Coefficient Using Photothermal Radiometry. I. Homogeneous Solids. J. Appl. Phys. 2011, 110, 033515.
- Patrick Arnott, W.; Moosmüller, H.; Fred Rogers, C.; Jin, T.; Bruch, R. Photoacoustic Spectrometer for Measuring Light Absorption by Aerosol: Instrument Description. Atmos. Environ. 1999, 33, 2845–2852.
- Laufer, J.; Jathoul, A.; Pule, M.; Beard, P. In Vitro Characterization of Genetically Expressed Absorbing Proteins Using Photoacoustic Spectroscopy. Biomed. Opt. Expr. 2013, 4, 2477–2490.
- Yao, D.-K.; Zhang, C.; Maslov, K.; Wang, L. V. Photoacoustic Measurement of the Grüneisen Parameter of Tissue. J. Biomed. Opt. 2014, 19, 017007.
- Villanueva, Y.; Hondebrink, E.; Petersen, W.; Steenbergen, W. Photoacoustic Measurement of the Grüneisen Parameter Using an Integrating Sphere. Rev. Sci. Instrum. 2014, 85, 074904.
- Wang, L. V.; Wu, H. Biomedical Optics: Principles and Imaging; John Wiley & Sons: Hoboken, NJ, 2007.
- Luke, G. P.; Nam, S. Y.; Emelianov, S. Y. Optical Wavelength Selection for Improved Spectroscopic Photoacoustic Imaging. Photoacoustics 2013, 1, 36–42.
- Yu, L.; Giurgiutiu, V. Advanced Signal Processing for Enhanced Damage Detection with Piezoelectric Wafer Active Sensors. Smart Struct. Syst. 2005, 1, 185–215.
- Fresse, V.; Houzet, D.; Gravier, C. GPU Architecture Evaluation for Multispectral and Hyperspectral Image Analysis. In Conference on Design and Architectures for Signal and Image Processing (DASIP), IEEE: Edinburgh, UK, 2010, 121–127.
- de la Zerda, A.; Paulus, Y. M.; Teed, R.; Bodapati, S.; Dollberg, Y.; Khuri-Yakub, B. T.; Blumenkranz, M. S.; Moshfeghi, D. M.; Gambhir, S. S. Photoacoustic Ocular Imaging. Opt. Lett. 2010, 35, 270–272.
- Silverman, R. H.; Kong, F.; Chen, Y. C.; Lloyd, H. O.; Kim, H. H.; Cannata, J. M.; Shung, K. K.; Coleman, D. J. High-Resolution Photoacoustic Imaging of Ocular Tissues. Ultrasound Med. Biol. 2010, 36, 733–742.
- Xia, J. J.; Berg, E. P.; Lee, J. W.; Yao, G. Characterizing Beef Muscles with Optical Scattering and Absorption Coefficients in VIS-NIR Region. Meat Sci. 2007, 75, 78–83.
- Marquez, G.; Wang, L. V.; Lin, S. P.; Schwartz, J. A.; Thomsen, S. L. Anisotropy in the Absorption and Scattering Spectra of Chicken Breast Tissue. Appl. Opt. 1998, 37, 798–804.
- Wang, L.; Jacques, S. L. Use of a Laser Beam with an Oblique Angle of Incidence to Measure the Reduced Scattering Coefficient of a Turbid Medium. Appl. Opt. 1995, 34, 2362–2366.
- International Commission on Non-Ionizing Radiation Protection. ICNIRP Guidelines on Limits of Exposure to Laser Radiation of Wavelengths Between 180 nm and 1,000 µm. Health Phys. 2013, 105, 271–295.