
Abstract
Objectives
Rett syndrome (RTT) is a rare disorder causing severe intellectual and physical disability. The cause is a mutation in the gene coding for the methyl-CpG binding protein 2 (MECP2), a multifunctional regulator protein. Purpose of the study was integration and investigation of multiple gene expression profiles in human cells with impaired MECP2 gene to obtain a robust, data-driven insight in molecular disease mechanisms.
Methods
Information about changed gene expression was extracted from five previously published studies, integrated and the resulting differentially expressed genes were analysed using overrepresentation analysis of biological pathways and gene ontology, and network analysis.
Results
We identified a set of genes, which are significantly changed not in all but several transcriptomics datasets and were not mentioned in the context of RTT before. We found that these genes are involved in several processes and molecular pathways known to be affected in RTT. Integrating transcription factors we identified a possible link how MECP2 regulates cytoskeleton organisation via MEF2C and CAPG.
Conclusions
Integrative analysis of omics data and prior knowledge databases is a powerful approach to identify links between mutation and phenotype especially in rare disease research where little data is available.
Introduction
Rett syndrome (RTT, MIM no. 312750) is a neurological disorder that was first described in 1966 by A. Rett (Rett Citation1966), an Austrian paediatrician who observed the same stereotypic hand movements in some of his patients. It is a rare disease which affects between 1:10,000 and 1:20,000 live born children and is predominantly seen in females (Laurvick et al. Citation2006). The symptoms are stagnation, followed by regression and loss of motor and communication skills between the age of 6 and 18 months after almost normal pre- and postnatal development (Liyanage and Rastegar Citation2014). Neuronal function and development are strongly impaired.
RTT is linked to a mutation in the gene encoding methyl-CpG-binding protein 2 (MECP2), which is located on the X-chromosome (Amir et al. Citation1999). MECP2 is an important regulator of neuronal function and development. It influences neuronal differentiation, maturation, morphology and synaptic plasticity, and it is present in almost all tissues (Uhlen et al. Citation2015). MECP2 expression is low in foetal development but increases during postnatal development, which may explain the late and gradual onset of the syndrome. Switching off MECP2 in juvenile or adult stage in mice induced the RTT-like phenotype, indicating that MECP2 is not only essential during neuronal development but also required for neurological function and maintenance (Nguyen et al. Citation2012). On the molecular level, MECP2 acts as regulator of gene expression and, depending on the cofactor, functions as activator or inhibitor. It influences alternative splicing, and microRNA expression (Jordan et al. Citation2007; Chahrour et al. Citation2008; Gonzales et al. Citation2012; Liyanage and Rastegar Citation2014; Ehrhart et al. Citation2016). Previously, we created a comprehensive visualisation of known MECP2 actions available in WikiPathways (http://www.wikipathways.org/instance/WP3584) (Ehrhart et al. Citation2016). MECP2 being such a wide range influencer of gene expression, epigenetic imprinting and neurotransmitter action, makes it challenging to gather information about the downstream effects. Discovering which gene expression patterns are directly affected by an impaired MECP2 and reconstructing the downstream pathways which finally lead to the phenotype is a still in its infancy.
Nowadays, cell biology uses high-throughput methods to investigate the disease causes and consequences based on whole metabolomes, transcriptomes and genomes, separately and integrative. The induced changes on the cellular level represent intricate biological networks including molecular interactions, which finally lead to a specific disorder phenotype. Analysing the transcriptome is a standard method to investigate the current status of gene expression. By comparing wild-type (WT) with diseased cell expression the different gene signalling pathways can be investigated. This method is nevertheless often misleading as the transcriptome shows a snapshot of the cells (or tissue) current status, including influences like individual genetic background, nutrition, stress, cell cycle or circadian rhythms (Zhang et al. Citation2014), which may be larger than the change induced by a disorder. By performing meta- or integrational analysis of multiple transcriptomics datasets, various studies of neurological disorders like autism-spectrum disorder (Li et al. Citation2014; Ch'ng et al. Citation2015), schizophrenia (Mistry et al. Citation2013), multiple sclerosis (Raddatz et al. Citation2014), intracranial aneurysms (Roder et al. Citation2012), epilepsy (Rogic and Pavlidis Citation2009), and aging and age-associated spatial learning impairment (Uddin and Singh Citation2013) have obtained new insights. However, this approach has not been applied in RTT. RTT is a rare disorder and the number of available datasets is limited. To gain most reliable information from the available data, an overrepresentation analysis approach for molecular pathways and biological functions (gene ontology (GO)) was used. These analyses are more robust than comparing single gene data independently of the changed expression of genes as they are often still the same affected pathways.
The aim of the present study is to investigate differential gene expression in a collection of previously published transcriptomics studies obtained from human cells with impaired MECP2 function. The raw data were derived and integrated from five independent studies published online in open access databases. From these raw datasets the differentially expressed gene lists were extracted. These were then used for secondary, robust analysis, namely, pathway and GO analysis.
Materials and methods
We integrated raw human transcriptomics data from five independent previously published studies to extract and analyse differential gene expression in RTT.
Selection and analysis of transcriptomics datasets
All publically available MECP2-related transcriptomics datasets were chosen from open access databases, namely GEO (Edgar et al. Citation2002) and ArrayExpress (Rustici et al. Citation2013), and used in the present study: E-GEOD-21037 (Muotri et al. Citation2010), E-MEXP-1956 (Nectoux et al. Citation2010), E-GEOD-6955 (Deng et al. Citation2007), E-GEOD-4600 (Peddada et al. Citation2006), and E-GEOD-50584 (Li et al. Citation2013). The study selection protocol (including PRISMA flow diagram (Moher et al. Citation2009)) and details about the datasets can be found in supplementary data (Supplementary Table 1 Dataset description, selection criteria and Supplementary Figure 1 PRISMA flow diagram). The study details and publications are listed in . In total, five studies were selected, from which 48 samples were included in the present study. In total, in the five studies, 24 microarrays with an impaired MECP2 gene and 24 matching controls were found.
Table 1. Selected transcriptomics datasets.
Analysis workflow
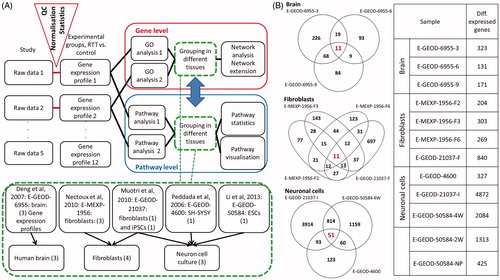
An analysis workflow was designed to compare and integrate the experimental groups on the level of genes and pathways (). First, the changed gene expression profiles or pathway profiles were extracted. Second, these profiles were grouped and analysed according to tissue or sample similarity into three main groups: human brain tissue, fibroblasts and neuronal cells.
Figure 1. (A) Workflow to integrate and analyse the MECP2-related transcriptomics datasets. Analysis of raw data results in a list of significantly (above the threshold) changed genes. Datasets were grouped according to their tissue origin into human brain, fibroblasts, and neuron cell culture. Changed gene lists are the basis for a gene-wise comparison or search for commonly DEGs compared directly (using GO analysis) or a pathway approach where gene lists are first used to identify affected molecular pathways and then the commonly differentially affected pathways are identified. (B) The overlapping DEGs in the three different tissue groups (red numbers) and the DEGs for each experimental tissue group (right). Log2FC threshold = ±1.
Quality control and data normalisation
Raw transcriptomics datasets (.CEL files) were downloaded from GEO or ArrayExpress, respectively. RNA quality was assessed in the original studies and found to be good (Peddada et al. Citation2006; Deng et al. Citation2007; Muotri et al. Citation2010; Nectoux et al. Citation2010; Li et al. Citation2013). Quality control and GC-RMA normalisation of the datasets were performed using the ArrayAnalysis.org web tool (Eijssen et al. Citation2013). All datasets selected passed the quality control given in ArrayAnalysis.org. This tool implements methods from Bioconductor packages to check whether array signals are of high quality (e.g., RNA degradation plot), whether generally the signals are comparable between arrays (boxplot, density plot) and whether the samples behave or group as expected in clustering assays (e.g., PCA). The detailed QC reports for the datasets can be found in supplementary data. For annotation of data, Ensembl gene identifiers were used.
Statistics
The ArrayAnalysis.org statistics module was used to perform statistical calculations (an adjusted t-test using the limma package of Bioconductor/R) on the normalised data of those datasets where more than one biological replica was available (namely E-GEOD-21307-I, E-GEOD-4600 and E-GEOD-50584 all groups, see also details below). Fold change (FC), log2FC, average expression and P values were calculated comparing RTT/MECP2-deficient sample versus control. For those samples with only one (biological) replica, we calculated log2FC and average expression (Rett/MECP2 deficient – WT/control): E-GEOD-21307 fibroblasts, E-MEXP-1956 fibroblasts, and E-GEOD-6955 human brain. Genes were considered as differentially expressed if the average expression is higher than 5 (which is recommended for the Affymetrix microarray platforms used), and if the P value is smaller than 0.05. If the P value was not available (for the human brain and fibroblast samples) log2FC > |1| or log2FC > |0.58| was taken as criterion.
To compare the various lists of differentially expressed genes (DEGs) the online tool Venny (version 2.1) was used. We defined four tissue groups (see ): (1) human brain (E-GEOD-6955, three different age groups of 3, 6 and 9 years; (2) fibroblasts (E-GEOD-21307-F, E-MEXP-1956-F2, F3 and F6; (3) neuronal cell culture (stem cells differentiated towards neurons) (E-GEOD-4600, E-GEOD-21307-I and E-GEOD-50584-4W); (4) the overlapping DEGs were extracted from each tissue group.
GO analysis
GO analysis (overrepresentation analysis, ORA) was performed using GO-Elite (version 1.2 Beta) (Zambon et al. Citation2012). Biological process was the GO category used in this analysis. The number of permutations for ORA was set to 2000. A z score ≥1.96, permuted P ≤ 0.05 and minimum number of changed genes of 3 were set as cut-off and the results were pruned. For analysis, the list of DEGs per sample dataset was used (for criteria see above). As background, the lists of all genes measured were merged.
Pathway analysis
PathVisio (version 3.2.0) (Kutmon et al. Citation2015) was used to visualise log2FC and P values and to perform an ORA with the pathway statistics module using the lists of DEGs. For identifier mapping BridgeDb (version 82) (van Iersel et al. Citation2010) was used, and as pathway database WikiPathways was used, namely the curated human pathway collection, downloaded 17.08.2016. The list of DEGs per sample dataset was used as input (criteria see above). A pathway was identified as changed if z ≥ 1.96, permuted P ≤ 0.05 and the number of genes in the pathway which met the criteria ≥3.
Network visualisation and extension
Based on the obtained GO terms and gene lists, networks were generated using the network analysis tool Cytoscape (version 3.4.0) (Shannon et al. Citation2003; Smoot et al. Citation2011). The Cytoscape app, CyTargetLinker (Version 3.0.1) (Kutmon et al. Citation2013; Kutmon et al. Citation2018) (including LinkSets for Homo sapiens) was used to extend the previously described network and add database information. The LinkSets used are derived from ENCODE (transcription factors, proximal and distal) and DrugBank (drug targets).
Results
Comparison of gene expression in the different samples
The differentially expressed gene lists, obtained from raw data of five previously published studies, were extracted and, according to their tissue origin, sorted into three tissue groups including human brain tissue, fibroblasts and neuronal cells. The numbers of DEGs per experimental group and the overlap within each of the tissue groups is shown for log2FC threshold ± 1 in (for thresholds of log2FC 0.58 see Supplementary Table 2: Differentially expressed gene lists, and Supplementary Table 3: Summary of overlapping genes, pathways and GO). The human brain group had only 11 commonly changed genes, as well as 11 fibroblasts, and the neuronal cell culture group had 51 common DEGs. Also notable is the fact that the number of DEGs within the embryonic stem cell group increases from neuronal precursor (E-GEOD-50584-NP = 425) towards neuronal cells (after 2 weeks 2 W = 1313, and after 4 weeks 4 W = 2084). Fibroblast samples, in which the impaired MECP2 and the controls are collected from the same person (the E-MEXP-1952 samples), are different in 204, 269 or 303 genes (), while the fibroblast samples, in which the impaired MECP2 and the control are derived from different persons differ in 840 genes. Overlapping DEGs and their expression change (log2FC) are shown in Supplementary Table 1. Over all tissues, the genes that show differential expression in one tissue group plus in at least one more sample from another group (i.e., differential expression in five to six experimental samples) are shown in . There were no genes that were found to be differentially expressed in more than six group comparisons for log2FC threshold 1, or more than eight group comparisons for 0.58.
Table 2. Genes that are differentially expressed in five or six different experimental group comparisons (log2FC threshold for brain and fibroblast samples = ±1).
GO analysis
The differentially expressed gene lists from each dataset were subjected to GO analysis to identify enriched biological processes. These changed GO processes were scanned for overlapping processes within the tissue groups (Supplementary Table 3). The results were pruned with the GO-Elites algorithm to make sure subclasses with significant numbers of changed genes do not automatically lead to higher classes being found to be significantly changed, too.
Human brain
The major alterations in the brain affect several neurological processes, such as regulation of synaptic transmission. Inflammatory and stress-related processes are seen, too, e.g., the hydrogen peroxide catabolic process. Other processes are possibly due to the inclusion of blood and blood vessels like oxygen transport, blood vessel endothelial cell migration. DNA binding and mRNA stability are also affected processes.
Fibroblasts
The fibroblasts of RTT patients show affected extracellular matrix organisation and regulation of vascular endothelial growth factor production in all samples investigated. Other observed processes include response to stimuli (drug, dexamethasone, purine containing compound, organophosphorus or mechanical stimulus) and cell division.
Neuronal cells
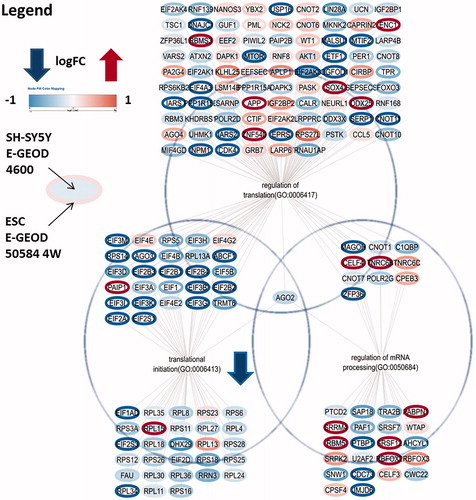
The neuronal cells derived from RTT patients, and the SH-SY5Y cell line, indicate significant affected processes within neuronal function (synapsis organisation, spinal cord development, and cerebral cortex development) but also in stress (response to UV), cell adhesion/cytoskeleton and blood vessel development. In the E-GEOD-4600 and E-GEOD-50584 4 W samples, the translation process was strongly affected and translation initiation factors are especially dominantly downregulated, but this was not significant in E-GEOD-20137 ().
Figure 2. Significantly changed gene expression from E-GEOD 50584 4W (ESCs) and E-GEOD-4600 (SH-SY5Y) of the neuronal cell group, which are related to mRNA processing and translation initiation factors. Note that, although the different expression level is lower in SH-SY5Y cells, in both datasets transcriptional initiation related genes are dominantly downregulated in RTT samples.
Pathway analysis
Pathway analysis was performed for each list of DEGs to identify whether they affect certain biological pathways with known direct molecular interactions. Significantly changed pathways were collected and analysed (for the overlapping pathways see Supplementary Table 3).
All samples showed energy and biosynthesis metabolism dysregulation in the RTT when compared to control samples. Most samples show changes in at least one micronutrient-involved pathways. The most abundantly changed pathways (no pathway was found more often than in 5 of twelve comparison samples) were: gastric cancer network 2, nucleotide metabolism, proteasome degradation, selenium micronutrient network, trans-sulfuration and carbon-1 metabolism.
Using the threshold of 0.58 for log2FC revealed more affected pathways (as there were also more by definition DEGs), nevertheless the tendency was unaffected. The pathways for each single dataset were then investigated for overlapping pathways between the datasets of one tissue group (Supplementary Table 3).
To visualise the direct molecular environment of MECP2 the pathway “MECP2 and associated RTT” was used as described previously (Ehrhart et al. Citation2016) (). BDNF, FKBP5 and DLX6 were found to be downregulated in several but not in all samples, while GRID1 was upregulated but found in only in one sample (E-GEOD-50584 4W). For DLX5, SGK1 and UBE3A there was no significantly changed gene expression found in any of the samples. GAMT, IGF2, MPP1 and FXYD1 were upregulated, although they had been expected to be downregulated (Ehrhart et al. Citation2016). GAMT was found to be upregulated with log2FC of about 0.3 only in the ESC samples. IGF2 was downregulated in human fibroblasts (E-MEXP-1956-F6) and SH-SY5S cells (E-GEOD-4600), while being strongly (log2FC = 6) upregulated in another sample of human fibroblasts (E-GEOD-21307-F). MPP1 was upregulated in two of three human fibroblast samples (both log2FC > 1) but slightly downregulated in iPSCs (E-GEOD-21307-I) (log2FC = –0.57). FXYD1 was found only in human brain samples and upregulated with log2FC 1.20–1.52, but as the average expression was below the threshold of 5 these were not counted as relevant.
Figure 3. MECP2 pathway including data from the different tissue groups. (A) Neuronal cells: each gene box indicates log2FC (blue–red) and significance (if P < 0.05). (B) Brain: each box contains log2FC (from –1 (blue) to 1 (red)) for the three different age groups and average expression level (yellow if > 5). Horizontal separation in a box indicates multiple Affymetrix identifiers (probes) that are linked to the same gene. (C) Fibroblast: each box contains log2FC (from –1 (blue) to 1 (red)) for the four different fibroblast samples and their average expression level (yellow if > 5). High-resolution images of the single pathways are in the supplementary data (Supplementary Figures 2-4 HR) and interactive pathway figures including gene expression data are available on this website https://www.bigcat.unimaas.nl/data/pathways/MECP2/.
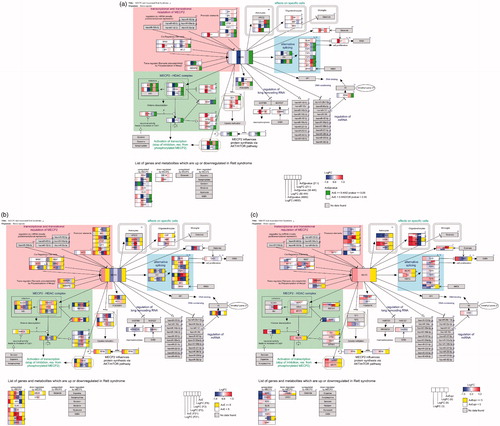
The MECP2 transcript itself is significantly less expressed in all RTT neuronal cell culture samples (including the precursor samples E-GEOD-50584 NP and 2W) and three of four fibroblast samples (all MEXP-1956 samples) with a log2FC between –0.1 (E-GEOD-4600) and –1.5 (E-GEOD-50584 2W). In human brain samples the MECP2 transcript levels are slightly increased (log2FC 0.2–0.4), as they are in E-GEOD-21037 fibroblasts (0.4).
The dysfunctional MECP2 expression profile shows a slight, but in cell culture samples significant, upregulation of MEF2C and RBFOX1 (). Those genes that are supposed to be only activated when MECP2 is phosphorylated, and therefore detached from the DNA to allow RNA transcription, are here observed to be more highly expressed: SST, OPRK1, GAMT and GPRIN1. This indicates that MECP2 no longer blocks their transcription.
Network extension
Network analysis approaches, using Cytoscape, were used to visualise the genes of interest and extend the results of the GO analysis by integration of external database knowledge.
In a first step, the list of genes that were identified as consistently differentially expressed in one tissue group and in at least one more dataset (the 14 genes from and the 121 from Supplementary Table 3 for a different threshold) were visualised in Cytoscape. Then the network was extended using CyTargetLinker app for Cytoscape and the Homo sapiens package of LinkSets containing transcription factors from ENCODE and drug targets from DrugBank.
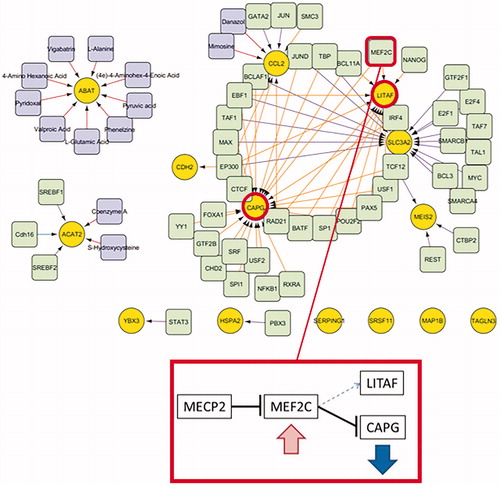
The result of network extension is shown in . Several transcription factors are already known to interact with MECP2, e.g., E2F1, MEF2C, REST, SIN3A, SMC3, SP1 and TAF1. Recognised as drug-targets were ACAT2 (S-hydroxycysteine and coenzyme A, which are substrates rather than drugs), CCL2 (mimosine and danazol, both inhibitors and approved drugs) and ABAT (valproic acid, vigabatrin and phenelzine (these are approved drugs and inhibitors to the target); pyridoxal phosphate and pyruvic acid (nutraceuticals, inhibitors); (4e)-4-aminohex-4-enoic acid and 4-amino hexanoic acid (these are experimental drugs); l-glutamic acid and l-alanine).
Figure 4. Network extension for the DEGs (yellow) using data from ENCODE proximal and distant transcription factors (light green), drug targets and drugs (violet) for threshold absolute logFC > 1 gene list. MECP2 WT inhibits expression of MEF2C, which inhibits expression of CAPG. If MECP2 is dysfunctional, CAPG was found to be mainly downregulated in the expression data. As MECP2 inhibition of MEF2C no longer works, MEF2C level increases (insignificant trend to upregulation found in data) and CAPG expression is inhibited. MEF2C is also a transcription factor for LITAF but the effect (stimulation or inhibition) is not clear from the data.
Discussion
The aim of the study was to establish a workflow to analyse multiple raw transcriptomics datasets with a common experimental setup (namely, human samples with impaired MECP2 versus control) and to investigate the DEGs for RTT at the level of genes, biological pathways and processes. The approach was a data driven identification of changed gene expression profiles and inclusion of prior knowledge (WikiPathways, GO, ENCODE, DrugBank) for the analysis of the biomedical impact in RTT. For an integrative study, we are dependent on the experimental execution and data quality of the original studies, and the correct and extensive annotation of data. Having one microarray per sample, without technical and biological replica, is hardly enough to draw conclusions; however, such data integration studies can help to overcome the problem of too few samples if the biological and experimental backgrounds are similar. More studies could be integrated in such approaches if raw data are consequently made available and re-usable. Nevertheless, we integrated such studies, which did not provide data but processed information, in the discussion.
Gene expression with impaired MECP2 – hypothesis versus data
Genes that are involved in RTT disorder development and progression, according to previously published studies, are MECP2, CDKL5, EGR2, PTPN1, BDNF, GAMT, FKBP5, IGF2, DLX5, DLX6, SGK1, MPP1, FXYD1, UBE3A and GRID1 (Ehrhart et al. Citation2016). These genes were found again in the data, but the reported outcome shows a greater variability than reported in literature. BDNF e.g., is mostly reported to be down regulated in RTT (or model systems). We found a significant downregulation only in one fibroblast and one iPSC sample, in other samples gene expression changes were not significant and occurred in both directions. We did not find a significant change in expression profile for either DLX5 or DLX6 and can therefore support the hypothesis that it is not involved in RTT disorder progression (Schule et al. Citation2007; Miyano et al. Citation2008). A general observation was that the gene expression patterns vary greatly among the different samples, which matches previous observations, e.g., from Colantuoni et al. (Citation2001) and Tanaka et al. (Citation2014). This study investigated iPSCs derived from RTT patients (and a clone with healthy X-chromosome as control) and all of them had different causative MECP2 mutations. The result was that gene expression profiles for those patients were very different. In our study, too, there is no single mutation occurring twice in the sample datasets. Low overlap of previously known genes and identified by the data-driven approach was reported several times previously (e.g., an epilepsy study (Rogic and Pavlidis Citation2009)), and all these studies revealed new genes which were not yet known to be involved in disease progression (Roder et al. Citation2012; Mistry et al. Citation2013; Raddatz et al. Citation2014; Ch'ng et al. Citation2015).
The choice of thresholds is a critical issue in this study. A significance threshold in the form of a P value could only be used if a certain amount of biological replicas were available. If there were only one sample or only technical replicas available the threshold was defined by log2FC of either >1 or <–1 (0.58), indicating a 2- or 1.5-fold expression level more than control. Several smaller but important changes in gene expression therefore may not be detected. We evaluated a higher and a lower log2FC threshold for those samples in which no P value could be calculated. Although, the higher threshold resulted in a smaller list of genes, the list of pathways and processes in which they were involved remained similar. This is a criterion that is good for artificial systems like the cell cultures, but possibly too stringent for human-derived tissue. FXYD1, e.g., was indeed differently changed with log2FC between 0.7 and 1.51, but, due to low average expression, we did not count it as differentially expressed, whereas the original authors did (Deng et al. Citation2007).
Newly identified DEGs are relevant in known RTT pathways
After grouping the available experimental data into three sub-groups (brain tissue, fibroblasts and neuronal cells), we identified several genes that were not yet mentioned in relation to RTT. Analysing their function in the context of pathways and function shows that they are clearly involved in processes known to be involved in RTT disease progression and therefore deserve further attention.
The changes in the expression of genes from human brain samples were mostly related to regulatory and signal transduction pathways as well as response to chemical stress, which may be due to apoptosis-related processes. This finding is in contrast to previous studies which also identified neuronal function-related genes differentially expressed (Colantuoni et al. Citation2001), but this may be due to the low number of overlapping genes generally found in all subsets. As mentioned before, the differences between human individuals and the internal and external influences on transcriptome are often bigger than the changes induced by disease. LITAF (which is found to be significantly differentially expressed in eight independent datasets for threshold 0.58 and in six for 1) is lipopolysaccharide induced and HSPA2 usually is stress induced. Inflammatory pathways were also found in the other tissue groups and have been described previously for RTT (Lin et al. Citation2016; Pecorelli et al. Citation2016; Miller et al. Citation2018); thus, inflammation-related processes may be involved in the progression of the disorder itself. The human brain tissue dataset is the most interesting for the study of RTT, but needs to be interpreted with care. Human brain tissue is usually only available post-mortem and the process of dying is mirrored in the gene expression profiles. In addition, the sample extraction concerning the timing and cooling chain is a potential cause of problems, especially for easily degradable RNA samples. For these samples the extraction was performed between 2.9 and 36 h post-mortem (supplementary material of Deng et al. (Citation2007)), and our quality control showed no noteworthy RNA degradation. Another cause of detection of inflammatory pathway activities in brain tissue might be the RNA extraction from white blood cells present in the tissue.
The typical RTT- or MECP2-related pathways are not significantly changed in fibroblasts. This is expected, because these neuronal pathways are not active in fibroblasts. Changes in cell cycle-related pathways are found in all samples, indicating that the influence of MECP2 reaches to the regulation of cell cycle in different tissues. This matches the data given in the tissue atlas, that MECP2 RNA and protein are found in almost any tissue and with as-yet unknown function. However, one of these functions in fibroblasts seems to be related to the cell cytoskeleton, adhesion and extracellular matrix, which is most affected in fibroblasts, indicating that MECP2 interferes with this process. Inflammatory- and cytoskeleton-related genes were also found previously by Traynor et al. (Citation2002). Cellular compartment organisation, e.g., actin/microtubule and cell adhesion processes, may link to MECP2 indirectly influencing the directed outgrowth of neurites in brain tissue samples and neuronal cell culture and of filopodia of fibroblasts. Microtubules are much too deacetylated in RTT due to HDAC6 dysregulation, which weakens the cytoskeleton, as shown in Gold et al. (Citation2015). Changes in the ratio of deposition of collagen I and III was observed, but this seems to be a subclinical issue of the disorder, as no skin problems, wound healing problems, or premature aging have been reported in females with RTT (Signorini et al. Citation2014).
Translation and RNA processing is impaired in RTT
Changes in RNA processing are identified more clearly by GO analysis than by pathway analysis because the changed genes are either hidden in non-significant pathways or not yet included in the WikiPathways database (WikiPathways currently includes about 7000 human genes). MECP2 is a known regulator of transcription and translation both generically and for single genes, and the data show that mRNA processing is altered in RTT and genes involved in translation initiation are especially massively downregulated (). MTOR is also downregulated, which fits the observation that the total protein levels of RTT cells are lower (Ricciardi et al. Citation2011). The AKT/mTOR pathway is a known disease pathway for neurofibromatosis (Banerjee et al. Citation2011).
Alternative splicing is also changed in RTT. There are several genes that are known to be differentially spliced in RTT (or MECP2-deficient models), namely DLX5 (a transcription factor that stimulates expression of GAD1 (GABA receptor)) (Miyano et al. Citation2008), FGF2 (a cell proliferation factor), FGF3, FGF4, FGF5, FUT8 and NF1 (neurofibromatosis 1) and GRIN1 (NMDA receptor) (Young et al. Citation2005; Nomura et al. Citation2008; Long et al. Citation2011; Smith and Sadee Citation2011; Cartron et al. Citation2013). Differential gene expression of splicing factors was also identified in a transcriptomics meta-study in schizophrenia (Mistry et al. Citation2013). There are multiple splicing factors differently expressed that may be caused by various splice variants observed in RTT. The spliceosome includes SR proteins (differentially expressed in this study: SRSF2, SRSF5 and SRSF7) that are adaptors that link mRNA to NXF1 (nuclear export factor 1) for alternative RNA processing and export (Muller-McNicoll et al. Citation2016), and help to form spliceosomal complex A (WP411). CLP1 is a component of the tRNA endonuclease complex and an essential part for tRNA maturation. Mutations in CLP1 have been proven to cause neurodegenerative disorders (Schaffer et al. Citation2014). PRPF38B, SNRPB2 and SRSF11 are DEGs responsible for ‘RNA splicing’ in the neuronal cells.
Bedogni et al. (Citation2014) investigated animal studies in RTT and found that (apart from several cytoskeleton- and cell metabolism-related pathways) intracellular signalling, namely the eukaryotic initiation of transcription factors (EIF) signalling pathway, was affected. Many EIFs that were found in this study are significantly downregulated. Impaired function of EIF pathways regulating protein production was associated with several disorders (Chang et al. Citation2006). EIF2 was previously identified as one of the factors involved in age-associated spatial learning impairment (also identified by a transcriptomics meta-study (Uddin and Singh Citation2013)). Therefore, our data support the hypothesis that EIF signalling and regulatory pathways are relevant, also causing the disorder phenotype in RTT.
Possible connection between MECP2 and CAPG via MEF2C
Using network extension, we investigated whether there are known transcription factors that may explain the regulation of genes and processes back to their core gene MECP2. Several transcription factors, which were added by network extension, are already known to interact with MECP2: E2F1, MEF2C, REST, SIN3A, SMC3, SP1 and TAF1. E2F1 and TAF1 are promotor elements of MECP2 (Ehrhart et al. Citation2016). SP1 is known as a cis regulatory element and promotor element of MECP2. REST is a cis regulatory element of MECP2. SIN3A is an integral part of the MECP2-HDAC complex and SMC3 is one of the cofactors of this complex. MEF2C expression is inhibited by MECP2 together with HDAC complex. It interacts with EP300, several histone deacetylases and SP1. Mutations of MEF2C are known to cause mental retardation and psychomotor impairment (Le Meur et al. Citation2010). Furthermore, the network extension with known transcription factors revealed a possible connection between cytoskeleton organisation and MECP2 via MEF2C and CAPG. We hypothesise that MECP2 regulates CAPG expression via MEF2C ().
These results, nevertheless, need to be handled with caution because the number of studies and samples often is limited and the setting of thresholds is crucial. Our analysis integrating five independent studies, with a total of 48 microarrays of each 24 human RTT and control samples, revealed a set of new genes, which were unknown to be involved in disease progression but often related to processes known to be affected. This study also confirms that inflammatory, mRNA processing and transcription initiation pathways are affected and even may be the major drivers of RTT as they were also confirmed for other mental disorders. A general conclusion of our analysis is that one gene–one disease is definitively true as a basis for RTT, but the link between mutation and phenotypic outcome is defined by a broader range of pathways and processes than just neurological or neurodevelopmental ones. This connection involves a complex network in which individual genetic variation and environmental influence determine the disorder outcome.
Supplemental Table 2: Differentially expressed gene lists
Download MS Excel (13.7 MB)Supplemental Figure 1: PRISMA flow diagram
Download PDF (103.6 KB)QC report for E-MEXP-1956
Download PDF (2.8 MB)QC report for E-GEOD-50584
Download PDF (4.8 MB)QC report for E-GEOD-21037
Download PDF (3.2 MB)QC report for E-GEOD-6955
Download PDF (2.8 MB)QC report for E-GEOD-4600
Download PDF (4.1 MB)Supplemental Figure 2: HR Brain data
Download PNG Image (2.5 MB)
Supplemental Figure 3: HR Neuronal cell culture data
Download PNG Image (2.6 MB)
Supplemental Figure 4: HR Fibroblast data
Download PNG Image (2.5 MB)
Acknowledgements
The authors would like to thank the authors of the original studies for providing their data in a FAIR way, making these kinds of meta-studies possible.
Disclosure statement
No potential conflict of interest was reported by the authors.
Additional information
Funding
Related Research Data
References
- Amir RE, Van den Veyver IB, Wan M, Tran CQ, Francke U, Zoghbi HY. 1999. Rett syndrome is caused by mutations in X-linked MECP2, encoding methyl-CpG-binding protein 2. Nat Genet. 23:185–188.
- Banerjee S, Crouse NR, Emnett RJ, Gianino SM, Gutmann DH. 2011. Neurofibromatosis-1 regulates mTOR-mediated astrocyte growth and glioma formation in a TSC/Rheb-independent manner. Proc Natl Acad Sci U S A. 108:15996–16001.
- Bedogni F, Rossi RL, Galli F, Cobolli Gigli C, Gandaglia A, Kilstrup-Nielsen C, Landsberger N. 2014. Rett syndrome and the urge of novel approaches to study MeCP2 functions and mechanisms of action. Neurosci Biobehav Rev. 46 Pt 2:187–201.
- Cartron PF, Nadaradjane A, Lepape F, Lalier L, Gardie B, Vallette FM. 2013. Identification of TET1 partners that control its DNA-demethylating function. Genes Cancer. 4:235–241.
- Chahrour M, Jung SY, Shaw C, Zhou X, Wong ST, Qin J, Zoghbi HY. 2008. MeCP2, a key contributor to neurological disease, activates and represses transcription. Science. 320:1224–1229.
- Chang RC, Yu MS, Lai CS. 2006. Significance of molecular signaling for protein translation control in neurodegenerative diseases. Neurosignals. 15:249–258.
- Ch'ng C, Kwok W, Rogic S, Pavlidis P. 2015. Meta-analysis of gene expression in autism spectrum disorder. Autism Res. 8:593–608.
- Colantuoni C, Jeon OH, Hyder K, Chenchik A, Khimani AH, Narayanan V, Hoffman EP, Kaufmann WE, Naidu S, Pevsner J. 2001. Gene expression profiling in postmortem Rett Syndrome brain: differential gene expression and patient classification. Neurobiol Dis. 8:847–865.
- Deng V, Matagne V, Banine F, Frerking M, Ohliger P, Budden S, Pevsner J, Dissen GA, Sherman LS, Ojeda SR. 2007. FXYD1 is an MeCP2 target gene overexpressed in the brains of Rett syndrome patients and Mecp2-null mice. Hum Mol Genet. 16:640–650.
- Edgar R, Domrachev M, Lash AE. 2002. Gene Expression Omnibus: NCBI gene expression and hybridization array data repository. Nucleic Acids Res. 30:207–210.
- Ehrhart F, Coort SL, Cirillo E, Smeets E, Evelo CT, Curfs LM. 2016. Rett syndrome - biological pathways leading from MECP2 to disorder phenotypes. Orphanet J Rare Dis. 11:158.
- Eijssen LM, Jaillard M, Adriaens ME, Gaj S, de Groot PJ, Muller M, Evelo CT. 2013. User-friendly solutions for microarray quality control and pre-processing on ArrayAnalysis.org. Nucleic Acids Res. 41:W71–W76.
- Gold WA, Lacina TA, Cantrill LC, Christodoulou J. 2015. MeCP2 deficiency is associated with reduced levels of tubulin acetylation and can be restored using HDAC6 inhibitors. J Mol Med. 93:63–72.
- Gonzales ML, Adams S, Dunaway KW, LaSalle JM. 2012. Phosphorylation of distinct sites in MeCP2 modifies cofactor associations and the dynamics of transcriptional regulation. Mol Cell Biol. 32:2894–2903.
- Jordan C, Li HH, Kwan HC, Francke U. 2007. Cerebellar gene expression profiles of mouse models for Rett syndrome reveal novel MeCP2 targets. BMC Med Genet. 8:36.
- Kutmon M, Kelder T, Mandaviya P, Evelo CT, Coort SL. 2013. CyTargetLinker: a cytoscape app to integrate regulatory interactions in network analysis. PLoS One. 8:e82160.
- Kutmon M, van Iersel MP, Bohler A, Kelder T, Nunes N, Pico AR, Evelo CT. 2015. PathVisio 3: an extendable pathway analysis toolbox. PLoS Comput Biol. 11:e1004085.
- Kutmon M, Ehrhart F, Willighagen EL, Evelo CT, Coort SL. 2018. CyTargetLinker app update: A flexible solution for network extension in Cytoscape. F1000Res 7:743. doi:10.12688/f1000research.14613.1
- Laurvick CL, de Klerk N, Bower C, Christodoulou J, Ravine D, Ellaway C, Williamson S, Leonard H. 2006. Rett syndrome in Australia: a review of the epidemiology. J Pediatr. 148:347–352.
- Le Meur N, Holder-Espinasse M, Jaillard S, Goldenberg A, Joriot S, Amati-Bonneau P, Guichet A, Barth M, Charollais A, Journel H, et al. 2010. MEF2C haploinsufficiency caused by either microdeletion of the 5q14.3 region or mutation is responsible for severe mental retardation with stereotypic movements, epilepsy and/or cerebral malformations. J Med Genet. 47:22–29.
- Li J, Shi M, Ma Z, Zhao S, Euskirchen G, Ziskin J, Urban A, Hallmayer J, Snyder M. 2014. Integrated systems analysis reveals a molecular network underlying autism spectrum disorders. Mol Syst Biol. 10:774.
- Li Y, Wang H, Muffat J, Cheng AW, Orlando DA, Loven J, Kwok SM, Feldman DA, Bateup HS, Gao Q, et al. 2013. Global transcriptional and translational repression in human-embryonic-stem-cell-derived Rett syndrome neurons. Cell Stem Cell. 13:446–458.
- Lin P, Nicholls L, Assareh H, Fang Z, Amos TG, Edwards RJ, Assareh AA, Voineagu I. 2016. Transcriptome analysis of human brain tissue identifies reduced expression of complement complex C1Q Genes in Rett syndrome. BMC Genomics. 17:427.
- Liyanage VR, Rastegar M. 2014. Rett syndrome and MeCP2. Neuromolecular Med. 16:231–264.
- Long SW, Ooi JY, Yau PM, Jones PL. 2011. A brain-derived MeCP2 complex supports a role for MeCP2 in RNA processing. Biosci Rep. 31:333–343.
- Miller RA, Ehrhart F, Eijssen LMT, Slenter DN, Curfs LMG, Evelo CT, Willighagen EL, Kutmon M. 2018. Beyond pathway analysis: Identification of active subnetworks in Rett syndrome. Front Genet. (accepted).
- Mistry M, Gillis J, Pavlidis P. 2013. Genome-wide expression profiling of schizophrenia using a large combined cohort. Mol Psychiatry. 18:215–225.
- Miyano M, Horike S, Cai S, Oshimura M, Kohwi-Shigematsu T. 2008. DLX5 expression is monoallelic and Dlx5 is up-regulated in the Mecp2-null frontal cortex. J Cell Mol Med. 12:1188–1191.
- Moher D, Liberati A, Tetzlaff J, Altman DG, Group P. 2009. Preferred reporting items for systematic reviews and meta-analyses: the PRISMA statement. PLoS Med. 6:e1000097.
- Muller-McNicoll M, Botti V, de Jesus Domingues AM, Brandl H, Schwich OD, Steiner MC, Curk T, Poser I, Zarnack K, Neugebauer KM. 2016. SR proteins are NXF1 adaptors that link alternative RNA processing to mRNA export. Genes Dev. 30:553–566.
- Muotri AR, Marchetto MC, Coufal NG, Oefner R, Yeo G, Nakashima K, Gage FH. 2010. L1 retrotransposition in neurons is modulated by MeCP2. Nature. 468:443–446.
- Nectoux J, Fichou Y, Rosas-Vargas H, Cagnard N, Bahi-Buisson N, Nusbaum P, Letourneur F, Chelly J, Bienvenu T. 2010. Cell cloning-based transcriptome analysis in Rett patients: relevance to the pathogenesis of Rett syndrome of new human MeCP2 target genes. J Cell Mol Med. 14:1962–1974.
- Nguyen MV, Du F, Felice CA, Shan X, Nigam A, Mandel G, Robinson JK, Ballas N. 2012. MeCP2 is critical for maintaining mature neuronal networks and global brain anatomy during late stages of postnatal brain development and in the mature adult brain. J Neurosci. 32:10021–10034.
- Nomura T, Kimura M, Horii T, Morita S, Soejima H, Kudo S, Hatada I. 2008. MeCP2-dependent repression of an imprinted miR-184 released by depolarization. Hum Mol Genet. 17:1192–1199.
- Pecorelli A, Cervellati C, Hayek J, Valacchi G. 2016. OxInflammation in Rett syndrome. Int J Biochem Cell Biol. 81:246–253.
- Peddada S, Yasui DH, LaSalle JM. 2006. Inhibitors of differentiation (ID1, ID2, ID3 and ID4) genes are neuronal targets of MeCP2 that are elevated in Rett syndrome. Hum Mol Genet. 15:2003–2014.
- Raddatz BB, Hansmann F, Spitzbarth I, Kalkuhl A, Deschl U, Baumgartner W, Ulrich R. 2014. Transcriptomic meta-analysis of multiple sclerosis and its experimental models. PLoS One. 9:e86643.
- Rett A. 1966. [On a unusual brain atrophy syndrome in hyperammonemia in childhood]. Wien Med Wochenschr. 116:723–726.
- Ricciardi S, Boggio EM, Grosso S, Lonetti G, Forlani G, Stefanelli G, Calcagno E, Morello N, Landsberger N, Biffo S, et al. 2011. Reduced AKT/mTOR signaling and protein synthesis dysregulation in a Rett syndrome animal model. Hum Mol Genet. 20:1182–1196.
- Roder C, Kasuya H, Harati A, Tatagiba M, Inoue I, Krischek B. 2012. Meta-analysis of microarray gene expression studies on intracranial aneurysms. Neuroscience. 201:105–113.
- Rogic S, Pavlidis P. 2009. Meta-analysis of kindling-induced gene expression changes in the rat hippocampus. Front Neurosci. 3:53.
- Rustici G, Kolesnikov N, Brandizi M, Burdett T, Dylag M, Emam I, Farne A, Hastings E, Ison J, Keays M, et al. 2013. ArrayExpress update-trends in database growth and links to data analysis tools. Nucleic Acids Res. 41:D987–9D990.
- Schaffer AE, Eggens VR, Caglayan AO, Reuter MS, Scott E, Coufal NG, Silhavy JL, Xue Y, Kayserili H, Yasuno K, et al. 2014. CLP1 founder mutation links tRNA splicing and maturation to cerebellar development and neurodegeneration. Cell. 157:651–663.
- Schule B, Li HH, Fisch-Kohl C, Purmann C, Francke U. 2007. DLX5 and DLX6 expression is biallelic and not modulated by MeCP2 deficiency. Am J Hum Genet. 81:492–506.
- Shannon P, Markiel A, Ozier O, Baliga NS, Wang JT, Ramage D, Amin N, Schwikowski B, Ideker T. 2003. Cytoscape: a software environment for integrated models of biomolecular interaction networks. Genome Res. 13:2498–2504.
- Signorini C, Leoncini S, De Felice C, Pecorelli A, Meloni I, Ariani F, Mari F, Amabile S, Paccagnini E, Gentile M, et al. 2014. Redox imbalance and morphological changes in skin fibroblasts in typical Rett syndrome. Oxid Med Cell Longev. 2014:195935.
- Smith RM, Sadee W. 2011. Synaptic signaling and aberrant RNA splicing in autism spectrum disorders. Front Synaptic Neurosci. 3:1.
- Smoot ME, Ono K, Ruscheinski J, Wang PL, Ideker T. 2011. Cytoscape 2.8: new features for data integration and network visualization. Bioinformatics. 27:431–432.
- Tanaka Y, Kim KY, Zhong M, Pan X, Weissman SM, Park IH. 2014. Transcriptional regulation in pluripotent stem cells by methyl CpG-binding protein 2 (MeCP2). Hum Mol Genet. 23:1045–1055.
- Traynor J, Agarwal P, Lazzeroni L, Francke U. 2002. Gene expression patterns vary in clonal cell cultures from Rett syndrome females with eight different MECP2 mutations. BMC Med Genet. 3:12.
- Uddin RK, Singh SM. 2013. Hippocampal gene expression meta-analysis identifies aging and age-associated spatial learning impairment (ASLI) genes and pathways. PLoS One. 8:e69768.
- Uhlen M, Fagerberg L, Hallstrom BM, Lindskog C, Oksvold P, Mardinoglu A, Sivertsson A, Kampf C, Sjostedt E, Asplund A, et al. 2015. Proteomics. Tissue-based map of the human proteome. Science. 347:1260419.
- van Iersel MP, Pico AR, Kelder T, Gao J, Ho I, Hanspers K, Conklin BR, Evelo CT. 2010. The BridgeDb framework: standardized access to gene, protein and metabolite identifier mapping services. BMC Bioinformatics. 11:5.
- Young JI, Hong EP, Castle JC, Crespo-Barreto J, Bowman AB, Rose MF, Kang D, Richman R, Johnson JM, Berget S, et al. 2005. Regulation of RNA splicing by the methylation-dependent transcriptional repressor methyl-CpG binding protein 2. Proc Natl Acad Sci USA. 102:17551–17558.
- Zambon AC, Gaj S, Ho I, Hanspers K, Vranizan K, Evelo CT, Conklin BR, Pico AR, Salomonis N. 2012. GO-Elite: a flexible solution for pathway and ontology over-representation. Bioinformatics. 28:2209–2210.
- Zhang R, Lahens NF, Ballance HI, Hughes ME, Hogenesch JB. 2014. A circadian gene expression atlas in mammals: implications for biology and medicine. Proc Natl Acad Sci USA. 111:16219–16224.