
Abstract
Objective
To better understand the neural mechanisms behind the effect of intermittent theta-burst stimulation (iTBS), we investigated how the prefrontal blood oxygenation response measured by changes in oxygenated haemoglobin (oxy-Hb) was modulated during a sham-controlled iTBS treatment course, and whether this was related to depressive symptom change.
Methods
In this randomised, double-blind study, patients with ongoing treatment-resistant depression received either active (n = 18) or sham (n = 21) iTBS over the dorsomedial prefrontal cortex for ten to fifteen days with two sessions daily. Event-related functional near-infrared spectroscopy (fNIRS) was measured during each iTBS train, and resting-state oxy-Hb was compared before and after each iTBS session at the first, fifth, and last treatment day.
Results
Patients receiving active iTBS had an increase of the event-related oxy-Hb response compared to the sham group on the fifth (bilateral prefrontal cortices p < .001) and last (left prefrontal p = .007, right prefrontal p = .025) treatment day. Resting-state analysis showed suppressed oxy-Hb change in active iTBS compared to sham iTBS on the last treatment day (p = .024). Oxy-Hb change was unrelated to depressive symptom change (p = .474).
Conclusions
This study describes a modulation of the blood oxygenation response over the prefrontal cortex that was built up during the course of active iTBS treatment in depression.
Introduction
Repetitive transcranial magnetic stimulation (rTMS) is an emerging alternative for treatment-resistant depression. Conventional rTMS protocols apply either low-frequency stimulation over the right dorsolateral prefrontal cortex (dlPFC) or high-frequency stimulation over the left dlPFC (O’Reardon et al. Citation2007). Recently, new protocols such as intermittent theta burst stimulation (iTBS) (Huang et al. Citation2005) were reported to have a shorter duration while being non-inferior to an established protocol (Blumberger et al. Citation2018). Furthermore, to reduce the number of treatment days and thereby increase feasibility, accelerated protocols with several sessions per day have been reported beneficial with both conventional high-frequency protocols and iTBS (McGirr et al. Citation2015; Duprat et al. Citation2016).
Besides new rTMS protocols, other targets for stimulation, i.e. the dorsomedial prefrontal cortex (dmPFC), have been suggested to be effective in the treatment of depression (Downar and Daskalakis Citation2013). Several lines of evidence point to its involvement in depression, with lesions in the dmPFC having been associated with a high risk of severe depression (Koenigs et al. Citation2008). Further, the dmPFC shows increased functional connectivity to numerous brain regions involved in emotion regulation, including the anterior cingulate cortex (ACC) (Sheline et al. Citation2010), while antidepressant medication reduces functional connectivity within the dmPFC in healthy controls (McCabe et al. Citation2011). Together, this suggests that functional modulation of this brain region might have an antidepressive effect. An initial open-label depression study of rTMS over the dmPFC reported this target being safe and tolerable (Bakker et al. Citation2015).
While stimulation with low frequency rTMS mostly results in decreased cortical excitability, high frequency rTMS and iTBS mostly result in increased cortical excitability when applied over the motor cortex (Hoogendam et al. Citation2010). However, rTMS is commonly applied over prefrontal areas in patients with depression where the immediate effect of the stimulation is difficult to assess as there is no established read-out from the prefrontal cortex during stimulation (Philip et al. Citation2018). With functional magnetic resonance imaging (fMRI) it is possible to study the short term haemodynamic network after-effects, and a recent study showed that rTMS over the dlPFC modulates the functional connectivity of the ACC with a corticolimbic network, including the dmPFC (Tik et al. Citation2017). RTMS over the dmPFC might have a common mechanism of action as rTMS over the dlPFC on a network level, however this is not yet known. Thus, there is a need to understand both the immediate local prefrontal effects of iTBS over the dmPFC as well as medium-term and long-term effects reflecting a potential modulation over time.
Functional near-infrared spectroscopy (fNIRS) is a non-invasive technique to measure changes in cortical oxygenated (oxy-Hb) and deoxygenated (deoxy-Hb) haemoglobin concentrations. Due to the phenomenon of neurovascular coupling, fNIRS enables assessment of the neural activity (Gratton et al. Citation1997) and can be applied concomitant with rTMS. Using fNIRS is especially practical in the clinical rTMS setting, as it is easy to apply repeatedly over a time course of several treatment sessions. To date, most fNIRS-rTMS research has been conducted on healthy controls (Curtin et al. Citation2019). In these studies, single session low-frequency rTMS protocols (Hanaoka et al. Citation2007; Aoyama et al. Citation2009; Kozel et al. Citation2009; Cao et al. Citation2013) as well as continuous theta-burst stimulation (Tupak et al. Citation2013) decrease prefrontal oxy-Hb levels, while high-frequency rTMS protocols increase prefrontal oxy-Hb levels (Cao et al. Citation2013; Curtin et al. 2017). However, how these brain mechanisms are modulated over the time course of an rTMS treatment in a depressed brain is largely unknown.
To the best of our knowledge, no study has hitherto applied fNIRS together with dmPFC-iTBS in a sham controlled treatment study. In this study, we used event-related and resting-state fNIRS to compare changes in oxy-Hb following active versus sham iTBS over dmPFC during the course of a depression treatment. Furthermore, we assessed whether these oxy-Hb changes were related to the change of patients’ depressive symptoms.
Methods
Study design and participants
Forty patients were included in this randomised, double-blind, sham-controlled, parallel-group study. Patients were recruited from the psychiatric outpatient clinic at Uppsala University Hospital, Sweden. This dataset is a subsample of an ongoing randomised controlled trial at the Brain Stimulation Unit, Uppsala University Hospital, Sweden. All patients were diagnosed with either unipolar (n = 36) or bipolar (n = 4) major depression as verified through a Mini International Neuropsychiatric Interview (M.I.N.I.) (Sheehan et al. Citation1998) and had a clinical history of resistance to prior depression treatment. To be eligible for inclusion, patients had to be between 18 and 59 years old with unchanged medication at least one month before treatment start. Exclusion criteria included epilepsy, intracranial metallic implants, pacemaker or implantable cardioverter defibrillator, pregnancy, and active substance use disorder. Written informed consent was obtained from all participants. The study was approved by the Ethical Review Board, Uppsala University and conducted in accordance with the principles of The Declaration of Helsinki.
Procedures
The patients were randomised in two parallel groups, i.e. active or sham iTBS treatment. For each patient, the magnetic stimulator operating staff received an envelope containing a randomisation code prepared by an independent clinical research organisation. Both patients and magnetic stimulator operating staff were blinded to the group allocation. Self-assessed depressive symptoms were obtained using the Montgomery-Åsberg Depression Rating Scale (MADRS-S) (Montgomery and Asberg Citation1979) one day before treatment start and again four weeks later. Suicidal thoughts were assessed each treatment day on a scale from 1 (no suicidal thoughts) to 4 (severe suicidal thoughts).
Intervention – repetitive transcranial magnetic stimulation
RTMS was performed using the Cool D-B80 A/P butterfly coil (MagVenture, Denmark), designed for sham-controlled stimulation. The coil consists of two visually identic 120° angled figure-of-eight coils back-to-back, one of them with a shielded magnetic field. The coil has a position sensor and the stimulator has a built-in research software determining whether the active or sham coil is to be used, depending on the randomisation code for each patient, prompting the operator which side of the coil to use. Treatment was given twice daily, with a fifteen minute break between the treatment sessions (Tse et al. Citation2018), over a course of ten to fifteen consecutive working days. To increase tolerability of the interventions, intensity was gradually ramped up to target intensity according to pain ratings by the patient. An additional treatment day was added if target intensity was not reached for at least half the amount of trains on a treatment day, for up to fifteen treatment days in total. Each iTBS session comprised 40 trains of stimulation (2 s on, 8 s off), each train consisting of ten bursts at 5 Hz and each burst consisting of three biphasic pulses delivered at 50 Hz. Patients thus received 1200 pulses per treatment session, with two blocks of 600 pulses. To enable bilateral stimulation, coil current direction changed between the two session blocks, with the initial current direction going left-to-right in the first session block and right-to-left in the second session block. Balancing the coil current direction also enables an interpretation of potential laterality effects in the fNIRS signal. Transcutaneous electrical nerve stimulation (TENS) electrodes were applied medially on the forehead directly beneath the magnetic coil. In the sham condition, patients received a mild TENS with a maximum current of 4 mA, synchronous with the described rTMS pulses to mimic the sensation of active stimulation. The sham side of the coil was shielded to prevent magnetic stimulation to reach the cortex. No TENS current was applied in the active condition.
The treatment intervention was delivered over the dmPFC following MRI-guided neuronavigation (TMS Navigator, Localite, Bonn, Germany). The brain target used for neuronavigation was the dorsal ACC, and defined by the following Montreal Neurological Institute coordinates: X = 0, Y = 30, Z = 30 (Mir-Moghtadaei et al. Citation2016). Stimulation intensity was gradually ramped up to 90% of the resting foot motor threshold (RMT) which was determined before the first treatment session (Salomons et al. Citation2014). RMT was defined as lowest intensity needed to elicit a visible muscle contraction of the extensor hallucis longus muscle 5 out of 10 times when stimulating the medial primary motor cortex.
fNIRS signal acquisition
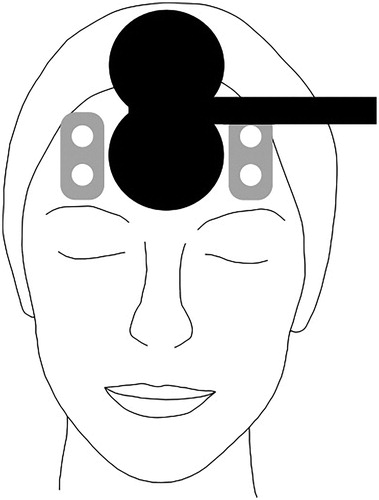
Haemoglobin concentration changes were obtained from a two-channel NIRS system (NIRO-200NX, Hamamatsu Photonics, Hamamatsu, Japan). While putting the optodes directly under the coil would increase distance between the coil and stimulation target, placing them laterally over the prefrontal cortex allowed for probing indirect effects of dmPFC-iTBS via the targeted corticolimbic network (Tik et al. Citation2017). Thus, we assumed that measured changes in oxygenation would at least partially reflect network level stimulation effects on the dmPFC. The probe holders were positioned over the left and right forehead as high as possible up to hairline, and laterally aligned to the TMS coil with the emission optode above the detector optode and inter-optode distance 3.5 cm (). An elastic bandage was wrapped around the probe holders to enable a better fit and to prevent extraneous light from entering. Changes in light attenuation at three wavelengths (735, 810, and 850 nm) were measured using the modified Beer-Lambert law. Based on an estimated differential path length factor of 5.93 cm according to the NIRS device manual, oxygenated haemoglobin (oxy-Hb), deoxygenated haemoglobin (deoxy-Hb), and total haemoglobin (total-Hb) were calculated as absolute concentration changes. Based on previous studies, oxy-Hb was chosen as main outcome measure (Curtin et al. Citation2019). The fNIRS signal was acquired with a sampling frequency of 5 Hz. The fNIRS-data were collected on the first, the fifth, and the last day of treatment. Once the patient was seated comfortably in the treatment chair and the probe holders were attached, the fNIRS signal acquisition started and an initial five minute resting state measurement was conducted. During the resting state measurements before the first iTBS session and between the session blocks, patients were instructed to sit calmly and rest. The fNIRS signal acquisition was continuous over both iTBS treatment sessions. During treatment, a trigger signal was sent from the TMS device to the NIRO system to collect event markers defining the onset of each TMS burst.
Figure 1. Placement of the fNIRS optodes over the left and right forehead, with the emission probe above the detector probe, each laterally aligned to the TMS coil.
fNIRS signal processing
The fNIRS data was preprocessed using MATLAB R2017a. Two fourth order bandstop Butterworth filters were applied at 0.12–0.35 Hz and 0.7–1.5 Hz to reduce noise stemming from respiration and cardiac pulsation, respectively (Tak et al. Citation2015) and data were smoothed using a moving-average filter.
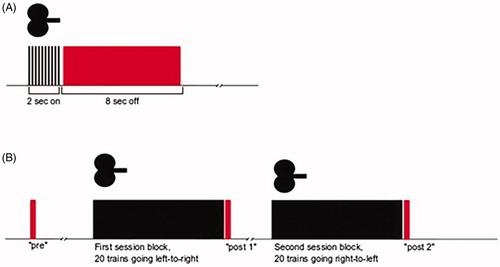
For the event-related analysis, data segments were taken from the 8 s ‘off’ within each train of iTBS (). As each treatment day consisted of 80 iTBS trains, this resulted in 80 segments. The first data point of each segment was used as baseline and subtracted from each following data point. The last data point of each segment was ignored as to ensure no overlap with possible artefacts emanating from the next iTBS train. This resulted in a segment length of 7.6 s. Individual grand averages were calculated by averaging data points across all 80 segments for each patient per treatment day. Subsequently, group grand averages were calculated by averaging the individual grand averages within each treatment group per treatment day. For each group grand average, peak was then defined as maximum amplitude. Subsequently, a 2 s interval was defined: peak of the active group, averaged across treatment days, plus/minus 1 s, to account for the slow haemodynamic response. The same 2 s interval was applied for the grand averages of the sham group. The means of each 2 s interval from the individual grand averages were subsequently used as outcome measures in the statistical analyses.
Figure 2. Data segments used in the event-related analysis (A) and resting-state analysis (B). Red indicates the fNIRS data segments, black indicates iTBS.
For a subanalysis of latency, mean time to peak in oxy-Hb increase was calculated for each patient per treatment day.
For a subanalysis of coil current direction, data was divided in two blocks, with the initial coil current going either left-to-right (iTBS trains 1–20 and 41–60) or right-to-left (iTBS trains 21–40 and 61–80).
For the resting-state analysis, data were segmented into intervals of 10 s each, with one baseline segment before treatment onset (‘pre’), one segment directly after the first session block (‘post 1’), and one segment directly after the second session block (‘post 2’) (). For the resting-state analysis, segment length was chosen as 10 seconds because we thought that a shorter period (e.g. 5 seconds (Mochizuki et al. Citation2007)) could give a more random ‘pre’ oxygenation state, whereas a longer period (e.g. 20–60 seconds (Hanaoka et al. Citation2007; Shinba et al. Citation2018)) would be prone to variation of oxygen haemoglobin levels related to cognitive distraction in the research room. Two delta-values were calculated, i.e. post1-pre and post2-pre, and then, given that both deltas refer to the same ‘pre’-value, averaged across patients within each treatment group. Positive delta values indicate an oxy-Hb increase after the iTBS session, and a value of zero indicates no change in oxy-Hb levels after the iTBS session. The two session blocks were considered together in the subsequent analysis. The mean post-pre values were used as outcome measures in the statistical analyses.
Statistical analysis
Statistical analysis was performed using SPSS 25.0. Baseline demographic and clinical characteristics were assessed by means of Χ2 tests (sex, education, and primary diagnosis) or t-tests (age, MADRS-S, self-rated health status [EQ VAS] , and depression resistance assessed with Maudsley Staging Method for Treatment Resistant Depression [MSM]), comparing the two groups. If the number of patients taking a medication was two or less, no statistical tests were performed. To analyse oxy-Hb responses in event-related and resting-state fNIRS, linear mixed-effects (LME) models with random intercept and fixed slope were conducted, with the factors group (active iTBS, sham iTBS) and day (first, fifth, and last treatment day) for both left and right fNIRS channel. Symptom change, i.e. difference between the two total MADRS-S scores (pre – post over the full treatment course), was used as covariate to assess potential treatment effects. For subanalyses, age, core depression symptom change (mean across three MADRS-S items [i.e. items 1, 6, and 7], pre – post over the full treatment course) and suicidal thoughts (pre – post over the full treatment course) were used as covariates. Subsequently, pairwise comparisons between treatment groups were conducted for each treatment day. For all statistical tests, the α-level was set to 5%.
For subanalyses of latency, the time to peak in oxy-Hb increase of each individual grand average were used as outcome measure.
For subanalyses of coil current direction, LME models were calculated for both directions within each fNIRS channel, and then compared with the original LME model results.
Results
Demographic and clinical characteristics
After study inclusion, one patient terminated study participation, resulting in 39 patients (18 male, 21 female, mean age = 29) included in the analysis. Eighteen patients were randomised to active iTBS, and 21 to sham iTBS. There was no difference at baseline between the groups in demographic and clinical variables (). Stimulants were used by two patients in the sham group. Propranolol was used by one patient in the sham group. Levothyroxine was used by one patient in the active, and two patients in the sham group. Two patients, both in the active group, did not use any medication at all. None of the patients used medications for cardiovascular diseases or migraine. Sixty-two percent of patients received the intended 10 treatment days. The rest of the patients received 11 days (10%), 12, 13, or 14 days (5%, respectively), or 15 days (13%). There was no difference between number of fulfilled treatment days between the groups (p = .121). Due to missing data, final fNIRS data included 37 patients (active: n = 17, sham: n = 20) on the first day, 37 patients (active: n = 18, sham, n = 19) on the fifth day, and 32 patients (active: n = 14, sham: n = 18) on the last day.
Table 1. Baseline demographic and clinical characteristics.
The MADRS-S score was reduced with 5.4 points in the active iTBS group, and with 2.1 points in the sham group. This symptom change did not differ significantly between the groups (t = 1.38, p = .175).
Event-related oxy-Hb
Across all patients, i.e. without dividing data into the two groups, means (standard deviations) for the left and right channel were 0.03 (0.15) and 0.09 (0.33) on the first day, 0.09 (0.18) and 0.13 (0.30) on the fifth day, and 0.13 (0.22) and 0.15 (0.28) on the last day, respectively. Event-related oxy-Hb responses from four randomly selected patients are depicted in Supplementary Figure S1.
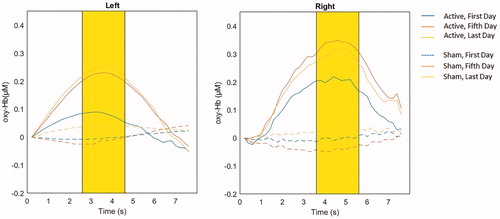
shows the group grand averages oxy-Hb responses during iTBS trains in the left and right fNIRS channels. A linear mixed-effects (LME) model showed a main effect of group in both channels (left: F = 19.10, p < .001, right: F = 9.56, p = .004) and a main effect of day in the left channel (F = 6.31, p = .004). This was further qualified by a group x day interaction (left: F = 6.40, p = .004, right: F = 5.55, p = .007), reflecting different trajectories in oxy-Hb during the treatment course. Specifically, pairwise comparisons between treatment days showed a difference between the treatment groups on the fifth and the last day both in the left (fifth: p < .001, last: p = .007) and right (fifth; p < .001, last: p = .025) channel, with the active iTBS group having a higher oxy-Hb level than the sham iTBS group. Furthermore, pairwise comparisons in the sham group showed no differences between treatment days, indicating no change in oxy-Hb levels during the sham iTBS treatment course.
Figure 3. Group grand averages of oxy-Hb responses during iTBS trains in the left and right fNIRS channel. Highlighted intervals mark the segment used in statistical analysis, with the mean peak of the active group plus/minus 1 s.
There was no main effect of symptom change (left: F = 0.07, p = .800, right: F = 0.45, p = .509) and no group x day x symptom change interaction (left: F = 2.04, p = .087, right: F = 1.78 p = .137). When analysing only the active group, there was again no main effect of symptom change (left: F = 0.03, p = .856, right: F = 0.26, p = .619) and no day x symptom change interaction (left: F = 2.77, p = .086, right: F = 2.47, p = .110). Subanalyses of the whole sample with age as covariate did not yield a main effect of age (left: F = 3.28, p = .077, right: F = 0.18, p = .671), but a significant age x day interaction in both the left (F = 3.51, p = .038) and right (F = 4.58, p = .017) channel.
The grand average peaks, averaged across treatment days, in the active iTBS group in the left channel occurred one second earlier than in the right channel (3.6 s, and 4.6 s, respectively). Subanalyses of latency showed no differences between treatment days (no main effect of day, left: F = 0.22, p = .806, right: F = 0.15, p = .86, and no significant paired comparisons between treatment days in either channel).
The subanalyses with core depression symptom change or suicidal thoughts as covariate showed the same result pattern as the original total MADRS-S change covariate (data not shown).
Subanalysis of coil current direction showed the same result pattern as the original analysis, with the active iTBS group having a higher oxy-Hb level than the sham iTBS group on the fifth and last treatment day and no change in oxy-Hb levels during the sham iTBS treatment course (Supplementary Figure S2).
Resting-state oxy-Hb
Across all patients, i.e. without dividing data into the two groups, means (standard deviations) for the left and right channel were 0.93 (3.05) and 1.51 (2.10) on the first day, 0.80 (2.40) and 0.17 (2.10) on the fifth day, and 0.95 (2.27) and 0.59 (1.47) on the last day, respectively.
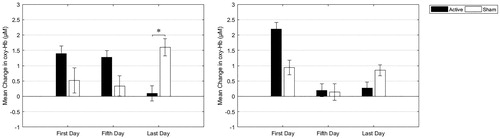
shows the group-averaged oxy-Hb changes in the left and right fNIRS channel. An LME model showed no main effect of group (left: F = 0.39, p = .539, right: F = 0.00, p = .994), a main effect of day in the right (F = 3.21, p = .048) but not in the left (F = 0.03, p = .968) channel, and a significant group x day interaction in the left channel (F = 7.37, p = .002), but not in the right (F = 1.54, p = .224), reflecting different trajectories in oxy-Hb change during the treatment course. Specifically, pairwise comparisons between groups showed a difference between the treatment groups on the last day in the left channel (left: F = 5.64, p = .024, right: F = 1.36, p = .253), with the active iTBS group having unchanged oxy-Hb levels after compared to before iTBS session. No significant group differences in oxy-Hb change were seen on the first (left: F = 0.80, p = .376, right: F = 2.91, p = .095) or fifth treatment day (left: F = 2.35, p = .132, right: F = 0.60, p = .808).
Figure 4. Means and standard error of the means of oxy-Hb changes at the first, fifth, and last treatment day in the active and sham treatment group in the left and right channel. Positive values reflect an increase in oxy-Hb levels after the iTBS session, while zero reflects unchanged oxy-Hb levels.
There was no main effect of symptom change (left: F = 0.52, p = .474, right: F = 0.00, p = .994) and no significant group x day x symptom change interaction (left: F = 0.74, p = .596, right: F = 0.77, p = .575).
Subanalyses of the whole sample with age as covariate did not yield a main effect of age (left: F = 0.91, p = .345, right: F = 0.80, p = .377), and no age x day interaction (left: F = 0.77, p = .469, right F = 0.07, p = .932).
Discussion
To the best of our knowledge, this study is the first to describe how prefrontal brain activity is modulated over the course of dorsomedial iTBS treatment as captured with fNIRS. Here, we found a cumulative treatment effect in the prefrontal blood oxygenation response related to TMS. In the event-related analysis, we observed higher oxy-Hb levels in active iTBS compared to sham iTBS on the fifth and last treatment day. While oxy-Hb levels increased during the treatment course, there was no such change in sham iTBS. In the resting-state analysis, we observed a suppressed left prefrontal oxy-Hb change in active iTBS compared to sham iTBS on the last treatment day, i.e. no change between pre and post active iTBS oxy-Hb levels.
Taken together, our results point to a cumulative response to active iTBS: there was no event-related blood oxygenation response during stimulation but an increase after the session in resting oxy-Hb levels on the first day. In contrast, on the last day there was an event-related blood oxygenation response during stimulation but unchanged resting oxy-Hb levels after the session. This signal flip seems to start occurring half-way through the treatment course, i.e. on day five. On this day, there was already an event-related blood oxygenation response during stimulation, while resting oxy-Hb levels after the iTBS session were either still increased (in the left channel) or already remained unchanged (in the right channel).
This temporal pattern might reflect a compensatory mechanism of autonomic control over the prefrontal haemoglobin levels due to the TMS treatment. Low and high frequency rTMS have been shown to change cerebral vasomotor activity (Vernieri et al. Citation2009, Citation2014). This might even be the case in iTBS (Pichiorri et al. Citation2012), whereas the direction of this effect warrants future research. Alternatively, the suppressed resting-state oxy-Hb response might be the consequence of an achieved maximum of vascular response expressed as increased baseline levels, leading to a ceiling effect and thus suggesting increased PFC functioning following treatment. This suppression may reflect an inhibitory effect being built up during cumulative sessions, which is in line with earlier observations of increased gammaamino-butyric acid (GABA) in mPFC following rTMS (Dubin et al. Citation2016). As high GABA levels have been associated with a decrease in the blood oxygenation level dependent (BOLD) response in the ACC in an fMRI study (Northoff et al. Citation2007), a similar process could have been observed in our resting-state fNIRS data.
In contrast to the signal changes in the active group, the prefrontal event-related oxygenation changes in the sham group show a different pattern, without any significant prefrontal oxy-Hb increase during sham iTBS over the whole treatment course, thus showing virtually no deflection from baseline in their blood oxygenation response. The oxy-Hb differences between groups might reflect distinct underlying prefrontal mechanisms that occur in response to active or sham iTBS.
Neither event-related nor resting prefrontal oxygenation changes correlated with MADRS-S symptom reduction. To date, there has been only one clinical study combining fNIRS and rTMS on patients with depression conducted by Shinba et al., showing that increased prefrontal oxy-Hb levels during TMS at the last day of treatment were linked to a larger reduction of depressive symptoms (Shinba et al. Citation2018). One explanation why we did not see such a correlation could be large variance in overall treatment response as measured by symptom change. Furthermore, Shinba and colleagues did not conduct a sham-controlled study which might account for differences in treatment response. In addition, the studies differ both regarding the exact rTMS protocol used as well as treatment target, which further compromises comparisons. The overall absence of a significant effect on self-rated depressive symptoms considering our design with an accelerated protocol might contradict earlier open label studies in which twice daily rTMS was associated with fast response to treatment (McGirr et al. Citation2015). However, recent evidence from controlled trials has not been able to support the early notions of a faster response with accelerated protocols (Kaster et al. Citation2020).
Of the few previous studies that combined rTMS and fNIRS, almost all were conducted on healthy participants, which cannot be directly compared with clinical trials with depression patients. Healthy participants commonly receive only short rTMS trains on one occasion, whereas patients undergo a full treatment course over several weeks. High-frequency protocols applied only once on healthy controls appeared to be linked to an increase in oxy-Hb, after 2 Hz, 5 Hz (Cao et al. Citation2013), and 15 Hz rTMS (Curtin et al. 2017). However the only study exploring iTBS effects over the left dlPFC with the use of fNIRS did not reveal significant oxy-Hb changes after a short iTBS train compared to sham rTMS (Curtin et al. 2017). We obtained similar results on the first treatment day, where event-related active iTBS over dmPFC did not yield a significant left or right prefrontal oxy-Hb increase compared to sham iTBS.
While the cumulative event-related oxy-Hb changes occurred in both the left and right PFC, the resting-state oxy-Hb changes were only present in the left PFC, but not in the right. This lateralisation difference might be a result of prefrontal metabolic imbalances, as has been suggested by PET (Videbech Citation2000) and fMRI studies (Grimm et al. Citation2008), and this imbalance can potentially be reversed following rTMS (Li et al. Citation2010). When analysing the whole sample to explore possible age effects, we could observe an age x day interaction in the event-related data that might represent an effect of the cumulative haemodynamic response to rTMS. This is interesting in the light of a reported decreasing clinical rTMS effect with increasing age (Rostami et al. Citation2017).
This study is subject to some limitations. First, the sample size is modest. However, to maximise generalizability of the reported results, we included both patients with unipolar and bipolar depression, and tried to keep the exclusion criteria to a minimum. Second, a general shortcoming of fNIRS is measuring blood oxygenation change in shallow cortical regions (Okada and Delpy Citation2003). In this study the fNIRS signal was measured with a two channels device located adjacent to but not directly under the iTBS area. However, several other fNIRS/rTMS studies did not positioned their fNIRS optodes under the TMS coil (Aoyama et al. Citation2009; Cao et al. Citation2013; Shinba et al. Citation2018). An fNIRS system with more optodes might have given a more detailed picture of blood oxygenation changes of the whole prefrontal region, including even cortical areas directly under the TMS coil. Third, we cannot exclude slightly different positioning of the fNIRS optodes during consecutive treatment days resulting in changes in optical properties under investigation (Sawosz et al. Citation2016) as well as other physiological artefacts that could affect measurements (Kirilina et al. Citation2012). Furthermore, while having systematically recorded medications, we do not have data on cardiovascular morbidity or migraine if not pharmaceutically treated. Thus, vascular morbidity or vasoactive medication taken by the patients might have affected vascular brain responses, but probably only to a small degree as our study sample was rather young and very few used vasoactive medication. Finally, we cannot be fully sure that the sham iTBS did not give any stimulation at all as treatment with prefrontal TENS electrodes applying a similar current strength as in the present study has been linked to depressive symptom reduction (Cook et al. Citation2013), an assumption that has also been proposed by a recent rTMS study (Dunlop et al. Citation2020).
In conclusion, our study describes a modulation of the blood oxygenation response over the prefrontal cortex that is built up during the course of the iTBS treatment.
Statement of interest
None to declare.
Supplementary Figure S2
Download MS Word (280.3 KB)Supplementary Figure S1
Download MS Word (189.1 KB)Acknowledgments
We thank MagVenture for lending the sham coil.
Additional information
Funding
References
- Aoyama Y, Hanaoka N, Kameyama M, Suda M, Sato T, Song M, Fukuda M, Mikuni M. 2009. Stimulus intensity dependence of cerebral blood volume changes in left frontal lobe by low-frequency rTMS to right frontal lobe: a near-infrared spectroscopy study. Neurosci Res. 63(1):47–51.
- Bakker N, Shahab S, Giacobbe P, Blumberger DM, Daskalakis ZJ, Kennedy SH, Downar J. 2015. RTMS of the dorsomedial prefrontal cortex for major depression: safety, tolerability, effectiveness, and outcome predictors for 10 Hz versus intermittent theta-burst stimulation. Brain Stimul. 8(2):208–215.
- Blumberger DM, Vila-Rodriguez F, Thorpe KE, Feffer K, Noda Y, Giacobbe P, Knyahnytska Y, Kennedy SH, Lam RW, Daskalakis ZJ, et al. 2018. Effectiveness of theta burst versus high-frequency repetitive transcranial magnetic stimulation in patients with depression (THREE-D): a randomised non-inferiority trial. Lancet. 391(10131):1683–1692.
- Cao TT, Thomson RH, Bailey NW, Rogasch NC, Segrave RA, Maller JJ, Daskalakis ZJ, Fitzgerald PB. 2013. A near infra-red study of blood oxygenation changes resulting from high and low frequency repetitive transcranial magnetic stimulation. Brain Stimul. 6(6):922–924.
- Cook IA, Schrader LM, DeGiorgio CM, Miller PR, Maremont ER, Leuchter AF. 2013. Trigeminal nerve stimulation in major depressive disorder: acute outcomes in an open pilot study. Epilepsy Behav. 28(2):221–226.
- Curtin A, Sun J, Ayaz H, Qian Z, Onaral B, Wang J, Tong S. 2017. Evaluation of evoked responses to pulse-matched high frequency and intermittent theta burst transcranial magnetic stimulation using simultaneous functional near-infrared spectroscopy. Neurophoton. 4(04):1.
- Curtin A, Tong S, Sun J, Wang J, Onaral B, Ayaz H. 2019. A systematic review of integrated functional near-infrared spectroscopy (fNIRS) and transcranial magnetic stimulation (TMS) studies. Front Neurosci. 13:84.
- Downar J, Daskalakis ZJ. 2013. New targets for rTMS in depression: a review of convergent evidence. Brain Stimul. 6(3):231–240.
- Dubin MJ, Mao X, Banerjee S, Goodman Z, Lapidus KAB, Kang G, Liston C, Shungu DC. 2016. Elevated prefrontal cortex GABA in patients with major depressive disorder after TMS treatment measured with proton magnetic resonance spectroscopy. J Psychiatry Neurosci. 41(3):E37–E45.
- Dunlop K, Sheen J, Schulze L, Fettes P, Mansouri F, Feffer K, Blumberger DM, Daskalakis ZJ, Kennedy SH, Giacobbe P, et al. 2020. Dorsomedial prefrontal cortex repetitive transcranial magnetic stimulation for treatment-refractory major depressive disorder: a three-arm, blinded, randomized controlled trial. Brain Stimul. 13(2):337–340.
- Duprat R, Desmyter S, Rudi DR, Van Heeringen K, Van Den Abbeele D, Tandt H, Bakic J, Pourtois G, Dedoncker J, Vervaet M, et al. 2016. Accelerated intermittent theta burst stimulation treatment in medication-resistant major depression: a fast road to remission? J Affect Disord. 200:6–14.
- Gratton E, Fantini S, Franceschini MA, Gratton G, Fabiani M. 1997. Measurements of scattering and absorption changes in muscle and brain. Philos Trans R Soc Lond, B, Biol Sci. 352(1354):727–735.
- Grimm S, Beck J, Schuepbach D, Hell D, Boesiger P, Bermpohl F, Niehaus L, Boeker H, Northoff G. 2008. Imbalance between left and right dorsolateral prefrontal cortex in major depression is linked to negative emotional judgment: an fMRI study in severe major depressive disorder. Biol Psychiatry. 63(4):369–376.
- Hanaoka N, Aoyama Y, Kameyama M, Fukuda M, Mikuni M. 2007. Deactivation and activation of left frontal lobe during and after low-frequency repetitive transcranial magnetic stimulation over right prefrontal cortex: a near-infrared spectroscopy study. Neurosci Lett. 414(2):99–104.
- Hoogendam JM, Ramakers GMJ, Di Lazzaro V. 2010. Physiology of repetitive transcranial magnetic stimulation of the human brain. Brain Stimul. 3(2):95–118.
- Huang YZ, Edwards MJ, Rounis E, Bhatia KP, Rothwell JC. 2005. Theta burst stimulation of the human motor cortex. Neuron. 45(2):201–206.
- Kaster TS, Chen L, Daskalakis ZJ, Hoy KE, Blumberger DM, Fitzgerald PB. 2020. Depressive symptom trajectories associated with standard and accelerated rTMS. Brain Stimul. 13(3):850–857.
- Kirilina E, Jelzow A, Heine A, Niessing M, Wabnitz H, Brühl R, Ittermann B, Jacobs AM, Tachtsidis I. 2012. The physiological origin of task-evoked systemic artefacts in functional near infrared spectroscopy. Neuroimage. 61(1):70–81.
- Koenigs M, Huey ED, Calamia M, Raymont V, Tranel D, Grafman J. 2008. Distinct regions of prefrontal cortex mediate resistance and vulnerability to depression. J Neurosci. 28(47):12341–12348.
- Kozel FA, Tian F, Dhamne S, Croarkin PE, McClintock SM, Elliott A, Mapes KS, Husain MM, Liu H. 2009. Using simultaneous repetitive Transcranial Magnetic Stimulation/functional Near Infrared Spectroscopy (rTMS/fNIRS) to measure brain activation and connectivity. Neuroimage. 47(4):1177–1184.
- Li CT, Wang SJ, Hirvonen J, Hsieh JC, Bai YM, Hong CJ, Liou YJ, Su TP. 2010. Antidepressant mechanism of add-on repetitive transcranial magnetic stimulation in medication-resistant depression using cerebral glucose metabolism. J Affect Disord. 127(1–3):219–229.
- McCabe C, Mishor Z, Filippini N, Cowen PJ, Taylor MJ, Harmer CJ. 2011. SSRI administration reduces resting state functional connectivity in dorso-medial prefrontal cortex. Mol Psychiatry. 16(6):592–594.
- McGirr A, Van Den Eynde F, Tovar-Perdomo S, Fleck MPA, Berlim MT. 2015. Effectiveness and acceptability of accelerated repetitive transcranial magnetic stimulation (rTMS) for treatment-resistant major depressive disorder: an open label trial. J Affect Disord. 173:216–220.
- Mir-Moghtadaei A, Giacobbe P, Daskalakis ZJ, Blumberger DM, Downar J. 2016. Validation of a 25% nasion-inion heuristic for locating the dorsomedial prefrontal cortex for repetitive transcranial magnetic stimulation. Brain Stimul. 9(5):793–795.
- Mochizuki H, Furubayashi T, Hanajima R, Terao Y, Mizuno Y, Okabe S, Ugawa Y. 2007. Hemoglobin concentration changes in the contralateral hemisphere during and after theta burst stimulation of the human sensorimotor cortices. Exp Brain Res. 180(4):667–675.
- Montgomery A, Asberg M. 1979. A new depression scale designed to be sensitive to change. Br J Psychiatry. 134:382–389.
- Northoff G, Walter M, Schulte RF, Beck J, Dydak U, Henning A, Boeker H, Grimm S, Boesiger P. 2007. GABA concentrations in the human anterior cingulate cortex predict negative BOLD responses in fMRI. Nat Neurosci. 10(12):1515–1517.
- O’Reardon JP, Solvason HB, Janicak PG, Sampson S, Isenberg KE, Nahas Z, McDonald WM, Avery D, Fitzgerald PB, Loo C, et al. 2007. Efficacy and safety of transcranial magnetic stimulation in the acute treatment of major depression: a multisite randomized controlled trial. Biol Psychiatry. 62(11):1208–1216.
- Okada E, Delpy DT. 2003. Near-infrared light propagation in an adult head model II Effect of superficial tissue thickness on the sensitivity of the near-infrared spectroscopy signal. Appl Opt. 42(16):2915–2922.
- Philip NS, Barredo J, Aiken E, Carpenter LL. 2018. Neuroimaging mechanisms of therapeutic transcranial magnetic stimulation for major depressive disorder. Biol Psychiatry Cogn Neurosci Neuroimaging. 3(3):211–222.
- Pichiorri F, Vicenzini E, Gilio F, Giacomelli E, Frasca V, Cambieri C, Ceccanti M, Di Piero V, Inghilleri M. 2012. Effects of intermittent theta burst stimulation on cerebral blood flow and cerebral vasomotor reactivity. J Ultrasound Med. 31(8):1159–1167.
- Rostami R, Kazemi R, Nitsche MA, Gholipour F, Salehinejad MA. 2017. Clinical and demographic predictors of response to rTMS treatment in unipolar and bipolar depressive disorders. Clin Neurophysiol. 128(10):1961–1970.
- Salomons TV, Dunlop K, Kennedy SH, Flint A, Geraci J, Giacobbe P, Downar J. 2014. Resting-state cortico-thalamic-striatal connectivity predicts response to dorsomedial prefrontal rTMS in major depressive disorder. Neuropsychopharmacology. 39(2):488–498.
- Sawosz P, Wojtkiewicz S, Kacprzak M, Weigl W, Borowska-Solonynko A, Krajewski P, Bejm K, Milej D, Ciszek B, Maniewski R, et al. 2016. Human skull translucency: post mortem studies. Biomed Opt Express. 7(12):5010–5020.
- Sheehan DV, Lecrubier Y, Sheehan KH, Amorim P, Janavs J, Weiller E, Hergueta T, Baker R, Dunbar G. 1998. The Mini-International Neuropsychiatric Interview (M.I.N.I): the development and validation of a structured diagnostic psychiatric interview for DSM-IV and ICD-10. J Clin Psychiatry. 59:22–33.
- Sheline YI, Price JL, Yan Z, Mintun MA. 2010. Resting-state functional MRI in depression unmasks increased connectivity between networks via the dorsal nexus. Proc Natl Acad Sci Usa. 107(24):11020–11025.
- Shinba T, Kariya N, Matsuda S, Matsuda H, Obara Y. 2018. Increase of frontal cerebral blood volume during transcranial magnetic stimulation in depression is related to treatment effectiveness: a pilot study with near-infrared spectroscopy. Psychiatry Clin Neurosci. 72(8):602–610.
- Tak S, Kempny AM, Friston KJ, Leff AP, Penny WD. 2015. Dynamic causal modelling for functional near-infrared spectroscopy. Neuroimage. 111:338–349.
- Tik M, Hoffmann A, Sladky R, Tomova L, Hummer A, Navarro de Lara L, Bukowski H, Pripfl J, Biswal B, Lamm C, et al. 2017. Towards understanding rTMS mechanism of action: stimulation of the DLPFC causes network-specific increase in functional connectivity. Neuroimage. 162:289–296.
- Tse NY, Goldsworthy MR, Ridding MC, Coxon JP, Fitzgerald PB, Fornito A, Rogasch NC. 2018. The effect of stimulation interval on plasticity following repeated blocks of intermittent theta burst stimulation. Sci Rep. 8(1):8526.
- Tupak SV, Dresler T, Badewien M, Hahn T, Ernst LH, Herrmann MJ, Deckert J, Ehlis AC, Fallgatter AJ. 2013. Inhibitory transcranial magnetic theta burst stimulation attenuates prefrontal cortex oxygenation. Hum Brain Mapp. 34(1):150–157.
- Vernieri F, Altamura C, Palazzo P, Altavilla R, Fabrizio E, Fini R, Melgari JM, Paolucci M, Pasqualetti P, Maggio P. 2014. 1-Hz repetitive transcranial magnetic stimulation increases cerebral vasomotor reactivity: a possible autonomic nervous system modulation. Brain Stimul. 7(2):281–286.
- Vernieri F, Maggio P, Tibuzzi F, Filippi MM, Pasqualetti P, Melgari JM, Altamura C, Palazzo P, Di Giorgio M, Rossini PM. 2009. High frequency repetitive transcranial magnetic stimulation decreases cerebral vasomotor reactivity. Clin Neurophysiol. 120(6):1188–1194.
- Videbech P. 2000. PET measurements of brain glucose metabolism and blood flow in major depressive disorder: a critical review. Acta Psychiatr Scand. 101(1):11–20.