
Abstract
Variation in rates of sanitary hygiene products, toilet tissue and faeces occurring in sewers are presented for dry and wet weather from three steep upstream urban catchments with different economic, age and ethnic profiles. Results show, for example, that total daily solids per capita from the low income and ageing populations are almost twice that from high income or ethnic populations. Relative differences are verified through independent questionnaires. The relationship between solids stored in sewers prior to storms, antecedent dry weather period and the proportion of roof to total catchment area is quantified. A full solids’ flush occurs when storm flows exceed three times the peak dry weather flow. The data presented will assist urban drainage designers in managing pollution caused by the discharge of sewage solids.
1. Introduction
In many municipal areas of the UK, stormwater and wastewater are commonly conveyed in the same pipe, known as a combined sewer. This arrangement is likely to remain the case for the foreseeable future. Combined sewer overflows (CSOs) are strategically located along the pipe network to prevent hydraulic overloading of both the sewer pipes and the downstream waste water treatment works (WwTWs). However, the presence of these structures can cause pollutants to be discharged to receiving waters in wet weather, with visible aesthetic pollutants such as faecal matter, toilet tissue and sanitary products causing most public complaint (e.g. Blanksby, Citation2002; Williams & Simmons, Citation1999). These pollutants are primarily from WC usage (Butler, Citation1993) and are sometimes referred to as gross solids (generally being defined as greater than 6 mm × 6 mm in any two directions). Pollution from such solids can be controlled at CSOs using screens (WaPUG, Citation2006a) and these have been used extensively since the late 1990s. It is clear that the general specification, selection and design of screens appear to work. However, post project appraisal work indicates a number of these installations fail to perform in the manner originally envisaged due to a combination of design, construction and maintenance reasons (Evans & Eadon, Citation2005). Furthermore, the introduction of CSO screens requires solids to continue downstream through the network to the WwTW. Here inlet screens now receive higher solid loadings and this has led to the need to improve inlet works, upgrading screens and solids handling equipment. One particular concern is where a screen may have to deal with an unusually large quantity and/or particular type of solid. However, there is very little data available to enable a designer to know when such allowances may need to be made, and how to quantify them. Therefore, the focus of the research presented here is to further understanding of the quantity and temporal distribution of these gross solids in combined sewers. In turn this will help improve the design of CSO and storm tank screens, inlet works screens and waste water systems in general (Marples et al., Citation2008; Myerscough & Digman, Citation2008).
The hydraulic design of combined sewers is well established for both dry weather and storm flows, and a number of commercially available software packages are available to assess flows in combined urban drainage networks. Erosion, transport and deposition of fine sediment are also considered in sewer quality models (WaPUG, Citation2006b), but it has been argued that movement of gross solids may be different from the transport of fine suspended solids (Davies et al., Citation1996). Within small diameter sewers, the motion of solids can be intermittent as they are moved by pulses of water (due to WC flushing or rainfall) and then experience stranding until arrival of the next pulse of water (Walski et al., Citation2011). Thus deposition is more likely in upstream reaches (Staufer, Citation2011). This behaviour is also influenced by bed slope (although some authors report no mean daily storage in steep upstream catchments (Barco et al., Citation2008)), the buoyancy of sewage solids and duration of the pulse. The typical diurnal dry weather flow profile will only be observed downstream after convolution of numerous flushing events over the catchment. However, the deposition and entrainment of gross solids in small diameter pipes is still poorly understood and poorly quantified (Littlewood & Butler, Citation2003).
A computational model to simulate the transport of aesthetic solids in large sewers was developed by Butler et al. (Citation2003). To determine the transport velocity of each solid, the spatial and temporal changes in flow velocities and depths are utilised. The latter are determined by a verified sewer flow computational model, which is the initial step in any sewer quality model (WaPUG, Citation2006b). Solid velocity is dependent on solid type and requires that the flow exceeds certain velocity and depth values which are determined using data from laboratory and field experiments (Davies et al., Citation2002; Littlewood & Butler, Citation2003). This has been confirmed by other studies (e.g. McDougall & Wakelin, Citation2007). This approach was developed and extended beyond a single pipe to sewer networks during a collaborative research project between Imperial College, the University of Sheffield and Sheffield Hallam University to predict aesthetic pollutant loadings in sewerage. This more comprehensive model that simulated the movement of gross solids is known as GROSSim.
Hydraulic models often involve simplifications of sewer systems to save development and computational time, but the minimum recommended pipe diameter is 300 mm or 225 mm (WaPUG, Citation2002). Solids’ transport in truncated parts of the network is managed within GROSSim using a non-linear reservoir model (Digman et al., Citation2002) at each node where truncation occurs. Input of solids at each node in GROSSim is in the form of a “solidograph”, where the rate varies with time of day. Data to define this input is not comprehensive. Questionnaire enquiry by Friedler et al. (Citation1996a) quantified the diurnal input rates of faecal material at the WC, together with the influence of gender and age. Flushing rates for toilet tissue has also been determined (Almeida et al., Citation1999; Friedler et al., Citation1996a) but not for other WC derived solids. The influence of socio-economic and ethnic factors on gross-solid production rates has not been widely considered, but previous work has indicated some effect of this on solids’ quantities recovered from sewers (Balmforth & Meeds, Citation1997). Calibration of the GROSSim model requires data on the introduction and movement of gross solids during dry weather flow and storm events, similar to other sewer quality models (FWR, Citation1994). Both flow regimes are important, in particular due to the phenomenon of the first foul flush of pollutants at the beginning of storm flows.
Therefore the aim of this paper is to quantify the transport of six types of gross solids in small catchments during dry weather and storm flows through in-sewer surveys. These are designed to explore any impact of the physical characteristics of the catchments’ and the sewer networks and the socio-economic groupings of the catchments’ population.
2. Study areas and experimental procedure
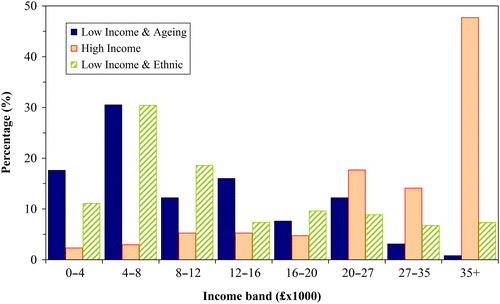
The study was based in the city of Sheffield, UK. It involved collecting data from catchments with different population types. To assist in identifying areas that contained these, a social deprivation map, as shown by Digman (Citation2003), was created using the services of the University of Sheffield's Geography Department. The latter was commissioned to compile 1991 Census socio-economic data into five index values, ranging from high to low income, and create an overlay to an Ordnance Survey map that showed their areal extent. A further map overlay using the work of Amin (Citation1996) identified areas that contained ethnic communities. Discrete, predominantly combined sewer networks were located using Yorkshire Water's sewer asset database. Field evaluation of a number of locations was necessary to review the viability of insertion of in-sewer monitoring equipment at the end of the catchments and to assess health and safety requirements for the survey work. Three distinct catchments were identified consisting of a high income site with a white population, a low income site with an ageing white population and a low income site with 30% Pakistani ethnicity. The 1991 Census data were used to identify population details (Houldsworth, Citation2004), for example, the age and income distributions are shown in Figures and respectively.

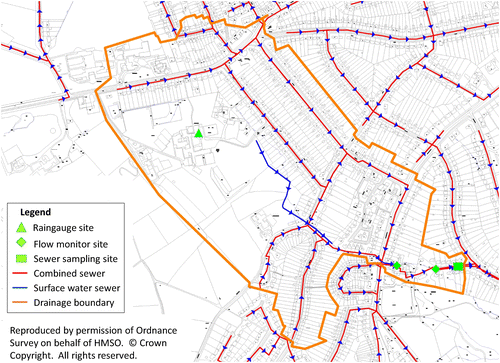
The sewer sampling methodology for collecting aesthetic pollutants during dry and wet weather conditions was developed from previous work (Balmforth et al., Citation1995; Meeds, Citation1995; Milne et al., Citation1996) that involved sampling of aesthetic pollutants in CSOs and large sewers. Flow survey loggers were used to record sewer flow velocity and depth, with rainfall being recorded by 0.2 mm tipping bucket rain gauges (Digman, Citation2003). Poor quality dry weather flow data was occasionally apparent due to low flow depths and high velocities. This was rectified by the creation of a local backwater over the monitor through installation downstream of a relatively small 50 mm high weir with a shallow angled nose to minimise any impact on solids movement. Rain gauges were sited according to the methodology for short term sewer flow surveys (WRc, Citation1987), apart from the total number gauges: only one gauge was sited per catchment due to the lack of suitable, accessible and secure location sites, but each underwent calibration and performance checks on a weekly basis. The high income catchment is shown for illustrative purposes (Figure ).
Due to the configuration of sewer networks, the low income site with an ageing population was split into 4 sub catchments (Table ). The networks for these catchments are shown diagrammatically elsewhere (Digman et al., Citation2001; Digman, Citation2003). The catchments are defined as steep, as the average gradient is greater than 1/50 (FWR, Citation1994). Aesthetic pollutants from the sewer were collected from a manhole at the downstream end of each catchment in dry and wet weather. A steel blanking plate with a central section removed was fixed at the end of the incoming sewer, enabling all the water and solids to be diverted into a mesh sack slotted into the rear of the plate. The sack mesh aperture was 6 mm by 4 mm. The sack was replaced at suitable frequencies, typically 5, 10 or 30 minutes, and occasionally at 1 and 2 minutes depending on the quantity of solids’ in motion. Five to ten seconds were required for each sack change over. Each sack was hung for 30 minutes to allow excess water to drain before the total mass was recorded.
Table 1 Catchment data.
The solids were characterised under laboratory conditions by emptying the sacks and separating the pollutants by type. All sacks were characterised at the high income and ethnic sites, and every 4th sack was characterised at the low income and ageing site. The reduced number at the latter site was implemented for public health reasons, as a large number of sacks would have to be retained from simultaneous storm measurement at all sub catchments. Where possible, each individual pollutant was weighed. Sanitary protection (SANPRO) items and a large proportion of faeces and toilet tissue were easy to identify. A ‘mush’ of faecal material and toilet tissue in approximately equal proportions constituted 30% of the total mass collected. This was caused by collection and retention of solids in the mesh sack, rather than through in-sewer degradation. Therefore half the mush mass was added to the faecal mass and the other half to the toilet tissue mass. The rise or settling velocity of SANPRO items was determined in the laboratory using a 2 m tall, 0.5 m diameter settling cylinder, with the time taken for the pollutants to travel vertically over a 1 m section of water being recorded. Dimensions of the apparatus are greater than other settling velocity devices (e.g. Krishnappan et al., Citation2012), but apposite due to the larger dimensions of gross solids compared to other sewer particulates.
3. Experimental results
3.1 Dry weather mass flow rates
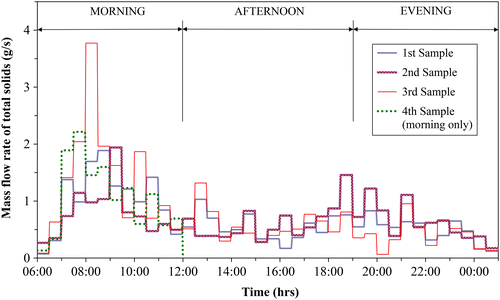
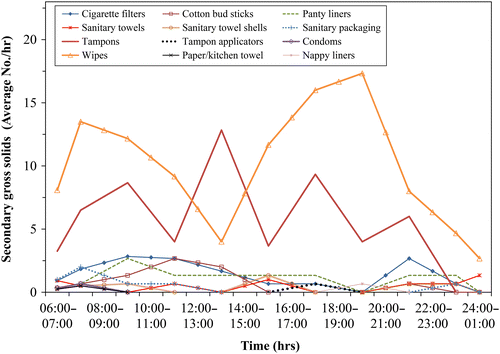
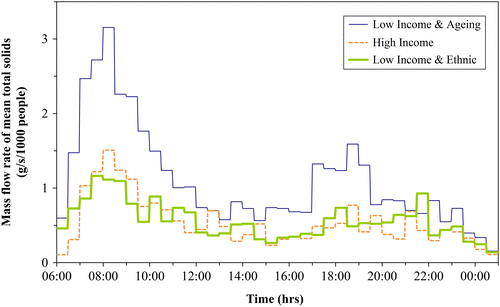
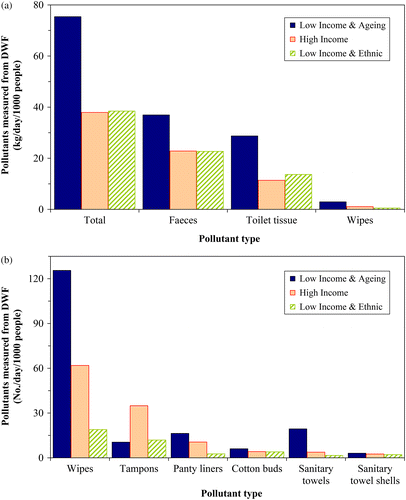
Solid samples and flow data were collected during dry weather at each catchment in separate morning, afternoon and evening periods. The mesh sacks were consistently inserted within the sewer for 30 minutes, with a changeover of sacks taking 4–5 seconds. No blinding and consequent adverse impacts on the fluid flow were observed Figure illustrates total solids’ quantities observed at the high income site. As the in-sewer sampling team was well trained and experienced and the sampling protocol is robust and accurate, the fluctuation apparent in the magnitude of repeated measurements of the solid load at all time periods and at all sites is not a function of sampling error, but is due to the relatively small size of the population in the catchments studied, in comparison to the natural variability of toilet use. Similar fluctuations have been noted from a questionnaire survey of the WC flushing of solids (Freidler et al., Citation1996b). Mean values were calculated for each time increment (Figures and ). In all catchments, bi-modal diurnal patterns are observed for faeces and toilet tissue, which comprise the majority of the total gross solids by mass (Figure ). The diurnal mass flow rate for wipes is also bi-modal, although the afternoon peak is larger than that of the morning (Figure ). The manner of temporal variation of the remaining aesthetic pollutants cannot be discerned due to the low numbers flushed down the WC. When the data are presented per 1000 population (Figure ), it can be seen that at the low income and ageing catchment, the rate of solids at the morning and evening peaks is twice that of the other catchments. The total mass and mass of individual pollutants (apart from tampons) sampled per 1000 people is also larger for the low income and ageing catchment (Figures a and b); the relative quantity of wipes sampled in the low income and ageing area is twice that of the high income area and six times the quantity observed at the low income and ethnic site (Figure b). The higher total mass of the low income and ageing catchment may be caused by 54% of the population being aged 60 years and above; residents may occupy their houses for a greater proportion of a day, as opposed to leaving for the workplace. This potential influence was investigated by sampling on a Sunday between 09:00 and 15:00 hours, assuming that everyone would be equally likely to be at home. The quantity of solids produced on both the Sunday and on a weekday respectively between these times at the low income and ageing catchment was 18.0 and 23.2 g/p, at the high income catchment was 14.1 and 13.1 g/p and at the low income ethnic catchment was 15.9 and 12.1 g/p. The mass of solids per capita is greater at the low income and ageing catchment compared with the other catchments on a weekday and at the week end, although during the latter the difference is not as pronounced.
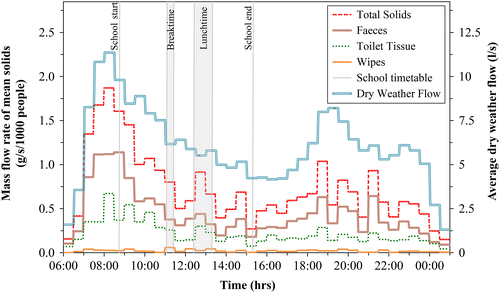
If the catchment contains a school, as occurs at the high income catchment (Figure ), the population may also temporarily increase on weekdays during school terms. There is a residential special school at the top of this catchment for about 100 pupils of 11–16 years of age, 30% of whom may board during the week in term time for one to two nights or more extended stays (Turner & Warwicker, Citation2004). A larger school is sited in the western area of the high income catchment. A 94% attendance is recorded for the 1155 day pupils, which includes 236 sixth formers (Liley, Citation2001). The latter school is used to investigate the impact of a large transient population on the daily dry weather solids, as all dry weather sampling occurred on a school day for this catchment. Faeces and toilet tissue are of most concern, being the primary gross solids. Houldsworth (Citation2004) undertook a questionnaire of SANPRO item usage by a sample of the 11–16 year age group from this school. Unfortunately this was not directed specifically towards disposal habits at school, for example it is likely that wipes are less readily available and bins for SANPRO items more accessible at school compared to home. Additional solids’ input will occur during the school day (setting aside any after school activities) and it is suggested that children will prefer, if possible, to restrict visits to the toilet during break or lunchtime, where a small peak in solids’ mass flow rate is observed (Figure ). However, this is the concentration of the equivalent home toilet use for these people over the time period 08:45–13:20 hrs. It is assumed that school children do not introduce further solids into the combined system after lunch as they would wait until they got home. Preference for school toilet use was studied by Vernon et al. (Citation2003), who reported 62% of boys and 35% of girls at a Newcastle primary school did not defecate at school. Data from a Swedish study of schoolchildren aged 6 to 16 years old (Lundblad & Hellström, Citation2005) identified 12% and 47% of 6–9 year olds, 14% and 70% of 10–12 year olds and 25% and 80% of 13–16 year olds never urinated or defecated respectively at school, and a high number only sometimes did so. These proportions are applied to 11–16 year old age group of pupils attending the school, in the absence of data for sixth formers. Calculation indicates an additional 253 people will defecate into the sewer system. For faeces, the total quantity of solids between 08:45–13:20 hrs is 6.17 kg, determined by numerical integration (Figure ), compared to a daily total of 20.76 kg. When the former mass is reduced to exclude the contribution of the school population, a 5% reduction in faecal solids for the catchment occurs. A similar approach could be adopted for toilet tissue, but the influence of gender on urine only and urine and faeces toilet tissue usage would need to be considered. The relatively minor influence of the transient population despite its large magnitude is supported by the small difference between the weekday and weekend sampling data at the high income catchment.
3.2 Storm mass flow rate and solid storage in dry weather
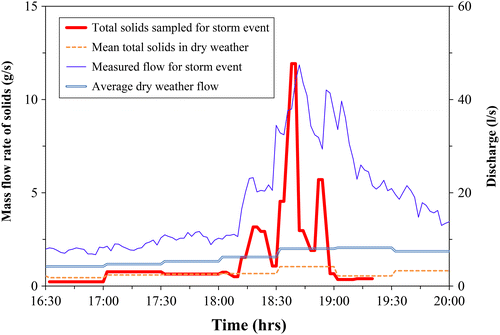
The sampling campaign successfully captured sewer solids during a number of storm events. A first foul flush of solids is observed at the beginning of the storm flow (Figure ). As was performed for all storms, it can be seen that the solids’ sampling staff have responded to the increase solids’ mass flow rate by reducing the collection period for each sack from 30 minutes to 4 minutes, to allow the solids’ flush to be defined much more precisely. Depending on the duration of the storm event, the total flushed mass may be a combination of solids already in motion upstream of the sampling point prior to the storm event, solids introduced via the WC during the storm and be transported to the end of the catchment before its end, and mobilisation of solids stored within the catchment due to the presence of higher water depth and velocities during the storm. The following procedure was used to establish the contribution of these components to the mass of flushed solids.
To determine the mass of solids in a network during dry weather flow, a hydraulic model of that sewer network is required, and was constructed here using InfoWorksTM. Data on pipe and manhole characteristics such as location, invert levels and diameters were obtained from Yorkshire Water's asset database. The surface roughness of pipes was based on their material type, condition established through visual inspection at manholes surveys and reference to the Sewerage Rehabilitation Manual (WRc, Citation2001). The code of practice for the hydraulic modelling of sewer systems (WaPUG, Citation2002) was followed to create a detailed ‘type III’ model. There was no pruning or merging of the public sewer network, with computational nodes being assigned to all public manholes. Missing data was addressed through additional field survey work. Rainfall data to drive model storm flows was obtained from measured rainfall. Catchment and sub-catchment boundaries were defined using industry standard guidelines (WaPUG, Citation2002), with permeable and impermeable roof, pavement and road areas being surveyed and measured from digital OS background maps using AutoCADTM. The infiltration component was identified from in-sewer flow monitoring during dry weather and treated as a separate model input. Knowledge of seasonal variations was not necessary as infiltration rates did not vary significantly during the survey period. As the catchments are steep, the absence of persistent sediment depths was assumed. Soil infiltration potential from the Wallingford Procedure (DoE/NWC, Citation1981) was used with the standard runoff model. Permeable and impermeable areas were assigned to each node based on their spatial distribution. The population obtained from Census data (Table ) was evenly distributed over the residential properties counted in each sewer catchment or sub-catchment, with the number of properties within each nodal area being used to establish each nodal population P. Calibration and verification were performed to industry standard guidelines (WaPUG, Citation2002), with graphical examples (Figures a and b) illustrating the verification process for both dry and wet weather. The mass of dry weather solids per capita, dws, at any time and for any solid type is derived from field data (e.g. Figure ). The dry weather mass flowing in the network, mdw, from an individual node to the downstream point being considered at a particular time of day is therefore given by
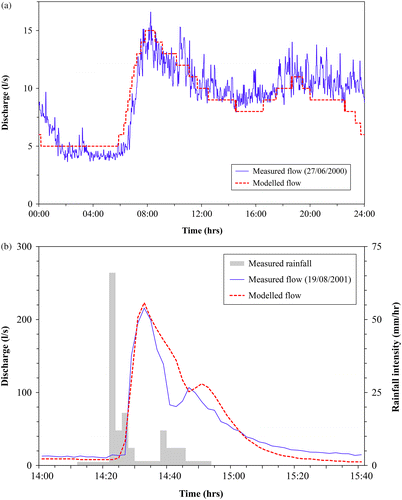
Table 2 Storm details.
The remaining data were analysed further to explore whether an improvement in correlation could be achieved. Differences between catchments for dry weather solids per 1000 population have already been established (Figure ). It is proposed that the rate at which solids are stored increases with the rate at which solids are flushed into the sewer. This influence is accounted for by dividing the mass stored prior to the storm event, Ms, by the mass entering a catchment per day, M24. The latter is primarily composed of the daily dry weather mass, Mdw24, that is obtained from numerical integration of the diurnal dry weather solids in motion (e.g. Figures and ), but also includes the mass of solids stored daily (Ms24) within the system, as given by Equation 5, where the subscript solid refers to any particular solid e.g. tampon, faeces or the total amount of solids:
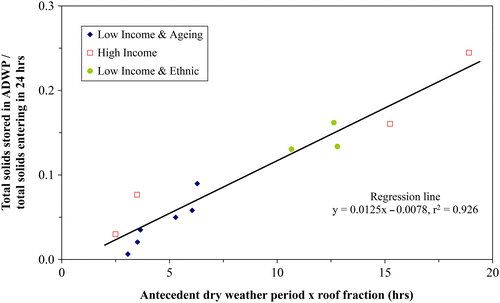
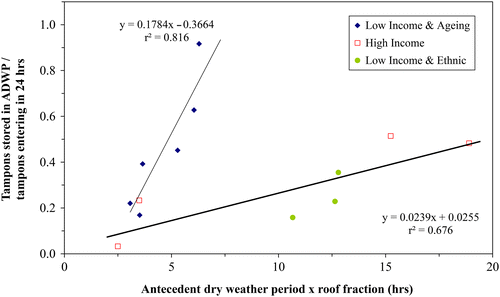
Data from the different sub-catchments in the low income and ageing catchment demonstrate that the mass stored varies for the same storm event. This indicates that physical characteristics of each sub-catchment influence solids storage. Consideration of the potential impact of a number of different variables on the rate of solids’ storage such as shear velocity (via the inverse of the square root of the average sewer gradient), the population density and the fraction of impermeable area in the catchment was explored using linear regression (Digman, Citation2003). The largest co-efficient of correlation was obtained for the variation of non-dimensionalised stored mass of solids with ADWP and roof fraction R (Figure ), where the latter is defined as the roof area divided by the total contributing area (Table ). For example the correlation co-efficient, r2, relating to the total mass of stored solids increased to 0.927.
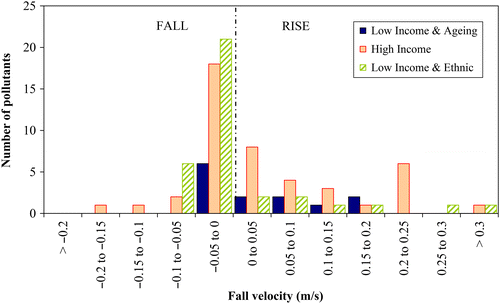
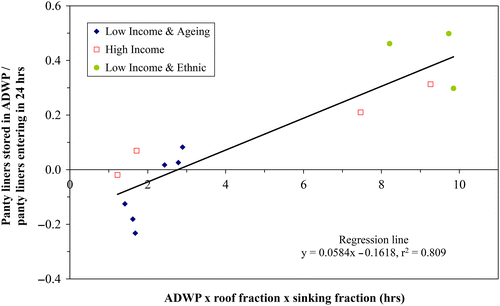
The relationships for gross solids and SANPRO items are shown in Table . The degree of correlation varies and the best results are obtained when the sampled mass or number is high and each mesh sack is characterised. Whilst consideration of the average gradient of the sewers in each catchment did not improve the overall correlation with ADWP, the catchments studied are all relatively steep and flatter catchments may not behave in the same manner. Other factors that were investigated but did not improve the correlation included the total sewer length, main sewer length, pipe diameter and pipe capacity. The results show that faeces and toilet tissue are stored at similar rates, but other solid types are stored at higher rates, for example panty liners are stored over five times faster than faeces. Faeces will be the largest component of the stored mass as a greater quantity is flushed daily (Figure a). Solids that sank during the rising/settling velocity tests were more likely to be deposited on the sewer bed during dry weather. However, this is not the sole influencing factor since all tampons are negatively buoyant with a mean settling velocity of about 0.08 m/s, but higher depositional rates are recorded for wipes that have a lower mean settling velocity of around 0.03 m/s. A poor initial correlation for panty liners was attributed to the different product types in use as considerable variability in the settling/rise tests was observed (Figure ). Improved correlation was obtained when the product of ADWP and roof fraction R was multiplied by USINK, the fraction of negatively buoyant panty liners (Figure ). Incorporation of this factor for other SANPRO items was unnecessary as there was minimal variability between catchments. Tampons from the Low Income and Ageing catchment are stored over seven times more rapidly compared to the other catchments (Figure ). The reason for this is not readily apparent.
Table 3 Pollutant storage rates.
For all solids’ types, there may be an upper limit to the linear variation with ADWP, i.e. the storage capacity of sewers may be reached, but this point was not apparent from the data collected here. Whilst the usual form of linear regression equations of y = mx+c is applied, practical use of these expressions especially for small antecedent dry weather periods may be better served by setting the intercept to zero, thereby always ensuring positive stored masses (Table ). Using these relationships, evaluation of the stored mass of any solid is described by
3.3 Standard Production Values and Social, Economic and Ethnic Day factors
In order to facilitate comparisons between catchments, for each solid a Standard Production Value, SPV, is devised and defined as the mass entering per person per day. This can be evaluated from
Table 4 Standard production values.
An average usage value of 0.12 toilet rolls per person per day value for toilet tissue usage was obtained from a combination of market research data, toilet tissue manufacturers’ data and retail sales data (Houldsworth, Citation2004), with additional laboratory tests being conducted on samples of the different types of toilet tissue that are available in the UK to allow conversion to a dry mass of 16.1 g/p/day (which is similar to 19.4 g/p/day previously reported by Friedler et al. (Citation1996a)) and a wet mass of 147 g/p/day (Table ). Houldsworth's (Citation2004) questionnaire data relating to toilet tissue usage by different socio-economic groups did not contain enough responses for separate analysis. Sewer derived faecal production rates can be established from UK medical literature (e.g. Tomlin & Read, Citation1988; Feachem et al., Citation1983) which show that UK mean faecal weights from various groups of people range from 104 to 190 g/p/day, with an overall mean of approximately 153 g/p/day. This is much greater than the average quantity of 34.2 g/day measured from sewer sampling. Similarly, the toilet tissue mass from sewer sampling is also smaller (Table ). This difference may be caused by a number of reasons; for example, a reduction in the rate of faecal material and toilet tissue quantified by field survey may be attributed in part to mesh size of the collecting sack and degradation of the solids within a sewer network. This has been observed elsewhere in laboratory experiments (Eren & Karadagli, Citation2012) and in sewers, where a change in the relative composition of solids with distance travelled along the larger sewer network occurs; at the top it is mainly faecal material and toilet tissue, whereas at the bottom of the catchment these have disintegrated and plastic and sanitary products dominate (Evans & Eadon, Citation2005).
To highlight the difference that social class and ethnicity make to the number and type of solids that are input into the sewer system, a Social, Economic and Ethnic Day factor (SEED) for each catchment and solid is devised, where
Table 5 Social, economic and ethnic day factors for each catchment.
The influence of age differences between the catchments can be explored by considering domestic WC usage patterns identified by Friedler et al., (Citation1996b): the number of faecal and faecal+urine flushes per person per day is combined for each of the pre-school (0–4 years; 0.66 f/c/d), school (5–18 years; 0.82 flushes/p/day), working (19–64 years; 1.01 flushes/p/day) and retired (65+years; 1.50 flushes/p/day) population groups. This is applied to the populations groups observed in both the low income and ageing catchment and the high income catchments (Figure ), as far as practicable, i.e. the pre-school factor is applied to the 0–9 year group, the working population factor is applied to the 18–59 year group and the retired population begins at 60+years. A catchment average value for faecal related flushes in the low income and ageing catchment is evaluated as 1.24 flushes/p/day, whilst a value for the high income catchment and the low income and ethnic catchment is 1.03 and 0.98 flushes/p/day respectively. The ratio of faecal related flushes for the high income catchment to the low income and ethnic catchment (1.05) is close to a similar ratio of faecal production values (1.02) from the sewer survey (Table ). This suggests that income and ethnicity are less important than the age profile of the catchment. However, comparison of the ratio for the low income and ageing catchment to the high income catchment and the ratio for the low income and ageing catchment to the low income and ethnic catchment (1.21 and 1.27 respectively) against sewer survey faecal production values (1.61 and 1.57) indicates that only considering age may underestimate solid production quantities. Faecal flushing rates for the older age groups may have been underestimated by Friedler et al. (Citation1996b), or if the age related flushing is correct, a low income bracket increases faecal production rates whilst some ethnicity reduces it.
A useful consequence of the sewer survey corresponding closely to the questionnaire is that the latter might be employed to assist in the design process. For example, when investigating a screen where heavy loads of particular solids’ occur, the influence of socio-economic differences on solids’ production beyond those presented here may be successfully established via questionnaire, a less expensive form of survey than in-sewer monitoring. However, these magnitudes should be reduced using the ratio of sewer to questionnaire data presented in Table if the quantities likely to be transported and stored within upstream sewers are required.
4. Practical applications
There are some valuable practical benefits that have arisen from this research, principally because it has allowed the diurnal input of important gross solids and their rates of storage in dry weather in upstream combined sewers to be quantified. This has been integral to the development of and the input data requirements for the computational model GROSSim (Digman et al., Citation2002). This model for the first time can estimate the gross solids loading in combined sewer networks during dry and wet weather, with deposition and re-entrainment being important aspects.
This GROSSim model allows fuller consideration of the unique characteristics and behaviour of individual catchments. It can identify why some CSO screens in a network fail and others do not. The anecdotal evidence that WwTWs’ wet weather screen loadings have increased following the introduction upstream of CSO screens can be substantiated (Myerscough & Digman, Citation2008). Detailed understanding may help to ensure appropriate future investments of new screens and solids handling equipment, particularly during the 2015–2020 asset management investment period (AMP6) for UK Water and Sewerage Companies, which allows for the enhancement of numerous inlet works and screens. The opportunity also exists to update design procedures, such as those for blinding factors for inlet screens to WwTWs. The improved knowledge of the temporal variation and magnitude of solids’ flushes may also inform the design process in other ways. For example, the control of solids within a network may be explored; demonstrating the capture of solids’ flushes in a storage tank may confirm smaller screen loadings at an associated CSO, resulting in more appropriate and perhaps cost efficient design solutions (Marples et al., Citation2008).
5. Conclusions
Sewer surveys have been employed successfully to quantify gross solids in dry weather and in storms for low income and ageing, low income and ethnic, and high income catchments that are steep. In dry weather, the daily variation of the primary solids, which are faeces, toilet tissue and wipes, is bimodal. The daily distribution of the secondary gross solids, such as tampons, panty liners, cotton buds, sanitary towels is less clear due to the smaller number flushed. Considering data per 1000 people allows the influence of socio-economic and age differences between catchments to be seen clearly: a greater number of primary gross solids are measured in the low income and ageing catchment.
Comparison of sewer solids’ masses captured during storms and in dry weather flows indicates storage in the antecedent dry weather period. Rates of mass storage for all solids have been established for the different steep catchments sampled. The total deposited mass increases with length of the ADWP, roof fraction and population size, and is a function of population type in the catchment. A further variation is observed for panty liners where the product type clearly affects the rate at which solids are deposited; those that are negatively buoyant are more likely to be stored within a sewer.
The mass of each solid flushed daily per person is established from dry weather flow and storage and compared to questionnaire survey of the same catchments. The low income and ageing catchment solid production is higher for all solids apart from tampons. The magnitude of the daily mass of sanitary protection items is smaller than that identified by the questionnaire. The large difference between the values from sewer sampling and those reported in literature for faeces and toilet tissue might be attributed to in-sewer degradation. Strong agreement between the results obtained from the two survey methods occurs when comparing the relative difference between production rates of each solid using a Social Ethnic and Economic Day factor. This highlights the impact of socio-economic differences between catchments, which might be established using less expensive questionnaires.
A full flush of solids in motion and stored solids in storm conditions has been quantified and occurs when the discharge reaches three times the dry weather flow. The mass of solids from a sewer catchment can be therefore estimated from the data presented here for dry weather flows and for storms with up to five days of antecedent dry weather. Large quantities of solids can be flushed at high rates from small upstream catchments in wet weather. This may affect the performance of CSOs and the ability of screens to prevent solids being discharged if not adequately considered. The results may be useful in understanding solid loads presented to CSO screens and also the consequential effects of solids’ retention in the network on downstream sewer structures such as pumping stations and WwTWs.
Acknowledgements
The technical support from Sheffield Hallam University during the field studies and discussions with David Butler, John Davies, Kim Littlewood and Manfred Schütze during collaborative meetings are gratefully acknowledged.
Disclosure statement
No potential conflict of interest was reported by the authors.
Additional information
Funding
Notes
1. Current address: MWH, Buckingham Court, Kingsmead Business Park, London Road, High Wycombe, UK.
References
- Amin, N.U., 1996. Use and management of public open spaces with particular reference to the Pakistani community in Sheffield, Thesis (PhD). University of Sheffield, UK.
- Almeida, M.C., Butler, D., and Freidler, E., 1999. At-source domestic wastewater quality. Urban Water, 1 (1), 49–55.
- Balmforth, D.J., Lonsdale, K., Nussey, B.B., and Walsh, M., 1995. A methodology for monitoring the performance of combined sewer overflows. JCIWEM, 9 (5), 510–518.
- Balmforth, D.J. and Meeds, E.H., 1997. The potential for predicting aesthetic pollutants. WaPUG Autumn Conference, Blackpool.
- Barco, J., Papiri, S., and Stenstrom, M.K., 2008. First flush in a combined sewer system. Chemosphere, 71, 827–833.
- Blanksby, J., 2002. A review of the UK approach to measuring the performance of combined sewer overflows. Urban Water, 4 (2), 191–198.
- Butler, D., 1993. The influence of dwelling occupancy and day of the week on domestic appliance wastewater discharges. Building and Environment, 28 (1), 73–79.
- Butler, D., Davies, J.W., Jefferies, C., and Schütze, M., 2003. Gross solid transport in sewers. Proceedings of the Institution of Civil Engineers. Water and Maritime Engineering, 156 (2), 175–183.
- Davies, J.W., Schluter, W., Jefferies, C., and Butler, D., 2002. Laboratory and field studies to support a model of gross solids transport in sewers. 9th International conference on urban storm drainage, 8-13 September 2002, Portland, OR. ASCE.
- Davies, J.W., Xu, Y., and Butler, D., 1996. Laboratory study and computer model development related to gross solids’ movement in combined sewers. Water Science and Technology, 33 (9), 39–47.
- Digman, C.J., 2003. Aesthetic pollutant loadings in combined sewers, Thesis (PhD). Sheffield Hallam University, UK.
- Digman, C.J., Littlewood, K., Butler, D., Spence, K., Balmforth, D.J., Davies, J., and Schütze, M., 2002. A model to predict the temporal distribution of gross solids loading in combined sewerage systems. 9th International conference on urban storm drainage, 8-13 September 2002, Portland, OR. ASCE.
- Digman, C., Spence, K.J., and Balmforth, D.J., 2001. Aesthetic pollutant loads in small upstream combined sewerage systems. 4th International conference on innovative technologies in urban storm drainage, 25-27 June 2001, Lyon, France. [CD-ROM]. IAHR.
- DoE & NWC, 1981. Design and Analysis of Urban Storm Drainage, The Wallingford Procedure, Volume 2, Program User's Guide, STC Report No 29. DoE.
- Eren, B. and Karadagli, F., 2012. Physical disintegration of toilet papers in wastewater systems: experimental analysis and mathematical modelling. Environmental Science & Technology, 46, 2870–2876.
- Evans, T.D. and Eadon, A.R., eds., 2005. CSO screens - a design and installation review. Workshop 6 July 2005, Cropston. Marlow: FWR. Available from http://www.fwr.org/wapug/csoscrns.pdf.
- Feachem, R.G., Bradley, D.J., Garelick, H., and Mara, D.D., 1983. Sanitation and disease - health aspects of excreta and wastewater management. Chichester, UK: John Wiley & Sons.
- Friedler, E., Brown, D.M., and Butler, D., 1996a. A study of WC derived sewer solids. Water Science and Technology, 33 (9), 17–24.
- Friedler, E., Butler, D., and Brown, D.M., 1996b. Domestic WC usage patterns. Building and Environment, 31 (4), 385–392.
- FWR, 1994. Urban pollution management manual - a planning guide for the management of urban wastewater discharges during wet weather. FR/CL 0002. Marlow, UK: FWR.
- Houldsworth, J.K., 2004. Predicting aesthetic pollutant loadings from combined sewer overflows, Thesis (PhD). University of Sheffield.
- Jefferies, C. and Ashley, R.M., 1994. Gross solids in sewer systems: temporal and catchment based relationships. Water Science & Technology, 30 (1), 63–71.
- Krishnappan, B.G., Exall, K., Marsalek, J., Rochfort, Q., Kydd, S., Baker, M., and Stephen, R.P., 2012. Variability of settling characteristics of solids in dry and wet weather flows in combined sewers: implications for CSO treatment. Water Air Soil Pollution, 223 (6), 3021–3032.
- Liley, R.E., 2001. Inspection report, Silverdale School, Sheffield URN 107128, Inspection 13-15 November 2000. OFSTED Inspection number 223858. Retrieved from http://www.ofsted.gov.uk/inspection-reports/find-inspection-report/provider/ELS/107128 [Accessed 24 Jan 2013].
- Littlewood, K. and Butler, D., 2003. Movement mechanisms of gross solids in intermittent flow. Water Science and Technology, 47 (4), 45–50.
- Lundblad, B. and Hellström, A.L., 2005. Perceptions of school toilets as a cause for irregular toilet habits among schoolchildren aged 6 to 16 years. School Health, 75 (4), 125–128.
- Meeds, E.H., 1995. Investigation of the performance of combined sewer overflow screens, Thesis (PhD). Sheffield Hallam University.
- Marples, N.R., Digman, C.J., and Myerscough, P.E., 2008. Innovative CSO design and delivery. WaPUG Spring Conference, 3 June 2008, Coventry.
- McDougall, J.A. and Wakelin, R.H.M., 2007. The influence of flush volume and branch drain cross-section on deformable solid transport in attenuating flows. Building Services Engineering Research and Technology, 28 (1), 7–22.
- Milne, D.A., Jefferies, C., and Ashley, R.M., 1996. Pollutional aspects of gross solids and their interaction with sewer sediments. Water Science and Technology, 33 (9), 31–37.
- Myerscough, P.E. and Digman, C.J., 2008. Combined sewer overflows - do they have a future?11th International Conference on Urban Drainage, 31 August-5 September 2008, Edinburgh. [CD-ROM]. IAHR/IWA.
- Staufer, P., 2011. Identification of areas with risk of sedimentation in small sized combined sewerages. 12th International Conference on Urban Drainage, 11-16 September 2011, Porto Alegre. London: IAHR/IWA.
- Tomlin, J. and Read, N.W., 1988. Comparison of the effects on colonic function caused by feeding rice bran and wheat bran. European Journal of Clinical Nutrition, 42 (10), 857–861.
- Turner, S. and Warwicker, M., 2004. Inspection report, Residential Special School, Bents Green Secondary School, Sheffield URN SC003049, Inspection 19-21 October 2004 CSCI. Retrieved from http://www.ofsted.gov.uk/inspection-reports/find-inspection-report/provider/CARE/SC003049 [Accessed 24 Jan 2013].
- Vernon, S., Lundblad, B., and Hellström, A.L., 2003. Children's experiences of school toilets present a risk to their physical and psychological health. Child: Care, Health and Development, 29 (1), 47–53.
- Walski, T., Falco, J., McAloon, M., and Whitman, B., 2011. Transport of large solids in unsteady flow in sewers. Urban Water Journal, 8 (3), 179–187.
- WaPUG, 2002. Code of Practice for the Hydraulic Modelling of Sewer Systems, Retrieved from http://www.ciwem.org/knowledge-networks/groups/urban-drainage/publications/code-of-practice.aspx [Accessed 4 June 2013].
- WaPUG, 2006a. The Design of CSO Chambers to Incorporate Screens, Retrieved from http://www.ciwem.org/knowledge-networks/groups/urban-drainage/publications/modelling-guides.aspx [Accessed 4 June 2013].
- WaPUG, 2006b. Guide to the Quality Modelling of Sewer Systems, Retrieved from http://www.ciwem.org/knowledge-networks/groups/urban-drainage/publications/modelling-guides.aspx [Accessed 4 June 2013].
- Williams, A.T. and Simmons, S.L., 1999. Sources of Riverine Litter: the River Taff, South Wales, UK. Water, Air & Soil Pollution, 112 (1-2), 197–216.
- WRc, 1987. A Guide to Short Term Flow Surveys of Sewer Systems. Marlow, UK: Water Research Centre.
- WRc, 2001. Sewerage Rehabilitation Manual. 4th ed.Marlow, UK: Water Research Centre.