
Abstract
This paper briefly describes the development and application of a tool for generating micro-components (e.g. baths, taps, showers, WCs, washing machines and dishwashers) based water efficient composite strategies and assesses their cost-effectiveness using a number of economic assessment methods. A composite strategy is defined as a combination of micro-components that could deliver a given water efficiency level. The assessment results suggest that the economic performance of water efficient composite strategies varies considerably. There is no linear relationship between water and energy consumption and the total cost associated with the strategies. Additionally, conventional cost assessment methods appear to be unsuitable for identifying the least cost options to consumers.
Introduction
Water scarcity and frequent droughts have become a major issue both in the developing and the developed world. For example in the USA, California is suffering from a severe unprecedented drought (Gleick Citation2015), prompting the implementation of mandatory water reductions in urban areas to reduce potable urban water usage by 25% (SWRCB Citation2015). For the UK households, the typical water consumption is about 150 litres per person per day (Grant and Howarth Citation2003) and has seen considerable increase (i.e. yearly by 1% since 1930) (Waterwise Citation2012). Additionally, a considerable amount of energy is also associated with water use in the household, resulting in an additional cost to consumers. As much as 25% of a household’s energy bill comes from heating water and domestic hot water accounts for 5% of UK greenhouse gas emissions (Waterwise Citation2012). Reducing per capita consumption could result in financial savings and a reduction in carbon emissions.
Although reduced consumption would imply reduced demand and therefore less production of water leading to the increased carbon emissions per unit volume of the treated water, reduced water consumption would surely reduce the overall emissions. There are other influencing factors including energy consumption, due to pumping in both water distribution systems, wastewater collection systems and, more significantly, energy associated with hot water use in households. The second biggest use of energy in the UK households is associated with heating water. According to EA (Citation2008), approximately 89% of emissions are related to water use by consumers in buildings and only about 11% is because of water and wastewater treatment processes and water transfer through distribution networks.
The Climate Change Act 2008 commits the UK to reducing emissions by at least 80% by 2050 from 1990 levels (Committee on Climate Change Citation2015). Therefore, reducing water consumption could address the hidden uncertainty with water scarcity, help consumers to make direct and indirect financial savings and assist in meeting emission reduction targets.
The implementation of cost-effective water efficient measures is seen as a way forward to reduce water consumption in buildings. These measures include water efficient appliances and fixtures, also reported as micro-components (e.g. taps, showers, WCs, baths, dishwashers and washing machines). The selection of these measures depends on a range of factors including available resources and context specific constraints or environmental objectives.
The reduction in water consumption to new levels (water efficiency levels, Table ), similar to the recently withdrawn Code for Sustainable Homes (CSH), is proposed to be reflected in the revised Building Regulations, via the inclusion of New National Technical Standards (SES Citation2015), and implemented from October 2015 (Clark Citation2015) in England and Wales, UK. The water efficiency levels will also be part of independent certification schemes such as the Home Quality Mark (HQM) (BRE Citation2015).
Table 1. Water efficiency levels/targets for resource efficient homes.
However, while the water efficiency levels aim at reducing the adverse environmental implications associated with the dwellings by promoting a reduction in water consumption, little is known about the cost to consumers (e.g. capital and operational cost) resulting from installing water efficient micro-components. The state of the available research on costing water demand management measures and associated issues and the methodology adopted is presented in Paper 1 (Fidar et al. Citation2016), which focuses on the potential economic implications of water efficient micro-components from the perspective of households. This paper evaluates the performance of composite strategies for the water efficiency level (Table ) of a building as a whole, regardless of the proportional contributions of the various micro-components towards potential water savings. A composite strategy is defined as a combination of micro-components that could deliver a given water efficiency level.
The paper firstly describes the development of an assessment tool employed to generate composite strategies capable of meeting water efficiency levels. Secondly, it examines the economic performance (the capital, operation and maintenance costs) of the generated water using composite strategies, using various economic assessment methods. It thirdly, analyses the performance of selected composite strategies and the suitability of conventional economic assessment methods in evaluating the performance of water using composite strategies from the perspective of consumers. The paper finally applies the modified cost assessment approach, which evaluates the cost of services (e.g. showering, WC flushing, etc.) rather than that of the resources (volume of water consumed), based on the philosophy that customers do not necessarily demand the resources, but rather they demand the services that the resource provides. The work presented here builds on Paper 1 (Fidar et al. Citation2016) where the focus was on the assessment of the cost-effectiveness of the individual micro-components.
Methodology
The methodology involves two steps:
| • | Generation of micro-component based water efficient strategies capable of meeting water efficiency levels (i.e. targeted reductions in per capita water consumption, shown in Table 1). | ||||
| • | Economic assessment of selected composite strategies. | ||||
These steps are briefly described below:
Generation of composite strategies
An assessment tool was developed to facilitate the generation of micro-component based composite strategies, analyse their performance and identify the strategies with minimal resource (water, energy and money) consumption and environmental footprints. The assessment tool consists of several interconnected components (Figure ). These are:
| • | Technology library: This contains information for the household water using micro-components. Seven micro-components, as shown in Table 2, have been included in the library. For each of the micro-components, different commercially available types have been considered. Thousands of alternatives were found in the market, but a sample of 537 models have been selected in this analysis, based on their performance in terms of resources consumption and capital costs (see also Table 2 of Paper 1, Fidar et al. (Citation2016)). The sample size and diversity are assumed to be representative in the UK and the wider Europe. The library also contains information on flow rates for the different types of showers and taps, flush volumes of the WCs, overflow capacity of baths and water and energy use associated with washing machines and dishwashers. The database has been compiled from the brochures provided by the micro-components’ manufacturers/suppliers including BMA (Citation2014). | ||||
| • | Generator: This is developed to automatically generate composite strategies for desired per capita water consumption and calculate the associated energy consumption and carbon emissions, costs and other environmental implications. An extensive number of permutations can be generated to develop composite strategies delivering the desired levels of water consumption. Through the user interface, the tool user can specify the number of permutations. The calculation of resource (water, energy and money) consumption and economic implications for such an extensive number of composite strategies requires considerable computational effort. To facilitate smooth data processing, the generator was compiled using a Visual Basic for Applications (VBA) code. | ||||
| • | User Interface: This is written in VBA to enable tool users to set the number of composite strategies to be generated and define constraints such as the maximum permissible per capita water consumption and/or energy use. | ||||
| • | Filter: The composite strategies produced by the generator are further processed through a filter, which avoids the strategies which never meet the constraints (e.g. acceptable level of water and energy consumption, carbon emissions and cost) defined in the interface. The strategies that meet the constraints defined in the interface are passed to the analyser for further analysis. In addition, the filter avoids duplicate strategies to pass. | ||||
| • | Analyser: In order to enhance user friendliness, this functionality has been developed with Microsoft Excel. The analyser facilitates the investigation of the role of each micro-component in the overall resources (such as water and energy) consumption by any given composite strategy and facilitates identification of strategies which have the potential to minimise impacts. | ||||
Figure 1. Components of the assessment tool.
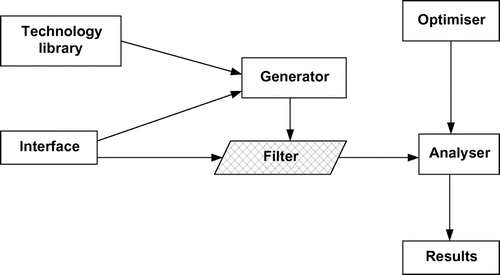
Table 2. Water use characteristics of the base case composite strategy.
The computational architecture of these components, their interactions and data flow between them is explained in Fidar (Citation2010).
Methods for economic assessment
The detailed methodology to assess economic implications for individual micro-components is presented in Paper 1 (Fidar et al. Citation2016). A similar approach has been applied in this paper to assess the generated composite strategies. The economic assessment involved using a range of methods: cost-benefit analysis, cost-effectiveness analysis and payback period. The appropriateness of these methods together with their limitations, particularly in the context of water efficiency projects evaluation, have been analysed in detail in Paper 1 (Fidar et al. Citation2016). The analysis suggests that of the three economic assessment methods (mentioned above), the cost-effectiveness analysis probably could provide useful insights into economic evaluation. There are different ways in which the cost-effectiveness of water efficiency strategies can be evaluated. Two of the most commonly used methods are: Average Incremental Cost (levelised cost) and Annualised Cost (Mitchell et al. Citation2007).
The Average Incremental Cost (AIC) of micro-components was calculated by dividing the net present value (NPV) of all the costs, including capital and operational expenditures by the net present value of the volume of water consumed or saved each year over the anticipated lifespan of the composite strategy under consideration (Equation (1)).(1)
For the ith micro-component under consideration:
(AIC)i = Average Incremental Cost (£/m3);
(PV)Ci = the present value of the capital cost (£);
(PV)Oi = the present value of the operational cost (£);
(PV)WSi = the present value of the volume of water saved (m3);
(PV)OSi = the present value of the avoided cost (i.e. cost saved as a result of reduced water consumption) resulting from not using water saved by the micro-component (£).
The AIC of the complete composite strategy, (AIC)CS, comprising selected micro-components can be found using the following equation.(2)
The annualised cost for each micro-component was calculated using Equations (3) and (4).(3)
(4)
where;
for each micro-component,
ACi = the annualised capital cost (£);
C = the acquisition cost (£);
O = the ownership cost (£);
n = the life time of the technologies/option (years);
W = the volume of water consumed (m3);
r = the discount factor;
ACi = the annualised unit cost of water consumed or saved (£/m3) by the micro-component.
It is important to note that the average life span of micro-components found in the literature varies widely. For example, the average life span of washing machines ranges from 8 to 16 years (Gleick et al. Citation2003, Rüdenauer et al. Citation2004, EA Citation2007, MTP Citation2008). Similarly, Presutto et al. (Citation2007) found the average economic lifetime of dishwashers to be 10–12 years. The average age of more than 1700 dishwashers in European countries was found to be around 4.7 years (Presutto et al. Citation2007). MTP (Citation2010) assume the typical lifespan of a dishwasher is approximately 13 years. In this study, an average life span of 10 years has been used.
The annualised cost of a composite strategy is then calculated using the following equation.(5)
The unit prices for water and energy (electricity and gas) were assumed to be the same as described in Paper 1 (Fidar et al. Citation2016). The water use characteristics of conventional micro-components delivering a typical daily per capita consumption of 150 litres are summarised in Table .
Results and discussion
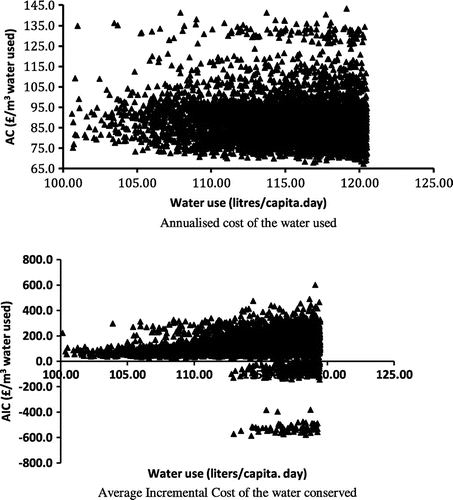
The annualised unit cost of the water used and the average incremental cost of the water conserved by installing water efficient micro-components based composite strategies (consisting of the combinations of the different models of WC, shower, basin tap, kitchen tap, dishwasher, washing machine and bath) are illustrated in Figure . In the figure, each point refers to a specific composite strategy. The economic performance of the strategies varied widely, even among those strategies which use a similar amount of water and energy. The study found no linear relationship between water and energy consumption and the total unit cost (of water consumed or conserved) associated with the composite strategies.
Figure 2. Annualised cost of the water used and Average Incremental Cost of the water conserved.
As the figure shows, for any given water efficiency level (as defined in Table ), there could be many composite strategies that could deliver. Given the large number of composite strategies generated, it would be difficult to show their details in the study. Therefore, five composite strategies were randomly chosen, for each water efficiency level defined in Table , as examples of their respective categories to analyse in detail their economic implications. Strategies A1–A5 can deliver Levels 1 and 2 (120 litres/capita. day), strategies B1–B5 can deliver Levels 3 and 4 (105 litres/capita. day) and C1–C5 can deliver Levels 5 and 6 (80 litres/capita. day). To achieve considerable reduction in per capita consumption (i.e. from 150 to 80 litres/capita. day), the CSH (DCLG Citation2008) suggested considering some form of low grade alternative water resources (AWR) for non-potable applications (e.g., for flushing toilets) as part of composite strategies delivering water efficiency Level 5. The AWRs include: treated greywater (water from showers, baths and basin taps); and rainwater (water collected normally from rooftops during wet weather). However, in the present study any reuse of AWRs has been excluded from strategies in group C. The implications of AWRs (e.g. greywater recycling systems) were investigated separately and are reported in Memon et al. (Citation2015). The investigation suggested that AWRs can reduce per capita freshwater consumption significantly but there will be considerable cost and carbon implications. For this reason, micro-component based water demand management measures are preferred over AWRs. For the present study, the details of the selected composite strategies in groups A, B and C are presented in Table .
Table 3. Selected composite strategies and water characteristics of micro-components.
The performances of the selected strategies, in terms of their annualised cost and AIC are shown in Figure . The water consumption characteristics of micro-components in each selected composite strategy are given in Table . Figure illustrates that the two assessment techniques give significantly different outcomes and do not necessarily rank the options in the same order. This is indicative of the fact that the cost assessment method applied can influence the outcome of the assessment and therefore the decisions to be made.
Figure 3. Annualised cost and the AIC of the selected strategies.
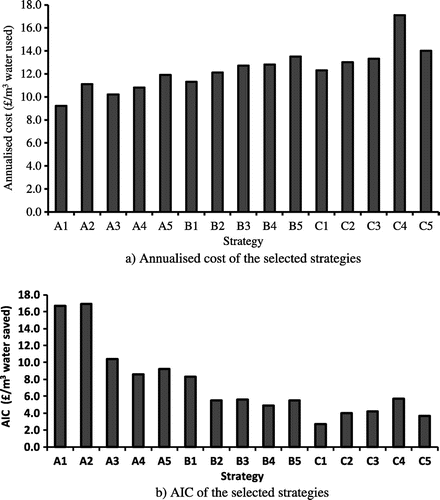
For example in Figure (a), Strategy A1 has the least cost per unit of water consumed, whereas in Figure (b), Strategy C1 represents the most cost-effective option. This difference in outcomes and ranking of options is attributable to the fact that the two assessment methods use completely different approaches to assess the cost of the feasible options. For instance, in this study the annualised cost assessment method was used to evaluate the cost per volume of water used, while the cost of water saved through a particular composite strategy (relative to the base case composite strategy, Table ) was assessed with the AIC method.
Figure illustrates the contributions of the individual micro-component to the annualised unit cost and the AIC associated with Strategy B1 (Table ). The figure also compares unit costs associated with personal washing and dishwashing operations.
Figure 4. Contribution of micro-components to annualised cost and the AIC of Strategy B.
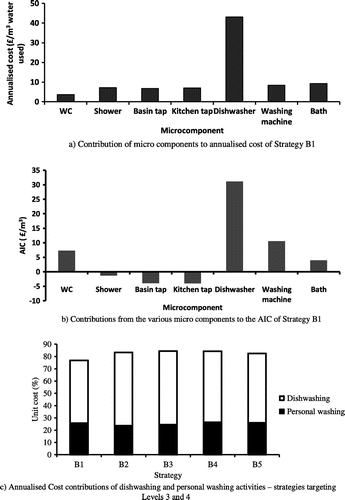
In general, dishwashers contributed significantly to the overall unit cost, representing about 50% and 60% of the total annualised cost and the AIC associated with the strategy, respectively. This is attributable to the fact that dishwashers have comparatively higher capital cost and lower water consumption. The negative values in Figure (b) indicate savings in cost compared to the base case micro-components as detailed in Table .
Additionally, the figure illustrates that, for all strategies, dishwashing activities dominated the cost, contributing more than 50% of the total cost of the strategies. Personal washing activities represented between 23% and 26% of the cost. Interestingly, these results contrast with the performance of the two activities (personal washing and dishwashing) in terms of their energy and water consumption. The personal washing activities dominated the energy use of the composite strategies analysed. Excluding the dishwasher from the strategy would result in approximately a 4% increase in water consumption (due to increase in kitchen tap water consumption), but would decrease the unit cost by more than 45%.
Theoretically, dishwashers represent only approximately 3% of a household’s total water use. However, according to MTP (Citation2011) documents, dishwasher ownership and use lead to a 30% reduction in the frequency of kitchen tap uses. Less than one-third of UK households own a dishwasher and penetration is not expected to increase significantly in the immediate future (Zygmunt and Walker Citation2008).
When heated with gas energy, a cubic metre of water used for personal washing activities costs more than £6 to water consumers. If the energy to heat the water is derived from electricity such as showering with electric showers, the operational cost rises to as high as £9/m3.
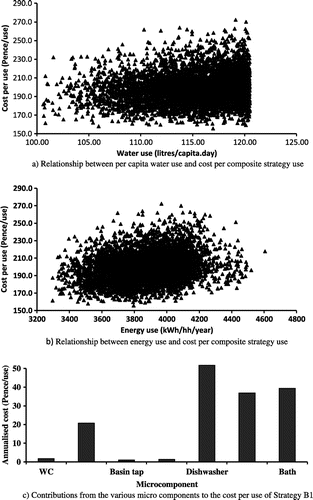
Figure (a and b) plots cost per composite strategy use (in pence) as a function of water and energy consumption. Examining the figure illustrates significant variations in economic performance among the composite strategies, even among those with similar resource (water and energy) consumption.
Figure 5. Relationship between energy use and per capita water use and cost per composite strategy use.
The fact that the various cost components (capital and operational costs) have a widely varying influence on the economic performance of the different individual micro-components that make up the composite strategies, indicates that there is no single factor (such as capital cost, water consumption, energy use) that solely determines the cost of the services provided by the composite strategies. This also highlights the complexity of identifying cost-effective, micro-component-based water efficiency measures in residential buildings.
However, closer examination of the generated composite strategies showed that the strategies which included relatively more expensive white goods (dishwasher and washing machine) tended to have higher cost per composite strategy use. In all strategies the white goods represented more than 50% of the total cost per use. In certain strategies, they constituted more than two-thirds of the total cost.
A cost per use (in pence) analysis for the composite strategy shown in Figure is presented in Figure (c). Less frequently used micro-components such as dishwashers, washing machines and baths have, comparatively, resulted in higher cost per use, indicating that economic efficiency of water using micro-components increases with increased frequency of use. Increased frequency of use reduces the influence of the capital cost on the total economic performance and raises the implications of the variable cost component. However, while higher frequency of use leads to a reduced cost per use, in real terms it increases the cost by raising the total annual operational cost.
Implications
This section develops on the findings and analysis presented in Paper 1 (Fidar et al. Citation2016) and the results presented in this paper.
Whether an alternative (micro-component or composite strategy) is cost-effective or not depends on many factors including “from which perspective the assessment is being made”. From a water service provider’s perspective, an alternative may lead to a greater reduction in marginal operational cost compared to other options, regardless of what purpose the water has been used. Conversely, the consumers’ interests lie in the services provided and not necessarily the volume of water supplied or saved. Therefore, from the consumers’ perspective, the option with the lowest cost per use represents the most cost-effective option.
This highlights the importance of defining an appropriate functional unit (as used in the life cycle assessment techniques) against which the economic performances of a range of technically feasible options are evaluated. Indeed, the comparison between two or more systems is justified only if they have the same function, for example, two showers or WCs with different performance characteristics. This is based on the concept that it is not the products themselves that are required, but the functions they provide. Therefore, functions of the products form the basis for the evaluation or comparison of the economic implications associated with the systems or products.
At the water company level, water represents the product and the functional unit can be the volume of water supplied or conserved. In this case, the economic performance assessment focuses on identifying the option with the lowest cost from a set of alternatives and/or systems all of which can deliver the defined functional unit.
With regard to the consumers’ perspective, the water, together with the micro-components, form the systems that have to deliver the services demanded by the system’s users (consumers). The functional unit should then be defined based on, not the volume of water supplied or conserved, but the number/quality of services (such as the number of showers, baths, WC flushes, clothes washes or, dish washes) provided by the systems. In the context of the present research, the functional unit was determined based on the services provided by one composite strategy in 10 years (the anticipated life span of the water using microcomponents). Table presents a summary of the services, which represent the functional unit, on which the assessment was based. The number of uses for different micro-components has been calculated for a household with an occupancy of 2.4.
Table 4. Functional unit used in the assessment study (Fidar Citation2010).
Therefore, the economic performance assessment (conducted from the perspective of the consumer) is required to explore the least cost means of achieving the water-related services. White and Howe (Citation1998) suggested that the “least cost planning” approach evaluates the costs and benefits of a range of means of meeting water customers’ demands for water-related services. Similarly, Fane et al. (Citation2004) argued that “least cost planning” should focus on how water systems interact with system users to deliver the services that people actually want or use and how the demand for a specific end use is likely to change in the future.
Within the context of least cost planning, water service providers consider water efficiency measures as an alternative to new or expanded water supply infrastructure. Therefore, logically, water service providers implement water efficiency measures only when they consider them as cost-effective – that is when the unit cost associated with the water efficiency measure is less than that of the lowest-cost option for a new or expanded water supply. Additionally, the reduced revenue experienced by water service providers as a result of implementing a given water efficiency measure is an issue very often raised in relation to investment in water efficiency options (White and Howe Citation1998). However, commonly, water service providers pass the cost of water efficiency measures, including the foregone revenue, to consumers (Walker Citation2009).
Conversely, the cost to consumers of the water-related services is determined mainly by what a given unit of water has been used for, rather than how the unit has been delivered. Indeed, as water using micro-components are where urban water system users interact with the system, they determine how (or what) a given volume of water is used for. For example, hot water using micro-components, including washing machines and dishwashers, require an energy input which significantly raises the cost of the services to the consumers. This indicates that the least cost alternative from the perspective of water companies is not necessarily the same when assessed from the perspective of consumers. Therefore, the outcome of a cost-effectiveness analysis limited to the cost perspective of a water company is potentially going to overlook the best opportunities in terms of economic, social and environmental performance. In addition, water efficient hot water-using micro-components reduce household energy consumption, which may affect the revenue of the energy provider – something commonly ignored when assessing the economic implications of the water efficiency measures.
Conclusions
One of the obstacles to the least cost approach is whose costs are to be minimised; the water service providers, existing customers, future customers, or society at large. In conventional cost analysis, urban water managers and decision makers undertake the assessment from the perspectives of the service providers and seek to optimise resources consumptions for a given project or programme, while minimising the resulting environmental damage.
This paper evaluated the potential economic implications associated with the water efficiency levels from the perspective of households. The cost components considered in the assessment included the capital, operation and maintenance. In addition, the suitability of the various economic assessment methods in evaluating the performance of water efficient composite strategies, from the perspective of consumers, was investigated. The key messages resulting from the presented research are:
| • | The economic performance of water efficient composite strategies varies widely, even among those strategies with equal water and energy consumption. The analysis revealed no linear relationship between water and energy consumption and the total cost associated with the composite strategies. | ||||
| • | Many micro-component-based WDM strategies, whilst saving water, do not necessarily have cost savings. However, combinations of certain micro-components (i.e. carefully selected composite strategies) do offer the potential to reduce the cost as well as water and energy consumption. | ||||
| • | It has also been established that, when assessed from the customers’ perspective, the end use that a given volume of water has been used for determines water-related costs. | ||||
| • | Furthermore, the research has confirmed that different cost assessment methods can give significantly different outcomes and do not necessarily rank options in the same order (Figures 4 and 5). This is indicative of the fact that the cost assessment method applied can influence the outcome of the assessment and therefore the decisions to be made. | ||||
Funding
The research was funded by the UK Engineering and Physical Sciences Research Council (EPSRC) and its support is thankfully acknowledged.
Supplemental data
Supplemental data for this article can be accessed here. [http://dx.doi.org/10.1080/1573062X.2016.1224361]
Supplementary material
Download PDF (6.5 KB)Related Research Data
References
- BRE, 2015. New home quality mark puts consumers at the heart of house building. Building Research Establishment (BRE) briefing note. Available from: http://www.bre.co.uk/news/New-Home-Quality-Mark-puts-consumers-at-the-heart-of-house-building–1059.html [Accessed 19 May 2015].
- BMA, 2014. Bathroom Manufacturers Association. Available from: http://www.bathroom-association.org/ [Accessed 15 October 2014].
- Clark, T., 2015. Code for sustainable homes scrapped. Available from: http://www.building.co.uk/code-for-sustainable-homes-scrapped/5074697.article [Accessed 19 May 2015].
- Committee on Climate Change, 2015. The Climate Change Act and the UK regulations. Available from: http://www.theccc.org.uk/tackling-climate-change/the-legal-landscape/global-action-on-climate-change/ [Accessed 19 May 2015].
- DCLG, 2008. Code for sustainable homes: Technical guide. Department for Communities and Local Governments Publications. Available from: http://www.planningportal.gov.uk/uploads/code_for_sustainable_homes_techguide_april08.pdf [Accessed 29 March 2015].
- EA, 2007. Water efficiency in the South East of England – Retrofitting existing homes. Available from: http://www.thenbs.com/PublicationIndex/DocumentSummary.aspx?PubID=215&DocID=282629 [Accessed 29 March 2015].
- EA, 2008. Greenhouse gas emissions of water supply and demand management options. Science Report – SC070010. London: Market Transformation Programme, MTP, Department for Environment, Food and Rural Affairs (Defra).
- Fane, S., Turner, A. and Mitchell, C. (2004). The secret life of water systems: Least cost planning beyond demand management. 2nd IWA Leading Edge Conference on Sustainability in Water Limited Environments. November 2004, Sydney, Australia.
- Fidar, A., 2010. Environmental and economic Implications of water efficiency measures in buildings. Thesis (PhD). University of Exeter, UK.
- Fidar, A.M., Memon, F.A. and Butler, D. (2016) Economic implications of water efficiency measures I: Methodology and cost effectiveness of micro-components. Urban Water Journal. doi:10.1080/1573062X.2016.1223859
- Gleick, P., 2015. What Californians can expect from the drought? Oakland, CA: Pacific Institute http://www.californiadrought.org/drought/what-is-drought/ [Accessed 21 May 2015].
- Gleick, P., Haasz, D., Henges-Jeck, C., Srinivasan, V., Wolff, G., Cushing, K. and Mann, A. (2003). Waste not, want not: The potential for urban water conservation in California. Oakland, CA: Pacific Institute for Studies in Development, Environment and Security. Available from: http://www.pacinst.org/wpcontent/uploads/sites/21/2013/02/waste_not_want_not_full_report3.pdf [Accessed 29 March 2015].
- Grant, N. and Howarth, D., 2003. The economics of water efficient products in households. In: C. Maksimovic, D. Butler and F.A. Memon, eds. Advances in Water Supply Management. Avereest: Balkema Publishers, 581–589.
- Memon, F.A., Fidar, A.M., Ward, S., Butler, D., and Alsharif, K., 2015. Energy and carbon implications of water saving micro-components and grey water reuse systems. In: F.A. Memon and S. Ward, eds. Alternative Water Supply Systems. London: IWA Publishing, Chapter 13, 265–285.
- Mitchell, C., Fane, S., Willets, J., Plant, R. and Kazaglis, A., 2007. Costing for sustainable outcomes in urban water systems: A guidebook. Salisbury: The Cooperative Research Centre for Water Quality and Treatment.
- MTP, 2008. BNW05: Assumptions underlying the energy projections for domestic washing machines. London: Market Transformation Programme, MTP, Department for Environment, Food and Rural Affairs (Defra).
- MTP, 2010. BNW DW01: Dishwashers government standards evidence base 2009: Key inputs. London: Market Transformation Programme, MTP, Department for Environment, Food and Rural Affairs (Defra).
- MTP, 2011. Market transformation programme – Briefing notes (Water sector). Available from: http://efficient-products.ghkint.eu/cms/document-library/index.html [Accessed 23 March 2015].
- Presutto, M., Stamminger, R., Scialdoni, R., Mebane, W. and Esposito, R., 2007. Preparatory studies for eco-design requirements of EuPs. Tender TREN/D1/40-2005. Lot 14: Domestic washing machines and dishwashers. Final report: Draft version. Tasks 1–2. Berlin: Bundesanstalt für Materialforschung und -prüfung (BAM).
- Rüdenauer, I., Gensch, C. and Quack, D. (2004). Eco-efficiency analysis of washing machines – Life cycle assessment and determination of optimal life span. Electrolux-AEG, Hausgeräte, GmbH and BSH Bosch und Siemens Hausgeräte GmbH. Final report, ÖkoInstitut e. V. Berlin: Institute of Applied Ecology. Available from: http://www.oeko.de/forschung-beratung/projekte/pr-details/eco-efficiency-analysis-of-washing-machines/ [Accessed 15 September 2016].
- SES, 2015. How will the New National Technical Standards (NNTS) affect you? Stanstead Environmental Services. Available from: https://www.linkedin.com/pulse/how-new-national-technical-standards-nnts-affect-you-daniel-judd [Accessed 19 May 2015].
- SWRCB, 2015. Water conservation portal - Emergency conservation regulation. California State Water Resources Conservation Board (SWRCB). Available from: http://www.waterboards.ca.gov/water_issues/programs/conservation_portal/emergency_regulation.shtml [Accessed 19 May 2015].
- Walker, G., 2009. The water and energy implications of bathing and showering behaviours and technologies. Waterwise. Available from: http://www.waterwise.org.uk/images/site/Research/final%20water%20and%20energy%20implications%20of%20personal%20bathing%20-%20for%20est%20apr%2009.pdf [Accessed 6 July 2015].
- Waterwise, 2012. Water – The facts: Why do we need to think about water? Waterwise. Available from: http://www.waterwise.org.uk/data/resources/25/Water_factsheet_2012.pdf [Accessed 20 May 2015].
- White, S. and Howe, C., 1998. Water efficiency and reuse: A least cost planning approach. Proceedings of the 6th NSW Recycled Water Seminar. November 1998, Sydney, Australia, 115–120. Available from: http://cfsites1.uts.edu.au/find/isf/publications/whitehowe1998waterefficiencyreuse.pdf [Accessed 15 September 2016].
- Zygmunt, J. and Walker, G., 2008. Water and energy consumption of dishwashers and washing machines: Analysis of efficiencies to determine the possible need and options for a water efficiency label for wet white goods. Waterwise. Available from: http://www.waterwise.org.uk/data/2008_Waterwise_washing_machines_and_dishwashers.pdf [Accessed 29 March 2015].