
ABSTRACT
This paper presents the validation of a novel leak detection method for water distribution pipelines, although it could be applied to any buried pressurized fluid flow pipe. The detection method is based on a relative pressure sensor attached non-invasively to the outside of the pipe combined with temperature difference measurements between the pipe wall and the soil. Moreover, this paper proposes an anomaly detection algorithm, originally developed for monitoring website traffic data, which differentiates a ‘leak’ event from ‘normal’ pressure change events. It is compared to two more commonly used methods based on a fixed threshold and a moving average. The validation of the new system in a field trial over a 6-month period showed that all the known leaks were identified with 98.45% accuracy, with the anomaly detection algorithm performing best, making this system a real contender for leak detection in pipes.
Introduction
Underground pipeline systems (e.g. water, gas) are vital infrastructures that cities and societies greatly depend on, yet they are often also the oldest. This, combined with the fact that they are buried, makes their condition assessment extremely complex and challenging. Moreover, at different times various materials have been introduced for use as pipes (Rajani and Kleiner Citation2004), which have different deterioration mechanisms significantly increasing the challenges for condition assessment.
Losses due to a failure (i.e. a leak) of a pipe are not limited to the direct loss associated with the lost medium, but they also include other direct (i.e. costs for repairs), indirect (i.e. interruption to supply) and social (i.e. public image and trust) costs (Al-Barqawi and Zayed Citation2006; Makar and Kleiner Citation2000), which can have a significant impact on the asset owners and to society. The total cost of a failure also increases with time to implement a repair (Rajani and Kleiner Citation2004) and therefore, fast detection of failures is an essential part of a pipeline network management system.
A variety of techniques can be used to detect failures in pipes. These methods are commonly called Non-Destructive Testing/Evaluation (NDT/NDE) methods (Al-Barqawi and Zayed Citation2006; Misiunas Citation2005) and are used to evaluate the deteriorated state of a pipe and to detect potential failures ideally before they happen or at an early stage in the failure process. These systems rely on different measurement/monitoring techniques (Liu and Kleiner Citation2012, Citation2013; Rajani and Kleiner Citation2004; Sinha and Knight Citation2004; Sonyok, Zhang, and Zhang Citation2008). The most common types of leak detection method are acoustic-based methods, which rely on the detection of acoustic sound emitted by the leak. In order to detect this acoustic wave, they commonly use hydrophones which often require access to the interior of the pipe via a tapping. In addition, these systems are not suitable for dense spatial deployment for continuous monitoring of pipes due to their high cost, high sampling rate (causing high power consumption) and need for intensive processing power.
A large proportion of NDE techniques are based on either geophysical surveys from the ground surface or surveys from within the pipe and are not suitable for long-term, high spatial resolution over a large area, deployment on the pipeline networks (e.g. ground penetrating radar and vision-based systems). Current NDE techniques such as vision-based methods and Smart Pipe Inspection Gauges (PIGs) also commonly have high power consumption and require access to the interior of the pipe, which make them less suitable for long-term continuous deployment over a large area. Each NDE technique has their specific advantage and disadvantage based on the technology that it uses and are well documented in the literature (Costello et al. Citation2007; Liu and Kleiner Citation2012; Makar and Kleiner Citation2000; Misiunas Citation2008; Rajani and Kleiner Citation2004; Rizzo Citation2010).
Wireless Underground Sensor Networks (WUSN) as a subset of wireless sensor networks offer a potentially suitable platform for large area pipeline monitoring due to their scalability and continuous monitoring capabilities. Different sensor networks for pipeline monitoring have been developed (Cattani et al. Citation2017; Lai, Chen, and Li Citation2012; Stoianov et al. Citation2007, Citation2008; Whittle et al. Citation2013), but commonly rely on direct pressure sensors. These can introduce a potential leakage point similar to tapings for service lines as discussed by Tayefi, Beck, and Tomlinson (Citation2015) or contamination in asbestos cement pipes as described by Webber et al. (Citation1989). In addition, the higher cost of these systems compared to traditional surveying techniques makes their dense deployment not economically feasible. Therefore, there is a need for a low cost and easy to install non-invasive (to the pipe) method of monitoring pipelines.
This paper presents the validation of a novel sensor system capable of non-invasive pipeline monitoring. It is based on relative pressure sensor measurements combined with temperature difference measurements between the pipe and surrounding medium, to detect leaks in buried pipes in the field. A new anomaly detection algorithm to automate the data analysis, and thus significantly improve the usability of the system by minimising false alarms and automating the analysis, is also presented. It is this new algorithm that makes the system a real, and practical alternative to the more expensive solutions used to date.
Proposed leak detection system
Overview of the sensor system
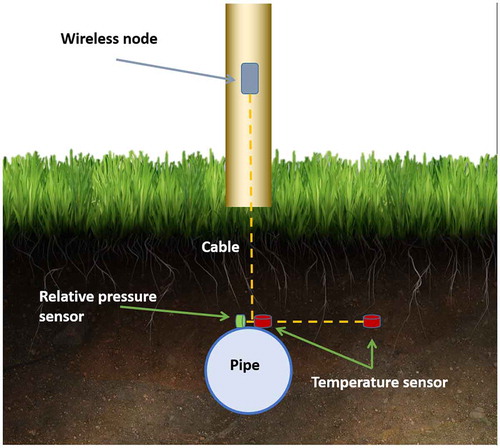
The leak detection method is based on a distributed low-power wireless sensor network and is described in detail in Sadeghioon et al. (Citation2014). Briefly, this system consists of multiple low-cost wireless nodes installed on the pipeline system. Each node is connected to a relative pressure sensor (based on a Force Sensitive Resistor, FSR) attached to the outside of the pipe using a clip, and it utilizes the expansion and contraction of the pipe due to pressure changes (see Sadeghioon et al. Citation2014 for more details). The node is also connected to temperature sensors, one attached to the pipe wall and the other in the soil in close proximity to the pipe (at the same depth as the pipe). Figure shows a schematic of the system.
Figure 1. Schematic of the wireless sensor node and the sensors.
Relative temperature difference measurements
Temperature is one of the key parameters to monitor in relation to pipelines. Large variations in the environmental temperature of the pipes (i.e. seasonal changes) can increase the number of pipe failures during cold seasons (Kleiner and Rajani Citation2002). However, regardless of the changes in environmental temperature, the temperature of the pipe also varies based on the temperature and the flow rate of the medium (i.e. water) that it carries. Changes in the flow rate vary the cooling/warming effect of the medium on the pipe wall. This is due to the change in the residence time of the medium in the pipe, which changes the transfer of heat between the medium and the pipe. Based on this principle a novel method of detecting relative changes in the flow rate of the pipe is proposed (Sadeghioon Citation2015; Sadeghioon et al. Citation2014). The temperature of the pipe wall and its surrounding soil are measured by two separate temperature sensors correspondingly placed directly on the pipe wall and at 30 cm horizontal distance into the soil (at the same depth as the pipe). Changes in the flow of water in the pipe (i.e. caused by a pipe failure) result in a change in the temperature of the pipe wall. However, due to the low-thermal conductivity of the soil compared to the pipe, this change in temperature will not affect the temperature of the soil (at 30 cm away) creating a change in the temperature difference between the pipe and the soil. The type and condition of the soil (i.e. its moisture content) can affect its thermal conductivity. However, due to the significant difference between the thermal conductivity of the pipe and the soil, the effect of these characteristics of the soil on the temperature difference between the pipe and the soil is negligible. As the temperature difference caused by customer demand usually follows a daily pattern and is not permanent (unlike leaks) it is possible to differentiate the variations caused by leaks from those caused by usage. This method is also not affected by seasonal or sudden temperature variations as it only relies on the relative difference in temperature between the pipe and the soil. This effect has been observed when the sensor system was deployed in the field (Sadeghioon et al. Citation2014), and in FEA modelling not included in this paper due to space limitations. Based on these findings, this paper proposes that the temperature differential in combination with the relative pressure readings from the FSR sensor can be used to detect abnormal pressure drops in the pipe caused by leaks/bursts and differentiate them from systematic pressure changes in the pipeline, therefore reducing the number of false positives (incorrectly identified leaks).
Leak detection algorithms
Leak detection algorithms based on absolute pressure and flow measurements using DMA (District Metered Area) loggers or loggers with a high sampling frequency (>200 Hz) and transient-based leak detection algorithms have been the topic of numerous research in the literature (Covas and Ramos Citation2010; Hamilton and Charalambous Citation2007; Mashford et al. Citation2009; Meniconi et al. Citation2015; Vitkovsky, Simpson, and Lambert Citation2000; Wu, Sage, and Turtle Citation2010). Both of the proposed metrics in the current research are relative measurements and therefore are not suitable as an input for these conventional algorithms. Therefore, a novel method of leak detection based on an anomaly detection algorithm (Kejariwal Citation2015; Vallis, Hochenbaum, and Kejariwal Citation2014) originally developed for monitoring website traffic is proposed. To the best of authors’ knowledge this is the first time this method has been applied to pipeline monitoring data. This method is also compared with two other common approaches for detecting pipe failure using the same input parameters. It should be noted that the accuracy is not important for this system as we are measuring relative values. It is the resolution of the sensors (i.e. 0.0625 °C for the temperature sensor and 12 bits for the FSR system) which is critical, and enables them to register small relative changes in the operation of the pipe compared to its normal operation. More details on precision, accuracy and resolution of field instrumentation can be found in (Dunnicliff and Green Citation1993). In addition, all the methods investigated in this paper combine the readings from the relative pressure sensor and the temperature differential to differentiate failures resulting from a change in the flow rate within the pipe from normal pressure changes.
A common pre-processing methodology, segmenting the relative pressure sensor and the calculated temperature differences into daily ranges needs to be carried out on the data to make them suitable for all of the leak-detection techniques. The absolute value of the range of the relative pressure P R and temperature difference T R are then calculated and are used as the input parameter for the leak detection algorithms.
The first of the three methods (method A) uses a fixed threshold defined by the user based on historical data (e.g. the mean value of the relative pressure and temperature difference range during the first 7 days) from the same system to detect abnormalities in the relative pressure range of each day. Subsequent days are flagged if the fixed threshold is exceeded. Similarly, a fixed threshold is used to flag days with abnormal temperature difference readings. A leak is identified in the system if, for a given day, both the temperature difference and the relative pressure readings are flagged. Despite the simplicity of this algorithm it can be very effective in systems where pipes have a consistent operational characteristic (for example fixed pressure regimes and predictable industrial usage).
The second method (method B) also uses a threshold criterion, but this is not fixed and is calculated based on a 7-day moving average from the data. Similar to method A, days where both the temperature difference and the relative pressure are outside the threshold values are used as an indication of a potential anomaly in the pipe operation (i.e. leak). This method is more suitable for systems where normal operational parameters of the system are not constant. However, a drawback of this method compared to method A is that the moving average can potentially mask slowly developing leaks by adapting the threshold to the leaks as it grows.
The third method (method C), based on anomaly detection algorithms, classifies the days with anomalies by using a Seasonal Hybrid Extreme Studentized Deviate (S-H-ESD) algorithm developed by Twitter and is published as an open source R package (Kejariwal Citation2015). This method extends the well-established Generalized ESD test by dissecting data into piecewise approximations. The S-H-ESD algorithm removes the periodic components and the median of the data for each timeframe in order to create the data-set for the ESD calculations. The Generalized ESD assumes that the inliers are normally distributed and there can be K outliers in the data-set where and is a user defined value based on the data-set type and expected prevalence of anomalies (for this data a maximum of 49% anomaly is used in the algorithm to ensure maximum number of anomalies are detected). The method then calculates the first outlier by identifying the furthest deviation from the mean. This outlier is then removed from the data-set and the next outlier is identified by recalculating the statistical parameters (up to K outliers). Although this method was originally developed for monitoring website traffic data it has been adopted in this research for pipeline monitoring as the two data-sets have similar daily patterns. In addition, this method can detect both local and global anomalies. This is important as leaks can manifest themselves as large systematic anomalies or smaller local anomalies. Also, unlike most other anomaly detection algorithms this method can be easily applied to relative measurements. Further details on this method are presented in (Hochenbaum, Vallis, and Kejariwal Citation2017). The relative pressure and temperature difference data-sets are analyzed and flagged separately using this package. Similar to methods A and B, days with anomalies in both data-sets are identified as indicating potential pipeline failure. It should be noted that data-processing techniques such as Kalman Filtering cannot be applied to relative measurements in their current form as is the case with the relative pressure data collected from the system described in this paper.
The performance of all the methods was analyzed by comparing their accuracy, sensitivity and specificity. Accuracy is calculated using Equation Equation(1)(1) .
(1)
The sensitivity is given by Equation Equation(2)(2) .
(2)
The specificity of the algorithms is given by Equation Equation(3)(3) .
(3)
The false positive rate of the algorithms is given by Equation Equation(4)(4) .
(4)
Field Trials
The wireless node and its associated sensors were deployed on an industrial water facility to validate the performance of the system and its leak detection capabilities when combined with the algorithms. This facility has a network of pipes which are connected to the main water distribution network of the area (with various pipe diameters and materials) this was crucial for these tests as it enabled the system to be tested in a realistic environment with common daily fluctuations due to demand. In addition, there are several service taps along this pipe network (with an outlet into the ground) which were used to create ‘leaks’ by opening the valves. The FSR sensors were attached to 90 mm diameter medium density polyethylene (MDPE) water pipes at a depth of approximately 75 cm (see Sadeghioon (Citation2015) for more detail). The surface at the location of the nodes was covered by grass. The outputs of the sensors were measured every 256 s using an ultra-low power WSN node developed by Sadeghioon et al. (Citation2014), which time stamped and transmitted the data to a laptop located in a building approximately 30 metres away. A 3G network connection was then used to upload the data to the cloud. The measurement frequency was selected as it provided a good balance between the battery life and performance, and also it was close to the frequency commonly used by DMA data loggers used by water companies. The water pipelines used in the facility were connected to a small distribution network resulting in daily variations in the sensor data. During the monitoring period (i.e. 6 months, mid-summer to mid-winter in the UK) various valves on the pipe were opened (as part of valve training programmes), simulating a leak/failure in the pipes.
The proposed leak detection system can operate based on the data from only one node. However, by using only one node the system cannot provide information regarding the location of the leak. Denser deployment of the nodes will allow the location of the leak to be narrowed down between the node upstream and the one downstream of the leak. This is possible due to the difference between the change in the flow rate in the pipe before and after the leak resulting in a change in temperature difference. Any systematic pressure change caused by a leak will be recorded by all of the nodes on the pipe. However, local pressure changes caused by the leak can only be detected by the nodes in the vicinity of the leak. The zone of influence of each node for measuring these local pressure variations depends on the pipe characteristics (i.e. diameter), operational characteristics and size of the leak. These local pressure changes are not studied in this paper and the proposed leak detection method uses systematic pressure changes and local pressure and temperature difference for its operation.
During the trials a total of 6 nodes were installed on the pipe network at the facility separated by approximately 2 metres. The results presented in the next section were for one of the nodes attached to a 90 mm diameter MDPE pipe.
Results and discussion
All of the nodes associated with the trials were able to successfully monitor and log the relative pressure and temperature difference for the pipes. The output of one of the nodes installed on the MDPE pipe collected for a period of 6 months is presented and analyzed in this paper. These results are also verified by comparison with analyzed data from a separate node on the same pipe. Figure shows the raw relative pressure data and temperature difference obtained from this node. The temperature difference is calculated by determining the absolute value of the difference in temperature measured by the sensor attached to the pipe wall and the sensor placed in the soil.
Figure 2. Relative pressure data and temperature difference data collected by the node.
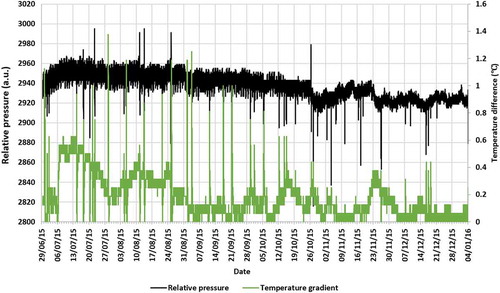
It is seen from Figure , that the sensors used in the trials successfully recorded daily fluctuations in the relative pressure of the water in the pipe. In addition, some anomalies were detected by the sensors, and are indicated by the spikes in the data.
The raw data collected by the node was pre-processed in order to calculate the daily range of the relative pressure and temperature difference. Figure (a) and (b) shows the processed data-set for the relative pressure range and temperature difference range respectively, and it also includes the reference days where valve operations were undertaken. These dates are used as a reference for analysing the performance of the proposed methods.
Figure 3. Calculated daily range values for (a) relative pressure and (b) temperature difference.
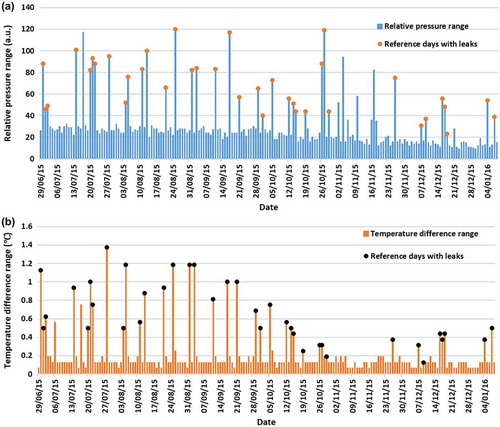
It can be seen from Figure (a) and (b) that the days when valve training took place showed a higher daily range for both relative pressure and temperature difference compared to other days where no training was carried out. The daily ranges were analyzed using the three proposed methods for leak detection to identify the most suitable and reliable approach to automate leak detection based on the proposed metrics. The output from each of the three algorithms were compared with the reference data (i.e. known valve training dates) to study the performance characteristics of each of the techniques. Figure (a) and (b) shows the output detection thresholds using methods A and B for the temperature difference and relative pressure readings respectively. In these figures, days with a higher daily range as compared to the threshold values are flagged as days with a potential leak.
Figure 4. (a) Relative pressure data and (b) Temperature difference values compared to the threshold values for methods A and B.
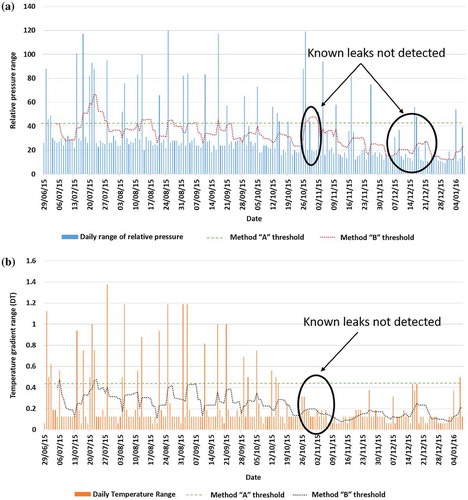
Major limitations of methods A and B can be identified by further analysis of Figure (a) and (b) showing that although large events (i.e. abnormalities) were flagged by method A, smaller events (Figure (a), 07/12/2015-21/11/2015 and Figure (b), 26/10/2015-02/11/2015) were not flagged by this method. In addition, this method lacks adaptability to normal changes in the system, such as changes in the range of the daily pressure variations due to a change in the pressure regulation system. Similarly, negative drift in the baseline data can potentially result in the events not being flagged. Method B addresses many of the shortcomings of method A by adjusting to changes in the data. However, method B also has certain disadvantages. For example, in method B the magnitude of the threshold value is highly affected by the value of the range in the previous 7 days. This can result in smaller leaks after a series of larger events not being detected by this method (Figure (a), 26/10/2015-02/11/2015). This is due to the fact that the value of the threshold increases as large events are recorded. This problem can be mitigated by increasing the span of the moving average calculations to take more days into consideration when calculating the threshold. However, this will make the threshold less adaptable to changes in the system and create a larger lead in delay in the detection of the leaks. The anomaly detection algorithm (method C) can solve the problems associated with methods A and B. Figure (a) and (b) show the output from method C, indicating that it was able to detect the abnormal readings in the pressure and temperature data. Visual comparison of Figure (a) and (b) with Figure (a) and (b) shows that the more advanced algorithm (method C) was not affected by the issues discussed previously that affect methods A and B. In addition, the results from all of the algorithms show that the addition of the temperature difference ‘flags’ helped to differentiate pressure variations due to pipe failure from other pressure variations. This is clearly visible between 02/11/2015–23/11/2015 (Figures and ). In this period all the methods identified multiple abnormal variations in the relative pressure. Without confirmation from the temperature difference data this could have resulted in a significantly larger number of false positives. Table presents the performance characteristics of all methods. In addition, the performance characteristics of all methods without the use of temperature difference data (marked by *) is also presented in Table .
Figure 5. Flagged days (indicated by circular markers) from the anomaly detection algorithm (method C) for (a) the relative pressure range and (b) for the temperature difference range.
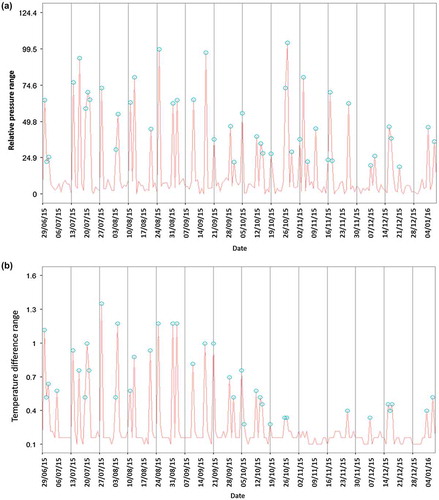
Table 1. Performance characteristics of each method.
Table shows that overall all methods had an accuracy of greater than 90% in the detection of leaks. This is very promising as it further validates the feasibility of using non-absolute readings for leak detection in pipes. Comparing the accuracy of the three different methods given in Table , shows that the proposed anomaly detection algorithm performed better, giving higher accuracy, sensitivity and specificity values, when compared to the other two methods. This was expected as this algorithm is less susceptible to errors caused by changes in the baseline values or sequential leaks. It can also be shown from Table that method C has a significantly better sensitivity compared to the other methods. Sensitivity of the leak detection methods is particularly important, as missing leak events can have costly or even catastrophic consequences. In addition, the results presented in Table show that method C also has no false positives. This is important for users of the algorithm as the number of false alarms can significantly affect their trust in the algorithm. Table also shows that by using the temperature difference measurements the rate of false positives in all methods is significantly reduced (or even eliminated). This shows that the temperature difference measurements can be used to differentiate abnormal changes in relative pressure from daily/systematic changes.
To further validate the performance of the proposed method, the anomaly detection algorithm results from a separate node (on the same pipe) were also analyzed. The soil temperature sensor of this node was placed approximately 30 cm above the pipe causing more daily temperature variations (due to it being closer to the surface of the soil). Despite the non-optimal arrangement of the temperature sensors in this node method C detected the anomalies with a 93.30% accuracy and no false positives. This is very promising and further validates the performance of the proposed method.
Conclusions
Low-cost wireless sensor systems are a potential way forward for monitoring such networks. This paper described the validation of an innovative monitoring system based on low cost (an order of magnitude cheaper than direct pressure sensors) relative pressure and temperature sensors. In particular, this paper introduced a novel anomaly detection algorithm for identifying leaks in water pipes that utilizes the low accuracy, but high resolution relative pressure and temperature measurements obtained from the wireless sensor system. The proposed method is based on detecting abnormal changes caused by a new fault/leak in the measured parameters and not pre-existing leaks unless they change. It is the first time this particular algorithm, which was originally developed for website traffic monitoring, has been applied to this application.
The performance of the proposed system has been validated using 6 months of data collected during deployment of the wireless sensor system on a water company test facility under realistic field conditions. The results from these trials showed that the proposed sensing method successfully recorded normal and abnormal variations in the operational parameters of the pipes. The performance of the novel leak identification method was tested using the combined relative measurements from the monitoring system, (i.e. relative pressure and temperature difference). This algorithm was compared to two more commonly used threshold-based methods. The results from this study showed that the adapted anomaly detection algorithm produced excellent detection rates, and the highest pipe failure detection accuracy (98.45%) and, importantly, the highest sensitivity (92.11%) with no false positives compared to the other methods. The performance of the proposed algorithm was further validated by analyzing the measurements collected by a separate node during the same period.
The results have clearly demonstrated the power and potential of this new algorithm for leak detection using the relative pressure readings combined with temperature measurements. This is now opening up the possibility of a large-scale roll-out of the new system as the large amounts of data can be analysed automatically. Only with this algorithm will water companies be able to fully utilize this system without putting an unnecessary strain on their data analysis unit and is the missing puzzle piece to this novel leak detection system.
Funding
This work was supported by the Engineering and Physical Sciences Research Council [EP/K504191/1].
Disclosure statement
No potential conflict of interest was reported by the authors.
Acknowledgments
The authors would like to acknowledge UK Water Industry Research (UKWIR) and the University of Birmingham who helped to fund the original research on the sensor system and also the source of the data used in this paper, which came from an Innovate UK and EPSRC-funded project (EP/ K504191/1 Smart Leakage Detection Pipes) and involved the University of Birmingham, Syrinix, Severn Trent Water, Bristol Water, Pipe Equipment Specialists and for part of the project, Morrison Utility Services.
References
- Al-Barqawi, H. , and T. Zayed , 2006. “Condition Rating Model for Underground Infrastructure Sustainable Water Mains”. Journal of Performance of Constructed Facilities ( May): 126–135.10.1061/(ASCE)0887-3828(2006)20:2(126)
- Cattani, M. , C. A. Boano , D. Ste , S. Kaltenbacher , M. Günther , K. Römer , D. Fuchs-hanusch , and M. Horn . 2017. “Adige: an E Icient Smart Water Network Based on Long-Range Wireless Technology.” In CySWATER ‘17 Proceedings of the 3rd International Workshop on Cyber-Physical Systems for Smart Water Networks , 3–6. Pittsburgh, Pennsylvania.
- Costello, S. B. , D. N. Chapman , C. D. F. Rogers , and N. Metje . 2007. “Underground Asset Location and Condition Assessment Technologies.” Tunnelling and Underground Space Technology 22 (5-6): 524–542.10.1016/j.tust.2007.06.001
- Covas, D. , and D. H. Ramos . 2010. “Case Studies of Leak Detection and Location in Water Pipe Systems by Inverse Transient Analysis.” Journal of Water Resources Planning and Management 136 (2): 248–257.10.1061/(ASCE)0733-9496(2010)136:2(248)
- Dunnicliff, J. , and G. E. Green . 1993. Geotechnical Instrumentation for Monitoring Field Performance . New York: John Wiley & Sons.
- Hamilton, S. , and B. Charalambous . 2007. “Wavelets for the Analysis of Transient Pressure Signals for Leak Detection.” Journal of Hydraulic Engineering 133 (11): 1274–1282.
- Hochenbaum, J. , O. S. Vallis , and A. Kejariwal . 2017. “Automatic Anomaly Detection in the Cloud via Statistical Learning.” arXiv:1704.07706v1.
- Kejariwal, A. 2015. Introducing Practical and Robust Anomaly Detection in a Time Series [online]. Twitter .
- Kleiner, Y. , and B. Rajani . 2002. “Forecasting Variations and Trends in Water-Main Breaks.” Journal of Infrastructure Systems 8 (4): 122–131.10.1061/(ASCE)1076-0342(2002)8:4(122)
- Lai, T. , W. Chen , and K. Li . 2012. “TriopusNet: Automating Wireless Sensor Network Deployment and Replacement in Pipeline Monitoring.” Proceedings of the 11th International Conference on Information Processing in Sensor Networks , 61–71.
- Liu, Z. , and Y. Kleiner . 2012. “State-of-the-Art Review of Technologies for Pipe Structural Health Monitoring.” IEEE Sensors Journal 12 (6): 1987–1992.10.1109/JSEN.2011.2181161
- Liu, Z. , and Y. Kleiner . 2013. “State of the Art Review of Inspection Technologies for Condition Assessment of Water Pipes.” Measurement 46 (1): 1–15.10.1016/j.measurement.2012.05.032
- Makar, J. M. , and Y. Kleiner . 2000. “Maintaining Water Pipeline Integrity.” AWWA Infrastructure Conference and Exhibition, 12 March, 2000, Baltimore, Maryland, 1–13.
- Mashford, J. , D. De Silva , D. Marney , and S. Burn . 2009. “An Approach to Leak Detection in Pipe Networks Using Analysis of Monitored Pressure Values by Support Vector Machine.” NSS 2009 - Network and System Security : 534–539.10.1109/NSS.2009.38
- Meniconi, S. , B. Brunone , M. Ferrante , C. Capponi , C. A. Carrettini , C. Chiesa , D. Segalini , and E. A. Lanfranchi . 2015. “Anomaly Pre-Localization in Distribution–Transmission Mains by Pump Trip: Preliminary Field Tests in the Milan Pipe System.” Journal of Hydroinformatics 17 (3): 377–389.10.2166/hydro.2014.038
- Misiunas, D. 2005. “Failure Monitoring and Asset Condition Assessment in Water Supply Systems.” PhD Thesis, Lund University, Sweden.
- Misiunas, D. 2008. “Failure Monitoring and Asset Condition Assessment in Water Supply Systems.” The 7th International Conference ‘Environmental Engineering’: Selected Papers, ICEE, Vilnius, 1–8.
- Rajani, B. , and Y. Kleiner . 2004. “Non-Destructive Inspection Techniques to Determine Structural Distress Indicators in Water Mains.” NRC Publications Archive (NPArC) .
- Rizzo, P. 2010. “Water and Wastewater Pipe Nondestructive Evaluation and Health Monitoring: A Review.” Advances in Civil Engineering 2010: 1–13.
- Sadeghioon, A. M. 2015. “Design and Development of Wireless Underground Sensor Networks for Pipeline Monitoring.” PhD Thesis, School of Mechanical Engineering, University of Birmingham, UK.
- Sadeghioon, A. M. , N. Metje , D. Chapman , and C. Anthony . 2014. “SmartPipes: Smart Wireless Sensor Networks for Leak Detection in Water Pipelines.” Journal of Sensor and Actuator Networks 3 (1): 64–78.10.3390/jsan3010064
- Sinha, S. K. , and M. A. Knight . 2004. “Intelligent System for Condition Monitoring of Underground Pipelines.” Computer-Aided Civil and Infrastructure Engineering 19: 42–53.10.1111/mice.2004.19.issue-1
- Sonyok, D. , B. Zhang , and J. Zhang . 2008. “Applications of Non-Destructive Evaluation (NDE) in Pipeline Inspection.” In Pipelines 2008, ASCE, 1–10.
- Stoianov, I. , L. Nachman , S. Madden , T. Tokmouline , and M. Csail . 2007. PIPENET: A Wireless Sensor Network for Pipeline Monitoring. In 6th International Symposium on Information Processing in Sensor Networks, IPSN 2007, ACM, New York, 264–273.10.1109/IPSN.2007.4379686
- Stoianov, I. , L. Nachman , A. Whittle , S. Madden , and R. Kling . 2008. “Sensor Networks for Monitoring Water Supply and Sewer Systems: Lessons from Boston.” Water Distribution Systems Analysis Symposium 2006: 1–17.
- Tayefi, P. , S. B. M. Beck , and R. A. Tomlinson . 2015. “Fatigue Failure of Polyethylene Electrofusion Joints Subject to Contamination.” Proceedings of the Society for Experimental Mechanics Series 5: 197–202.
- Vallis, O. , J. Hochenbaum , and A. Kejariwal . 2014. “A Novel Technique for Long-Term Anomaly Detection in the Cloud.” 6th USENIX Workshop on Hot Topics in Cloud Computing, Philadelphia, June 17–18.
- Vitkovsky, J. P. , A. R. Simpson , and M. F. Lambert . 2000. “Leak Detection and Calibration Using Transients and Genetic Algorithms.” Journal of Water Resources Planning and Management 126 (4): 262–265.10.1061/(ASCE)0733-9496(2000)126:4(262)
- Webber, J. S. , J. R. Covey , M. V. King , J. S. Webber , J. R. Covey , and M. V. King . 1989. “Asbestos in Drinking Water Supplied through Grossly Deteriorated a-C Pipe.” American Water Works Association 81 (2): 80–85.
- Whittle, A. , M. Allen , A. Preis , and M. Iqbal . 2013. “Sensor Networks for Monitoring and Control of Water Distribution Systems.” In The 6th International Conference on Structural Health Monitoring of Intelligent Infrastructure, 9–11 December, 2013, Hong Kong.
- Wu, Z. Y. , P. Sage , and D. Turtle . 2010. “Pressure-Dependent Leak Detection Model and Its Application to a District Water System.” Journal of Water Resources Planning and Management 136 (1): 116–128.10.1061/(ASCE)0733-9496(2010)136:1(116)