
Abstract
Hydraulic models of sewer systems are commonly used to predict the risk of urban flooding. However, suitable calibration datasets in flood conditions are scarce. The quantification of energy losses within manhole structures is a current source of uncertainty within such models. To address this gap, a scaled physical manhole model is used to quantify hydraulic energy losses during surcharging and non-surcharging conditions. Two different novel configurations were tested; (1) With and without the presence of a manhole lid; (2) With and without the presence of a shallow flow on the surface. Results showed that total head losses were found to increase in surcharging conditions. The presence of the lid also marginally increased total head losses. The datasets are used to assess the performance of a numerical urban flood model (SIPSON) and comparisons highlighted that SIPSON tends to overestimate energy losses in surcharging conditions.
1. Introduction
Urban flood events frequently involve interaction between free surface flow over an urban area and piped flows within sewer or storm water networks. During flood conditions, surcharging flow can pass from the sewer network to the surface flow via hydraulic structures such as manholes, gullies and gutters. Current climatic (IPCC Citation2014; Tripathi et al. Citation2014), economic and social trends (Braud et al. Citation2013; Huong and Pathirana Citation2013; Jung, Chang, and Moradkhani Citation2011; Saghafian et al. Citation2008; Suriya and Mudgal Citation2012) suggest that the frequency, magnitude and cost of flooding are likely to increase in the future. Urban flood models are commonly used to evaluate the risk of flooding due to sewer surcharge following intense rainfall (Martins, Leandro, and Djordjevic Citation2016; Martins et al. Citation2017). Such models commonly utilize the St Venant Equations to describe the motion of fluids in sewers and enclosed channel networks. Within the sewer drainage system the primary direction of flow is defined by the network, hence a 1D form of the Equations is used. Such hydraulic models rely on empirically derived parameters (Djordjevic et al. Citation2005; Rossman Citation2006) to represent local energy (head) losses at junctions and urban drainage features such as manholes (Hare Citation1983; Howarth and Saul Citation1984; Lindvall Citation1984; Pedersen and Mark Citation1990). Local head losses in manholes are caused by a range of factors including the retardation of the fluid just upstream the entrance, in partially filled pipes; sudden expansion of the flow at the entrance; resonance oscillations in the manhole or the acceleration of the fluid at the outlet (Asztely Citation1995).
Manhole head losses can be estimated via the robust calibration of urban drainage models, or more commonly, using experimental results obtained from experiments on physical models. Marsalek (Citation1987) reported that head losses in straight line manholes were proportional to the velocity head of the inlet flow. However, further studies have pointed out the complex nature of energy losses in manholes due to the almost infinite variety of geometrical and hydraulic conditions that can occur (O’Loughlin and Stack Citation2002). Parameters that have been found to affect head losses in manholes include: 1) depth ratio between the upstream branches and the downstream channel (Hsu and Lee Citation1998; Taylor Citation1944); 2) upstream and downstream hydraulic conditions (i.e. subcritical or supercritical), (Del Giudice, Gisonni, and Hager Citation2000; Gargano and Hager Citation2002; Hager and Gisonni Citation2005; Zhao, Zhu, and Rajaratnam Citation2006); 3) bed discordance over the manhole junction (Biron, Best, and Ror Citation1996); 4) presence of a lateral pipe and variation in flow rates between the main pipe and lateral pipe (Ramamurthy and Zhu Citation1997; Zhao, Zhu, and Rajaratnam Citation2006); 5) the joining angle between any lateral pipes and the main pipe (Pfister and Gisonni, Citation2014); 6) ratio between water depth in the manhole and pipe diameter (Ramamurthy and Zhu Citation1997); 7) ratio between pipe diameter and manhole diameter (Ramamurthy and Zhu Citation1997); 8) existence of sump inside the manhole and benching effects (Arao, Kusuda, and Moriyama Citation2011); 9) other flow characteristics, e.g. the flowrates in the inlet pipes, whether the pipes are running gull or part-full, supercritical or subcritical, the effect of tail water level and the water level in the manhole (O’Loughlin and Stack Citation2002).
Where multiple flows bifurcate or combine at manholes energy losses have been investigated in 90° bend junctions (Marsalek and Greck Citation1988); in 90° combining junctions (Marsalek Citation1985; Wang et al. Citation1998); in a bend manhole for combined sewer systems considering typical relative curvature and deflection angles of 45° and 90° (Del Giudice, Gisonni, and Hager Citation2000); in a 45° junction manhole (Del Giudice and Hager Citation2001); for a 25.8° combining junction with two inflows and one outflow (Zhao, Zhu, and Rajaratnam Citation2006). Oka and Ito (Citation2005) determined energy losses coefficients for smooth, sharp-edged tees of circular cross section for five branch angles which ranges from 45° to 135°. Pfister and Gisonni (Citation2014) presented an extensive experimental campaign on a physical model to investigate the local head losses of combining flows at 45° and 90° junction manholes on circular conduits, with various diameters and in the presence of sub and supercritical approaching flows. The results and analysis along with the application of the basic principle of mass, energy and momentum conservation provide a theoretical basis for the prediction of energy losses at junction manholes.
However, despite the important application of hydraulic models to urban flood events, local energy losses in manholes during sewer to surface surcharge events have yet to be investigated. In addition the effect of manhole lids on energy losses in conditions where the manhole is flowing full are also not understood. The lack of reliable data sets during flood events means direct calibration of energy losses in surcharging flows is difficult (Hunter et al. Citation2008) and appropriate energy losses coefficients associated with these hydraulic conditions have not been fully identified. A lack of understanding of head losses in drainage systems can lead to inaccurate modelling and flood hazard maps (Arao et al. Citation2012) and other drainage infrastructure problems such as the blowout of manhole covers (Guo and Song Citation1991; Zhou, Hicks, and Steffler Citation2002).
An experimental facility has been developed at the University of Sheffield (Rubinato et al. Citation2017) to simulate the interaction between surface and sewer flows at manhole interaction points. The aim of this work is to provide new empirical results of energy losses through in line manholes during sewer-surcharge events. Various inflow and surcharge rates are considered and tests include conditions with and without the application of a manhole lid and the interaction of flow escaping the manhole with shallow flow depth on the surface. In order to evaluate the performance of commonly used numerical urban flood modelling tools, experimental conditions and energy loss coefficients are simulated within an hydraulic model, SIPSON, and the resulting performance is compared to experimental (pressure) data recorded within the facility.
2. Overview
2.1. Quantifying energy losses in sewer to surface surcharging conditions
Surcharging conditions occur when the sewer system has reached its maximum capacity and there is a consequent flow exchange between sewer and floodplain. For surcharge to occur the hydraulic head of the sewer flow must be greater than the manhole crest or, if present, the hydraulic head of the surface flow (Rubinato et al. Citation2017). In this study we consider that this condition is analogous to a bifurcation, in which the flow splits into two streams, one continuing within the sewer, and one existing to the surface (i.e. similar to a junction condition as described by Pfister and Gisonni Citation2014; Zhao, Zhu, and Rajaratnam Citation2006 amongst others). In the case of a relatively wide surface channel in respect to the piped sewer system, the difference in hydraulic head of the surface flow upstream and downstream of the manhole will be small. Hence considering the sewer inflow in steady flow conditions, the energy balance Equation over the control volume can be defined as:
where g is the acceleration of gravity (m/s2), Q1 is the sewer inlet flow (m3/s), Q3 is the sewer outlet flow (m3/s), Qe is the flow surcharge rate (m3/s, equivalent to Q1-Q3), ΔH is the total energy loss over the control volume and H1, H2 and H3 (m) are the hydraulic heads of the upstream pipe flow, surface flow and downstream pipe flow, respectively. Given that only the pipe flow is pressurized, these can be expressed as
Where ui is the mean flow velocity over the cross section flow at the reference point, i (m/s), pi/ρg, is the pressure head at the reference point, i (m), h2 is the surface flow depth and zi is the flow elevation above datum at each reference point. Rearranging Equation (1), the total energy loss can be defined as:
In case of surcharge event (Qe>0), with both the inlet pipe and the outlet pipe pressurized and given the assumption that frictional losses are negligible over the control volume (Ramamurthy, Carballada, and Tran Citation1988; Pfister and Gisonni Citation2014; Zhao, Zhu, and Rajaratnam Citation2006, Citation2008) correspondent energy loss coefficients can be defined as:
Similar to previous studies on junction manholes (Pfister and Gisonni Citation2014; Zhao, Zhu, and Rajaratnam Citation2006), the total energy loss ΔH and hence energy loss coefficients K13, K12 and KTOT can be determined using Equations (1)-(8) given knowledge of hydraulic head over the manhole structure. In conditions where surcharging flow is not present, Equations (1)-(8) can be simplified such that KTOT = K13.
3. Methodology
This section presents the experimental facility utilized for collecting the data, hydraulic conditions for the tests conducted and a description of the numerical flood model, SIPSON.
3.1. Experimental setup
The experimental facility was constructed to represent an equivalent real surface/sewer system at 1/6 geometrical scale (Rubinato et al. Citation2017). It is composed of a surface (slope 1:1000) and a sewer system each with independent flow control (). The sewer system (no slope) is linked to the urban surface via a single in-line manhole of 240 mm inner diameter; the height difference, z, from the invert of the pipe system to the manhole crest is 0.478 m (). The pipe network is characterized by 75 mm inner diameter pipework (simulating a 450-mm pipe at full scale). The urban surface is 8.2 m long, 4 m wide and has side walls of 0.10-m height. Inlet and outlet tanks are fitted upstream and downstream of the urban surface model. The inlet tank of the surface (dimensions L = 4 m, W = 0.3 m, H = 0.35 m) receives water from a 75 mm pipe connected to the main laboratory header tank, which feeds into the sewer and surface inlets and re-circulate water within the entire system. Inlet flow to the surface and sewer systems are controlled via upstream butterfly valves (Vi) of 75 mm internal diameter. To measure flow rates 75 mm internal diameter electro-magnetic (MAG) flow meters are installed at the inlets and the outlets of the facility. The sewer system includes also a downstream gate valve (Vd) fitted in proximity of the outlet. This valve is located 6550 mm from the centerline of the manhole. The valve can be set to a range of ‘closure ratios’ from 48% to 86% as well as fully open.
Figure 1. Top view of the model. F1, F2, F3 indicate respectively the flowmeters used to measure Q1, Q2, Q3. Vd is the valve downstream fitted within the sewer pipe used to restrict the sewer capacity for the second set of tests described in Section 3.1.2. All dimensions in meters.
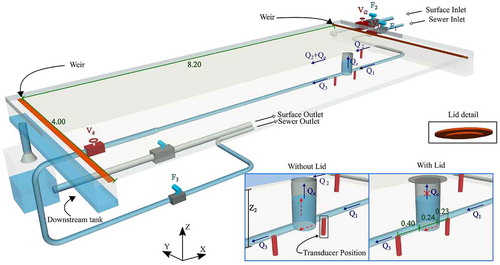
To monitor pressure within the experimental facility, pressure transducers (Gems series 5000) have been installed and they are located within the sewer system (), one upstream (350 mm from the centerline of the manhole), to measure p1; one downstream (520 mm from the centerline of the manhole) to measure p3, and an additional transducer within the base of the manhole, in order to monitor water level within the manhole structure (hm). Flow depth (h2) on the urban surface is measured via a pressure sensor fitted upstream of the manhole (460 mm from the centerline of the manhole) (). Pressure head and flow depth values (p1/ρg, p3/ρg and h2) used to derive energy loss coefficients, (2)-(8), are obtained directly from these readings. Mean velocity for the calculation of velocity head in the sewer network is obtained by dividing flow rate running through the pipe by the cross sectional area. The same procedure is used to quantify the velocity head of the surface flow based on the measured flow depth and discharge.
The maximum flow rate within the sewer system is 11 l/s. By using the Reynolds Similitude (Re), this flow rate corresponds to ≈70 l/s in a real-pipe system, up to a max Reynolds Number of 190000.
Velocities on the urban surface were quantified to be between 0.1 and 0.25 m/s which corresponds to a real-scale velocity field of 0.245–0.625 m/s based on Froude similitude. This is within the range that might be expected for a shallow water running over an urban surface during a flood event, and is similar to the range used by (Djordjevic et al. Citation2013) for the physical modelling of gully performance during flood events.
For tests conducted with the lid on the top of the manhole, to avoid lifting the lids are fixed within the system via the application of a 10.3 kg weight. In this condition a small amount of flow is able to escape via the edges of the lid.
3.1.1. Calibration of pressure transducers and flow meters
Each pressure sensor has been calibrated to determine the relationship between pressure and electrical output signal. All calibrations found were linear with a minimum R2 of 0.999. Expected maximum errors in pressure readings can be estimated based on the maximum observed variation between the measured values and the calibration relationships. The maximum expected measurement error is ±0.72 mm in the sewer pipe and ±0.109 mm on the floodplain.
Following a similar procedure, a calibration was completed to determine the relationship between the flow valve input Vi1 and Vi2 (mA) () set by the operator (which directly controls the valve opening) and the flow rates Q1, Q2 and Q3 (l/s) as recorded by the flow meters at F1, F2, F3, respectively (). A verification set of tests has been conducted to compare the flow rate measured by the magnetic flowmeters after having applied the liner interpolation against the values provided by the laboratory measurement tank. All values recorded within this set of verification tests were within 2.5% of measurement tank values.
3.1.2. Hydraulic testing conditions
A series of steady state experimental tests was completed to estimate energy losses through a manhole. Two main sets of tests were completed to investigate the effects of a manhole lid (Set 1) and the effects of interaction between flow surcharging via the manhole and a uniform flow depth on the surface (Set 2). Tests were conducted in both surcharging (Qe > 0) and non-surcharging (Qe = 0) conditions.
Set 1: A set of duplicate tests were conducted in which sewer inlet flow and surcharge rate was varied (Qe ranged between 0 and 2.59 l/s), with (WL) and without (WoTL) the presence of a lid described above. Surface inflow (Q2) was set as zero in all cases and the downstream sewer valve was set at a constant position (Vd = 48%).
Set 2: Tests were completed with two different flow conditions on the surface in combination with varying degree of closure of the downstream sewer valve (Vd presented in section 3.1) and surcharge rate (Qe ranged between 0 and 7.28 l/s). All tests were conducted without lid in place.
For all the tests conducted, the sewer pipe entering the manhole was flowing full and under pressure, and the inflow was turbulent.
3.2. Numerical setup – SIPSON
After determining the range of head loss coefficients for the tests described above a fully dynamic numerical model, SIPSON (Djordjevic et al. Citation2005) was tested based on the hydraulic conditions listed in section 3.1.2. The following subsection describes the SIPSON model.
3.2.1. Sipson
SIPSON solves the full dynamic Saint-Venant Equations in the pipes:
where z is the water level, Q is the flow rate in the pipe, A is the cross-sectional area, g is the gravity acceleration, B is the water surface width, Sf is the bed friction. These values are computed at the cross-section at position x and time t. The mass and energy conservation are computed at each node through:
Where zn the surface elevation in the node, u the node cross-sectional average velocity, the area of the node is An, the external inflow Qn, and the local energy loss coefficient is K. A Preissmann four-point implicit Finite differences scheme is used with the conjugate gradient method to solve the system of Equations (9), (10) and (11). The scheme is unconditionally stable with time step limited only to 4 × ∆x/∆t. For surcharging pipes, the Preissmann open-slot is used (Preissmann Citation1961). Roughness is computed using manning’s roughness formula and coefficients. The time step used was 0.1 [s].
3.2.2. Localized losses
SIPSON calculates minor losses inside the manhole using the node cross sectional velocity (11). It also subdivides the pipes in several smaller sections and computes the head inside the nodes assuming that the representative velocity is the one at the cross section of the node instead of the up and downstream tubes. The cross sectional velocity assumption can be considered true for a very unidirectional flow, however for highly turbulent flows inside the manholes it may not be appropriate, hence errors may be expected.
4. Results and Discussions
This section presents energy losses and energy loss coefficients for the tests described in section 3.1.2. The effect of both the application of a manhole lid and of shallow surface flow on energy losses is analysed. Finally, coefficients are incorporated into SIPSON and resulting numerical simulations are presented. The performance of the models is evaluated based on measured and predicted pressure head values within the experimental facility (upstream and downstream of the manhole) as well as measured and predicted water levels at the manhole.
4.1. Results (Set 1)
Experimentally determined hydraulic heads losses (H1-H3), (H1-H2) and ΔH are plotted in against inflow velocity head (u12/2 g) components for tests conducted with (WL) and without the lid (WoTL) in place in both surcharging and non-surcharging conditions. A linear relationship between head losses and velocity head of the sewer in flow can be observed. Head loss coefficients (K) can hence be determined based on the slope of the regression lines fitted to the experimental data (). These coefficients and their confidence limits (R2 > 0.986 for all the cases) are given in . It is noted that non-surcharging K13 values are slightly higher than previous studies on losses for flow within in-line manholes (e.g. Marsalek Citation1987), this may be due to the specific geometrical setup of the facility or the relatively high range of manhole flow depths tested. In all surcharging cases K12 is higher than K13 indicating higher energy losses in the flow stream that transfers to the surface when compared with the stream that travels through the sewer. As expected, in non-surcharging conditions, energy loss coefficients are unaffected by the presence of a manhole lid. However in surcharging conditions, the coefficients (and hence energy losses) are lower when the lid is removed (from K13,SWL = 0.699 to K13,SWoL = 0.559; from K12,SWL = 3.865 to K12,SWoL = 1.269 and from KTOT,SWL = 0.933 to KTOT,SWoL = 0.836). This suggests higher turbulent energy losses in conditions where the flow is forced past a lid than when compared to a condition in which flow can move freely to the surface. As expected, this is most evident when considering the sewer to surface coefficient (K12), only a small difference is observed when considering the sewer pipe (K13) and overall energy loss coefficient (KTOT). In the latter case this is due to the relative magnitude of the flow moving to the surface vs through the sewer pipe. Overall energy losses, KTOT, were also observed to be higher in surcharging conditions than non-surcharging conditions (both with and without the application of the lid). This is expected due to the additional energy losses encountered when the flow moves from sewer to surface.
Figure 2. Experimentally determined hydraulic heads losses ΔH13, ΔH12 and ΔH against velocity head components calculated for SET 1 (above) and SET 2 (below) tests. For SET 1, WL-NS = With lid and no surcharge condition; WoTL-NS = Without lid and no surcharge condition; WL-S = With lid and surcharge condition; WoTLS = Without lid and surcharge condition. For SET 2 tests were based on different Vd closure rate and different surface flow conditions.
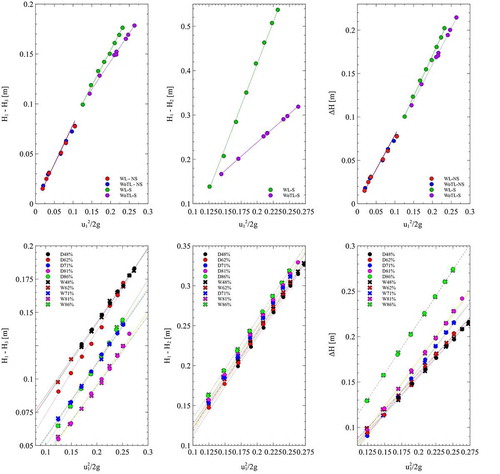
Table 1. Energy losses coefficients calculated for SET 1 tests (NS = non surcharge, S = surcharge, WL = with lid, WoTL = without lid) and for SET 2 tests.
4.2. Results (Set 2)
Experimentally determined hydraulic head losses (H1-H3), (H1-H2) and ΔH are plotted in for SET 2 tests. A linear relationship between head losses and velocity head of the sewer inlet flow can be observed in all cases. Head loss coefficients (K13, K12 and KTOT) are determined based on the slope of the regression lines fitted to the experimental data. These coefficients and their confidence limits (R2>0.993 for all the cases) are given in .
Results show that the energy loss coefficient K13 decreases as the downstream valve is closed, however when the closure is higher than 81%, of the total diameter of the pipe, there is an increase of instability (K13 for V = 86% > K13 for V = 81%) which may be due to the high turbulent flow that is forced to escape the sewer system through the manhole. Results also show that K12 is not dependent on the ratio of closure of the pipe or the flow conditions on the surface. Results show that KTOT gradually increases as the downstream valve is closed until the ratio of closure of the pipe (Vd) reaches a specific threshold, 86%, very close to the full closure of the entire pipe capacity. In this case, KTOT increases significantly. This behaviour is a consequence of the increasing proportion of flow which is transferred to the surface encountering higher turbulent losses as the flow moves from the sewer into the surface.
4.3. Comparison between SIPSON and experimental data
The pressure datasets obtained from SET 1 were used to evaluate the performance of SIPSON. The experimental facility was replicated within the numerical model and the scheme used is displayed in . shows the location of each secondary head loss parameter (L1, L2, L3, L4, L5, L6) applied within the numerical models. L1 (0.36) and L2 (0.36 × 2) where obtained based on the head loss for the used diameter for a 90° bend PVC non flanged pipe (Lencastre Citation1996), L3 (NSWL = 0.757, NSWoTL = 0.760, SWL = 0.699, SWoTL = 0.559) from the experimental data obtained from the SET 1 and presented in , L4 (0.0625) from the losses in sudden expansions as presented by (Idel’Cik, Citation1969), L5 (1.5) from gate valve losses as presented by (Puppini Citation1947), and L6 (1.269) based on the coefficients obtained for loss for the surcharge using SET 2 data (K12).
Figure 3. Experimental scheme replicated within the numerical model SIPSON (top) and experimental (Set 1) vs numerical results for surcharging (S, right of dashed line) and no-surcharging conditions (NS, left of dashed line), without and with lid application on the top of the manhole. Error between experimental and numerical results (Hexperimental-HSIPSON) plotted on secondary axis.
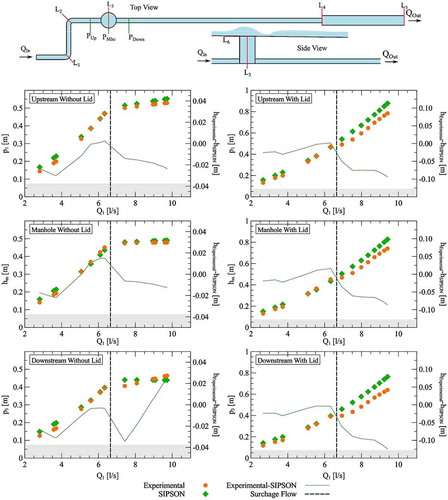
shows the experimental data (SET 1 tests) of pressure head upstream and downstream of the manhole and flow depth in the manhole against the numerical predictions from SIPSON using the coefficients presented above and measured inflow data. The error between numerical and experimental observations is plotted on the secondary axis. Overall a good agreement between experimental and numerical results is shown as confirmed by the RMSE values (between numerical model and the experimental results) quantified for each scenario (R2 > 0.982 in all the cases as displayed in ).
Table 2. Correlation between numerical and experimental data using R2 and RMSE (WL = with lid, WoTL = without lid).
For non-surcharging conditions, SIPSON generates pressure head values that follow the trend of the experimental results both upstream, within and downstream of the manhole with a magnitude that only marginally differs from the experimental results. For the non-surcharging conditions, discrepancies are very close, between 0 and 0.04 m without the application of the lid on the top of the manhole and within the range 0–0.025 m with the lid application. As expected because there is no flow escaping the manhole the presence of the lid does not influence the hydraulic conditions. When considering surcharging conditions, SIPSON tends to overestimate experimental pressure results as displayed in . Dissimilarities are greater for tests conducted with the application of the lid (up to 0.1 m) whilst in no-lid cases the deviations between experimental and numerical do not exceed 0.04 m. This demonstrates how the extra complexity of bifurcating flows impacts the accuracy of the numerical modelling results.
5. Summary and Conclusions
An experimental facility was used to quantify energy losses coefficients associated with a scale model manhole that links a sewer system and a floodplain surface. A framework for the quantification of energy losses is presented and the effects of a manholes lids and interacting surface flows have been examined over a range of flow conditions.
Tests have shown that total energy losses in surcharging conditions are increased relative to non-surcharging conditions. The flow stream that travels from the sewer to surface encounters higher energy losses than the flow stream that travels through the sewer. The presence of a manhole lid considerably increases sewer to surface energy loss coefficients, likely due to the increased turbulent energy losses as pressurized flow escapes from the manhole lid. Energy loss coefficients for sewer to surface flow are approximately two times the energy loss coefficients through the straight manhole without the application of the lid and approximately five times the energy loss coefficients through the straight manhole with the application of the lid. Due to the relative magnitude of flows passing onto the surface and through the sewer, the effect a lid on overall energy loss coefficients is small but noticeable.
Tests also showed that the sewer to surface energy loss coefficient is unaffected by both the presence of surface flow and downstream sewer hydraulic conditions, and has hence found to be constant for all conditions tested. Sewer energy loss coefficients and total energy loss coefficients were found to be independent of surface flow conditions but increased as the downstream restriction was closed. In this case the overall head losses become higher as result of an increasing proportion of the flow being pushed onto the surface, encountering higher turbulent losses in the process. Given the behaviour of the observed coefficients, for a given manhole structure and given knowledge of energy loss coefficient and sewer inflow it is possible to quantify sewer surcharge rate (Qe) in steady flow conditions based on the framework set out in section 2. This represents a potential alternative for the quantification of sewer to surface flow exchange that is commonly used with urban flood models (Rubinato et al., Citation2017) based on the weir/orifice equations. However the behaviour and variability of these energy loss coefficients over a range of other manhole structures with different shaft lengths and geometries is not currently known.
When replicating experimental conditions within the SIPSON numerical model despite a good overall representation of the observed data, the performance of the model was found to deteriorate in the more complex surcharging flow conditions.
The limitations of this study should be noted. First, the present investigation has been restricted to a straight-flow-through manhole of a fixed depth with fully submerged inlets and outlet pipes of equal diameter. Many more cases and conditions remain to be investigated (e.g. different manhole lids and blockages effects) to explore the behaviour and variability of the energy loss coefficients. Second, unsteady events have not yet been considered, further research should therefore consider how energy losses are affected by rapidly changing flow rates which are common in urban flooding situations.
Funding
This research was funded by EPSRC through the grant with the reference EP/K040405/1. The experiments were conducted in the Water Laboratory of the Civil and Structural Engineering Department of the University of Sheffield.
Disclosure statement
No potential conflict of interest was reported by the authors.
Supplemental data
Supplemental material for this paper is available online at https://doi.org/10.1080/1573062X.2018.1424217
Supplementary Material
Download PDF (195.6 KB)Related Research Data
References
- Arao S., T. Kusuda, and K. Moriyama. 2011. “Energy Loss at Three-Way Circular Drop Manhole under Surcharge Flow.” 12th International Conference on Urban Drainage, Porto Alegre, Brazil.
- Arao, S., T. Kusuda, K. Moriyama, S. Hiratsuka, J. Asada, and N. Hirose. 2012. “Energy Losses at Three-Way Circular Drop Manholes under Surcharged Conditions.” Water Science and Technology 66 (1): 45–52. doi:10.2166/wst.2012.164.
- Asztely, M. 1995. Literature Review of Energy Losses in Manholes, Report Series B: 60, ISSN 0348–1069. Department of Hydraulics, Chalmers University of Technology, Goteborg.
- Biron, P., J. L. Best, and A. G. Ror. 1996. “Effects of Bed Discordance on Flow Dynamics at Open Channel Confluences.” Journal of Hydraulic Engineering 122 (12): 676–682.10.1061/(ASCE)0733-9429(1996)122:12(676)
- Braud, I., P. Breil, F. Thollet, M. Lagouy, F. Branger, C. Jacqueminet, S. Kermadi, and K. Michel. 2013. “Evidence of the Impact of Urbanization on the Hydrological Regime of a Medium-Sized Peri-Urban Catchment in France.” Journal of Hydrology 485: 5–23.10.1016/j.jhydrol.2012.04.049
- Djordjevic, S., M. Ivetic, C. Maksimovic, and D. Prodanovic. 2005. “SIPSON Simulation of Interaction between Pipe Flow and Surface Overland Flow in Networks.” Water Science & Technology 52 (5): 275–283.
- Djordjevic, S., A. J. Saul, G. R. Tabor, J. Blanksby, I. Galambos, N. Sabtu, and G. Sailor. 2013. “Experimental and Numerical Investigation of Interactions between above and below Ground Drainage Systems.” Water Science and Technology 67: 535–542. doi:10.2166/wst.2012.570.
- Del Giudice, G., and W. H. Hager. 2001. “Supercritical Flow in 45° Junction Manhole.” Journal of Irrigation and Drainage Engineering 127 (2): 100–108.10.1061/(ASCE)0733-9437(2001)127:2(100)
- Del Giudice, G., C. Gisonni, and W. Hager. 2000. “Supercritical Flow in Bend Manhole.” Journal of Irrigation and Drainage Engineering 126 (1): 48–56.10.1061/(ASCE)0733-9437(2000)126:1(48)
- Gargano, R., and W. Hager. 2002. “Supercritical Flow across Sewer Manholes.” Journal of Hydraulic Engineering 128 (11): 1014–1017.10.1061/(ASCE)0733-9429(2002)128:11(1014)
- Guo, Q., and C. Song. 1991. “Drop Shaft Hydrodynamics under Transient Conditions.” Journal of Hydraulic Engineering 117 (8): 1042–1055.10.1061/(ASCE)0733-9429(1991)117:8(1042)
- Hager, W. H., and C. Gisonni. 2005. “Supercritical Flow in Sewer Manholes.” Journal of Hydraulic Research 43: 660–667. doi:10.1080/00221680509500385.
- Hare C. M. 1983. “Magnitude of Hydraulic Losses at Junctions in Piped Drainage Systems.” Civil Engineering Transactions, Institute of Civil Engineers CE25: 71–77.
- Howarth D.A., and A.J. Saul. 1984. “Energy Loss Coefficient at Manholes.” Proceedings of the 3rd International Conference on Urban Storm Drainage, June 4-8, 127–136. Gothenburg, Sweden.
- Hsu, C. C., and W. J. Lee. 1998. “Flow at 90° Equal-Width Open-Channel Junction.” Journal of Hydraulic Engineering 124: 186–191.10.1061/(ASCE)0733-9429(1998)124:2(186)
- Hunter, N. M., P. D. Bates, S. Neelz, G. Pender, I. Villanueva, N. G. Wright, D. Liang, et al. 2008. “Benchmarking 2D Hydraulic Models for Urban Flooding.” Proceedings of the ICE - Water Management 161: 13–30. doi:10.1680/wama.2008.161.1.13.
- Huong, H., and A. Pathirana. 2013. “Urbanization and Climate Change Impacts on Future Flooding in Can Tho City.” Vietnam, Hydrology and Earth System Sciences 17: 379–394.10.5194/hess-17-379-2013
- Idel’Cik, I. E. 1969. Memento des pertes de charge. Collection de la Direction des Etudes et Recherches d’Electricite de France. Paris: Eyrolles.
- IPCC, Summary for Policymakers, Climate Change. 2014. “Impacts, Adaptation and Vulnerability - Contributions of the Working Group II to the Fifth Assessment Report.” 2014: 1–32. doi:10.1016/j.renene.2009.11.012.arXiv:arXiv:1011.1669v3.
- Jung, I., H. Chang, and H. Moradkhani. 2011. “Quantifying Uncertainty in Urban Flooding Analysis Considering Hydro-Climatic Projection and Urban Development Effects.” Hydrology and Earth System Sciences 15: 617–633.10.5194/hess-15-617-2011
- Lencastre A. 1996. Hidraulica Geral (Portuguese), Lisbon. ISBN:9789729585906.
- Lindvall G. 1984. Head Losses at Surcharged Manholes with a Main Pipe and a 90 Degrees Lateral. In Proceedings of the 3rd International Conference on Urban Storm Drainage, June 4-8, 137–146, Gothenburg, Sweden.
- Marsalek, J. 1985. Head Losses at Selected Sewer Manholes. Burlington: National Water Research Institute, Canada Centre for Inland Waters.
- Marsalek, J. 1987. Head Losses at Junction of Two Opposing Lateral Sewers. 4th International Conference on Urban Storm Drainage. Lausanne, Switzerland.
- Marsalek, J., and B. Greck. 1988. “Head Losses at Manholes at 90° Bend.” Canadian Journal of Civil Engineering 15: 851–858.10.1139/l88-110
- Martins, R., J. Leandro, and S. Djordjevic. 2016. “Influence of Sewer Network Models on Urban Flood Damage Assessment Based on Coupled 1D/2D Models.” Journal of Flood Risk Management.
- Martins R., J. Leandro, A. Chen, and S. Djordjevic. 2017. “A Comparison of Three Dual Drainage Models: Shallow Water Vs Local Inertial Vs Diffusive Wave.” Journal of Hydroinformatics 19 (3): 331–348.
- O’Loughlin G., and B. Stack. 2002. Algorithms for Pit Pressure Changes and Head Losses in Stormwater Drainage Systems, 9th International Conference on Urban Drainage, Portland, United States.
- Oka, K., and H. Ito. 2005. “Energy Losses at Tees with Large Area Ratios.” Journal of Fluid Engineering 127: 110–116.10.1115/1.1852475
- Pedersen, F. B., and O. Mark. 1990. “Head Losses in Storm Sewer Manholes: Submerged Jet Theory.” Journal of Hydraulic Engineering ASCE 116 (11): 1317–1328.10.1061/(ASCE)0733-9429(1990)116:11(1317)
- Pfister M., and C. Gisonni. 2014. “Head Losses in Junction Manholes for Free Surface Flows in Circular Conduits.” Journal of Hydraulic Engineering 140. doi:10.1061/(ASCE)HY.1943-7900.0000895.
- Preissmann A. 1961. “Propagation des intumescences dans les canaux et rivì eres (in French).” In 1er congrès de l’ Association Française de Calcul. Grenoble, France.
- Puppini, U. 1947. Idrulica, Nicola Zanichelli. Bologna: Editore.
- Ramamurthy, A. S., and W. Zhu. 1997. “Combining Flows in 90 Junctions of Rectangular Closed Conduits.” Journal of Hydraulic Engineering 123: 1012–1019.10.1061/(ASCE)0733-9429(1997)123:11(1012)
- Ramamurthy, A. S., L. B. Carballada, and D. M. Tran. 1988. “Combining Open Channel Flow at Right Angled Junctions.” Journal of Hydraulic Engineering 1449–1460.10.1061/(ASCE)0733-9429(1988)114:12(1449)
- Rossman L. 2006. “EPA SWMM 5.0 Quality Assurance Report: Dynamic Wave Flow Routing.” Technical Report September. Environmental Protection Agency.
- Rubinato, M., R. Martins, G. Kesserwani, J. Leandro, S. Djordjevic, and J. Shucksmith. 2017. “Experimental Calibration and Validation of Sewer/Surface Flow Exchange Equations in Steady and Unsteady Flow Conditions.” Journal of Hydrology 552: 421–432. doi:10.1016/j.jhydrol.2017.06.024.
- Saghafian, B., H. Farazjoo, B. Bozorgy, and F. Yazdandoost. 2008. “Flood Intensification due to Changes in Land Use.” Water Resource Management 22: 1051–1067.10.1007/s11269-007-9210-z
- Suriya, S., and B. Mudgal. 2012. “Impact of Urbanization on Flooding: The Thirusoolam Sub Watershed-a Case Study.” Journal of Hydrology 412–413: 210–219.10.1016/j.jhydrol.2011.05.008
- Taylor, E. 1944. “Flow Characteristics at Rectangular Open Channel Junctions.” Transactions of the American Society of Civil Engineers 109: 893–902.
- Tripathi, R., S. Sengupta, A. Patra, H. Chang, and I. W. Jung. 2014. “Climate Change, Urban Development, and Community Perception of an Extreme Flood: A Case Study of Vernonia, Oregon, USA.” Applied Geography 46: 137–146.10.1016/j.apgeog.2013.11.007
- Wang, K. H., T. G. Cleveland, C. Towsley, and D. Umrigar. 1998. “Head Loss at Manholes in Surcharged Sewer Systems.” Journal of the American Water Resources Association 34: 1391–1400. doi:10.1111/j.1752-1688.1998.tb05439.x.
- Zhao, C. H., D. Z. Zhu, and N. Rajaratnam. 2006. “Experimental Study of Surcharged Flow at Combining Sewer Junctions.” Journal of Hydraulic Engineering 132: 1259–1271.10.1061/(ASCE)0733-9429(2006)132:12(1259)
- Zhao, C. H., D. Z. Zhu, and N. Rajaratnam. 2008. “Computational and Experimental Study of Surcharged Flow at a 90 Combining Sewer Junction.” Journal of Hydraulic Engineering 134: 688–700.10.1061/(ASCE)0733-9429(2008)134:6(688)
- Zhou, F., F. Hicks, and P. Steffler. 2002. “Observations of Air-Water Interaction in a Rapidly Filling Horizontal Pipe.” Journal of Hydraulic Engineering 128 (6): 625–634.