
ABSTRACT
Green infrastructure strategies are often cited as best practice for urban water management; however, limited research has been undertaken to compare intervention effectiveness during moderate to extreme intensity rainfall events which are typically responsible for surface water flooding. This research responds to this through applying a cellular automata-based rapid scenario screening framework to predict the flood management performance of green infrastructure strategies across an urban catchment in Melbourne City Centre (Australia). Key findings indicate an intensive application of green infrastructure could substantially reduce flood depth and velocity in the catchment but that residual risk remains, particularly during extreme flood events. The best performing intervention strategy in the study area was found to be catchment-wide decentralised rainwater capture. The research also evidences the utility of rapid scenario screening tools to complement existing flood modelling approaches through screening management strategies, exploring scenarios and engaging a wide range of multi-disciplinary stakeholders.
Introduction
Intensive development in urban centres can result in them becoming particularly susceptible to flooding during intense rainfall, which can lead to extensive damage and disruption. Engineers, architects and planners must, therefore, manage surface water runoff in urban areas to minimise a population’s exposure to flooding hazards. Runoff is influenced by a number of factors, including the volume and intensity of rainfall, the percentage of impermeable area and availability of space and infrastructure to manage exceedance via storage and conveyance (Chocat et al. Citation2007; Butler et al. Citation2018). These factors are predicted to worsen in response to climate change, rapid population growth and ageing drainage infrastructure (Ana and Bauwens Citation2010; Howard et al. Citation2010; IPCC Citation2014). Historic and contemporary approaches towards flood risk management have focussed on capturing and conveying runoff within piped systems. However, the expense and complexities of expanding subterranean infrastructure, in combination with the need to apply more cost-effective, resilient and sustainable management techniques, has resulted in increasing interest in the use of alternate interventions, such as green infrastructure.
Green infrastructure is frequently cited as a desirable method with which to manage surface water and build resilience in urban environments (Balmforth et al. Citation2006; Environment Agency Citation2007; Duffy et al. Citation2008; Wong and Brown Citation2009; Woods Ballard et al. Citation2015; Bowen and Lynch Citation2017). Terminology describing such approaches varies, including a range of synonyms such as Water Sensitive Urban Design (WSUD), Sustainable Drainage Systems (SuDS), and Best Management Practices (BMP). In this paper, green infrastructure is applied as a generic term for drainage interventions which manage surface water by mimicking natural hydrologic processes, for example, infiltration and retention (Fletcher et al. Citation2015). Examples of such interventions include green roofs, rainwater capture, rain gardens and permeable paving, among many others (Woods Ballard et al. Citation2015). Despite established inclusion of green infrastructure within academic, government and commercial discussion, several gaps regarding application in cities are still apparent (Pitt Citation2008; Burns et al. Citation2015b; Schubert et al. Citation2017). This paper responds to two of these gaps, namely, the application of a rapid and quantitative analysis to screen and identify suitable interventions for a given context, and the ability of these interventions to manage a range of rainfall events.
Quantitative comparison of green infrastructure flood-mitigation performance can be constrained by the high time and computational cost of hydrodynamic modelling required for context-specific analysis of the many permutations for intervention types and locations possible within an urban environment (Elliott and Trowsdale Citation2007; Hunter et al. Citation2008; Mikovits, Rauch, and Kleidorfer Citation2015; Löwe et al. Citation2017). Restrictions on time, budget and data can lead to decision-makers considering only tried and tested interventions, resulting in institutional inertia and stifling innovation (Cettner Citation2012; O’Donnell, Lamond, and Thorne Citation2017). A range of alternative selection processes have been proposed to respond to this gap; however, these typically increase speed through sacrificing simulation of flood dynamics in favour of faster and simpler qualitative analysis or subjective expert-led judgement (Ellis et al. Citation2004; Makropoulos et al. Citation2008; Young et al. Citation2010). Recent developments in the field have proposed the application of novel rapid scenario screening frameworks to achieve computationally efficient intervention assessment whilst still simulating flood routing to generate quantitative outputs (Ghimire et al. Citation2013; Guidolin et al. Citation2016; Webber et al. Citation2018a).
This study advances previous research through the application of a rapid scenario screening framework to a real-world case study in collaboration with multi-disciplinary stakeholders and planners. The aim of the paper is to evaluate the effectiveness of green infrastructure strategies to reduce flooding during intense rainfall events in urban areas. The paper is structured through introducing the framework and then describing how a range of strategies are co-designed with catchment stakeholders and examined using a case study in the City Centre of Melbourne, Australia. Results and discussion explore how green infrastructure interventions can be implemented to manage flooding across a range of rainfall events.
Materials and methods
Evaluating many strategies using a rapid scenario screening framework
The viability of green infrastructure to manage urban flooding was tested using the rapid scenario screening framework presented in Webber et al. (Citation2018a) and validated in Webber et al. (Citation2018b). The framework applies a simplified representation of catchment land use and flood interventions alongside a computationally efficient cellular automata flood model ‘CADDIES’. CADDIES achieves fast simulation speeds through modelling 2D runoff using simplified routing rules across a regular cellular automata grid (Ghimire et al. Citation2013; Guidolin et al. Citation2016; University of Exeter Citation2017). The grid is composed of individual cells in which parameters specify surface elevation (m), water input (mm/h), water output (mm/h) and the velocity of water runoff across the cell surface (via Manning’s n). Spatial and temporal adjustment of these parameters across the grid controls water movement and is used as a simplified representation of land use, interventions and rainfall ().
Figure 1. Runoff simulation using cellular automata, adapted from (Webber, Fu, and Butler Citation2018c).
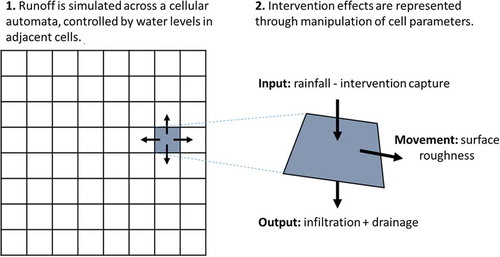
The advantage of this approach is a speed increase versus traditional modelling techniques, enabling development and analysis of many interventions and rainfall scenarios (Liu et al. Citation2018). Previous research has identified comparable accuracy with a 5 to 20 time speed increase using CADDIES compared with other models such as Infoworks ICM (Gibson et al. Citation2016; Wang et al. Citation2018). This speed increase occurs at a trade-off versus the representation of several underlying physical processes, notably through: including representation of the piped drainage system through a cell output rate rather than detailed representation through a coupled 1D simulation; and representing interventions through cell water balance (input/output rates) and roughness parameters. Previous studies have validated these simplifications as suitable for the purposes of initial catchment screening, applicable in the early stages of flood management using easy to access data (Webber et al. Citation2018b). It is envisaged that this style of catchment screening is used for scenario exploration across multi-disciplinary stakeholders and to steer later flood management actions, including prioritising data collection and steering future detailed modelling using hydrodynamic 1D-2D models. Simplified model development and fast analysis is advantageous for this application of engaging stakeholders, collaboratively developing and then screening the potential of many green infrastructure scenarios in an urban catchment using accessible and inexpensive data sources.
The framework is applied in four stages: characterising the study area, representing interventions, simulating scenarios and analysing intervention performance.
Characterising study area and rainfall
The study catchment is a 4.4 × 3.4 km area in the City Centre of Melbourne, Australia (). The catchment is intensely urbanized and constitutes a major hub of commerce, entertainment and governmental function in Melbourne. Surface water flooding in the catchment is of concern due to large historic floods in 1972 and 2010. During both of these events, surface water flows faster than 2 m/s flowed down the catchment’s main street before ponding in front of the central railway station.
Figure 2. Identifying the study catchment and areas of investigation in Melbourne, Australia.
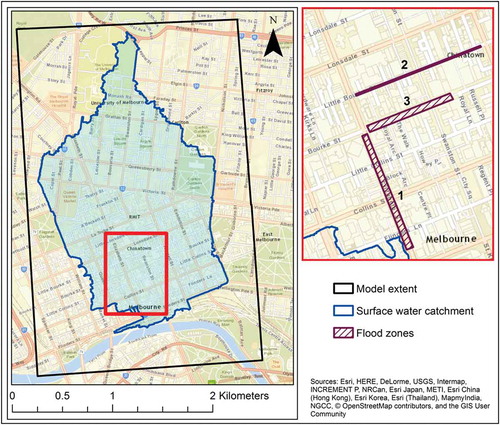
Buildings are typically of high rise commercial and residential structures, several of which are recognised with national heritage status. Significant infrastructure sites are located in the catchment, including a major railway station, local government offices and transport connections across the city. The highest risk area in the catchment is located in the south of the study area. This corresponds to the low point on one of the city’s busiest streets, which is built on top of a natural creek. The north of the catchment includes urban parkland, national heritage sites, hospitals and the campus’ of several large universities. The ‘upper catchment’ described in this paper refers to the region north of La Trobe Street. The south of the study catchment is bordered by the Yarra River. It should be noted that this is a highly engineered and canalised channel which is at a significantly lower elevation than the rest of the catchment, and as such fluvial flooding and interactions between surface water and the river are unlikely and, as such, are not included in this study.
Catchment elevation was represented using a 1 m resolution DEM model (10 cm vertical accuracy), which was derived from LiDAR survey. Land use was characterised into eight specifications, representing urban spaces, buildings, vegetation and transport infrastructure (). Surface roughness was attributed based on specifications for Manning’s n coefficient from literature (Arcement and Schneider Citation1989; Hamill Citation2001; Syme Citation2008; XP Solutions Citation2017; Butler et al. Citation2018). Buildings were represented using a high Manning’s n coefficient to represent water being held up within the structure (Syme Citation2008). Infiltration was specified based on typical rates of clay soils from the region (City of Melbourne Citation2018).
Table 1. Land use parameterisation in the study catchment. The geospatial data for the land use categories were sourced from the city (Kunapo et al. Citation2018).
The underground surface drainage system was represented through adjusting the cell water balance through increasing the output rate in areas assumed to be drained by the piped system. This included residential high-density space, buildings, railway, roads and pavements. A rate of 15 mm/h was applied to represent a system designed to convey the average intensity of an 18% AEP, 2-h event, specified by stakeholders as a conservative estimate of the system’s flow capacity based on design standards in the city. The rate was specified as it is equivalent to the average intensity of the design standard event as specified by the Australian Bureau of Meteorology (http://www.bom.gov.au/water/designRainfalls/ifd/, Ball et al. Citation2016).
It should be noted that the approach of applying a uniform infiltration rate across the drainage catchment is suitable for a catchment-wide application and evaluation of flood risk downstream of the contributing area; however is not likely to be suitable for evaluating highly localised flooding where a small contributing area is likely to be heavily influenced by local variation in drainage capacities. Consideration of finer resolution representation of drainage through variation depending on the trunk capacity in sub-catchments was not possible for this assessment due to incomplete data regarding the pipe network in the area. This simplified representation of drainage systems facilitated rapid screening of interventions and was able to simulate overland flooding due to the rain intensity during extreme rainfall events exceeding pipe capacity. It should be noted that this trade-off between model complexity and speed is only suitable for initial strategic comparison and not for the detailed design of options.
Validation using records from the 1972 flood event
To validate the simple representation of the catchment’s underground surface drainage system, predicted model outputs from a large rainfall event were compared against available observational evidence including photographs and anecdotal information. The flood model was driven using the hyetograph of the 1972 event, one of the most intense on record where rainfall intensities exceeded 100 mm/h for approximately 20 min. The model predicted localised flooding deeper than 1 m, which compared well with photographs depicting flood waters exceeding the height of cars (e.g. http://marvmelb.blogspot.com/2014/02/the-great-flash-flood-of-72.html). This high-level validation builds confidence that the flow routes and approximate depths are acceptable to use for an initial and relative assessment, aimed at high-level option comparison.
Design rainfall generation and identification of a ‘catchment critical event’
Engineers typically base designs for surface water management systems on a critical duration event where all upstream areas are contributing rainfall to a specific location. This approach is not possible when considering flood hazard across an entire catchment due to the spatial complexities and differing intensities generated from a range of rainfall profiles. The study overcame this restriction by taking advantage of simulation speeds to analyse a range of rainfall profiles and compare maximum flood depths to identify a ‘catchment critical event’. A total of 30 rainfall events were assessed, including five different frequencies (18%, 10%, 5%, 2% and 1% AEP) across six different durations (30, 60, 120, 180, 270 and 480 min). Design rainfall was derived using methods outlined in Australian Rainfall and Runoff (Ball et al. Citation2016). This analysis identified peak flooding during the 1-h rainfall profile for all annual exceedance probabilities; therefore, this was used for analysing intervention effectiveness.
Throughout the paper, the likelihood of design rainfall is described in terms of annual exceedance probability (AEP). This terminology was selected to address potential ambiguity for multi-disciplinary stakeholders unfamiliar with hydrology, due to misconceptions regarding implied periods of ‘safety’ between event recurrences when presenting findings using return periods, i.e. ‘1 in X year’. This is important for a study partially responding to the need for decision-support suited to stakeholders of varied training and professional backgrounds.
Developing and representing intervention strategies
The research team collaborated with the catchment’s local government to devise potential surface water management strategies which could be applied within the area. This involved a series of workshops with key organizational staff from a range of departments, including engineering, environmental management, and urban planning. Workshop participants identified a range of strategies, which included specific sites for green infrastructure retrofit along with the possibility of broad implementation of interventions across the entire catchment.
Translation of the strategies into the flood modelling framework involved editing the rainfall input, output and roughness data for all relevant cells within the study catchment (, Webber et al. Citation2018a; Webber et al. Citation2018b). The effect of each strategy is applied uniformly across every cell specified. A percentage of catchment treated is described for each strategy to indicate the scale and scope of the intervention. The following section outlines each of the scenarios examined, describing the adjustments to cell parameters and extent of the intervention effect relative to the total area of the catchment. A summary of all strategies is presented in .
Table 2. Intervention scenarios applied to the catchment.
Base case
The base case represented a business-as-usual scenario where the catchment was simulated as described in ‘characterising study area and rainfall’, with no interventions applied. This was used as a comparative baseline to measure the performance of each intervention strategy against.
Green roofs applied across the entire catchment
This scenario represented retrofitting green roofs on all buildings within the catchment. Application across all roofs constituted 39% of the total catchment area. This was deemed to be an aspirational strategy, achievable in the medium to long term through changes in city-level planning. Green roofs were modelled through editing input hyetographs to represent capturing rainfall within a cell. Each m2 of a green roof captured 10 l of rainfall, based on a review of the green roof literature (Mentens, Raes, and Hermy Citation2006; Stovin, Vesuviano, and Kasmin Citation2012; Woods Ballard et al. Citation2015). Such levels of rainfall retention represented a conservative estimate, irrespective of antecedent conditions, taking into account a range of typical values associated with varying roof slope, substrate storage capacities and climates.
Green roofs applied across the upper catchment
This was a more cautious strategy devised by the local government, enabling the study to investigate a range of green roof values and to accommodate strategies suggested by multiple stakeholders. The scenario only added green roofs to specific buildings in the upper catchment, representing 8% of the total catchment area. Rainfall capture with this intervention was further limited to a more conservative 7.5 l per m2 of the green roof.
Rainwater capture tanks applied across the entire catchment
Rainwater capture tanks were applied across all buildings in the catchment. It was assumed that rainfall would be captured on roof surfaces and transmitted through the downpipe to storage tanks within each building. This constituted 39% of the total catchment area.
A storage capacity of 2500 l per 100 m2 of roof space was applied across all buildings. This value represents an estimate for rainwater capture supported by literature and common practice (Burns et al. Citation2012; Hamel and Fletcher Citation2014; Schubert et al. Citation2017). It was assumed that the entire capacity was available for storage, attributed to real-time control operation draining the tank in preparation of a predicted rainfall event, and that the downpipe would not throttle water into the tank (Xu et al. Citation2018).
Rain gardens distributed across the entire catchment
Rain gardens were applied across impermeable areas within the catchment. A 2 m2 garden was specified to drain 100 m2 of impermeable catchment. The rainfall capture effect was represented through a uniform application of this capture capacity across all contributing cells, representing 43% of the total catchment area.
Rainfall is captured in rain-gardens through surface ponding and infiltration into porous filter media. Surface ponding was specified to a depth of 200 mm of water across the 2 m2 surface (equating to 400 l of storage). The filter media were assumed to be 500 mm deep with a porosity of 0.4, but an effective porosity of 0.30 to account for likely antecedent soil moisture. Therefore, each rain-garden had a total storage capacity of 700 l (400 l at the surface and 300 l within the filter media). The filter media were lined and assumed to flow into the surface water sewer system, so no allowance for infiltration was included within the intervention. The value of 700 l was applied uniformly across all cells in the 100 m2 catchment to generate a representative average capture effect of 7 mm of rainfall per m2.
Tree pits distributed across the upper catchment
The effect of locating 1000 tree pits across the upper catchment was modelled through assuming the storage capacity of a 1 m2 tree pit to be 350 l, using the same assumptions as for rain gardens (above). This capacity was multiplied by 1000 and then applied as a uniform capture volume of 0.12 l/m2 across the entire upper catchment, which constituted 43% of the total study area.
Permeable paving distributed across the entire catchment
Permeable paving was modelled through assuming all impermeable areas within the catchment, constituting 44% of the study area, could runoff to a permeable paving unit. Typical paving structure comprises 200 mm depth gravel with a porosity of 0.5 (Melbourne Water Citation2005; Yong et al. Citation2011; Mohammadinia et al. Citation2018). This equates to 100 mm of interception across each 1 m2 paving unit. It was assumed that each permeable paving unit served 10 m2 of contributing area; therefore, this effect was averaged and distributed evenly, represented through 10 mm captured from each contributing cell. An ongoing infiltration rate of 1 mm/h was based on a typical permeability of the underlying clay catchment.
Enhanced catchment storage
The local government was interested to test the potential combined effect of large-scale distributed storage applied across the entire catchment. This scenario represented the possible effects of a collaboration between all property planners and owners (both public and private) in the catchment. It was assumed storage would be implemented through a wide application of sustainable drainage features, which may also offer additional benefits to the city.
Previous investigations by the local government found that a value of 4.5 l/m2 could be achieved across the catchment and an enhanced storage capacity of 8.1 l/m2 would be possible in strategically targeted areas of the upper catchment. This is a strategic development zone within the city centre where extensive works are currently being planned in collaboration with major landowners. No detail could be provided regarding locating sites at this early stage of option analysis; therefore, this intervention was modelled through capturing rainfall landing within each cell of the catchment. Standard storage capacity was applied across 52% of the total catchment area and the enhanced capacity was applied across a further 16% of the catchment area.
Storage at a major university campus
Further storage was considered across the City’s major university campus in the north of the city centre. A total of 1.5 Ml of storage was proposed, achievable through intensive application of surface water control measures such as permeable pavement, rain gardens and rainwater capture across the campus. Storage was implemented in the modelling framework using an assumption of uniform capacity across the entire campus, which constituted 6.6% of the total catchment area. The effect over this area was estimated to be 3.3 l/m2.
Storage at university buildings integrated within the city centre
Similar storage was proposed across the other university in the catchment. These buildings are located across multiple sites clustered in the north of the city centre. It was proposed that 1 Ml could be captured on roofs of campus buildings the northern subset and 0.5 Ml could be captured on roofs in the southern distribution. This was modelled through capture volumes of 46 l/m2 in the north (0.3% of the total catchment area) and 10 l/m2 in the south (0.7%).
Park expansion at city squares
The local government proposed expanding the pervious area of three major parks in the catchment. The parks were expanded across the roads to increase the park space up to 0.9% of the total catchment area. Each 1 m2 section of park space was specified to capture 100 l of rainfall, with a continuing rate of 1 mm/h infiltrating into the underlying clay soil. Roughness was attributed a uniform Manning’s n coefficient of 0.040 to represent minimal vegetation coverage across the square.
Increasing drainage capacity in the strategic sub-catchments
A ‘grey’ intervention proposed was to increase the drainage capacity in two key areas through duplicating current pipes in two surface water drainage sub-catchments, representing 17% of the catchment area. Limited data exist regarding the pipe capacities, so a high-level assumption was used to represent the scenario where the drainage rate used in the analysis was doubled to 30 mm/h output per cell across both areas.
Simulating scenarios
In total, 60 simulations were executed, which consisted of the 12 intervention scenarios across the five rainfall magnitudes. Simulation was undertaken using CADDIES run on an ‘Nvidia Tesla K20c’. Average simulation time for each scenario was 2.1 h at a minimum model time step of 0.01 s.
Analysing intervention performance
Areas of investigation
Intervention performance was assessed in three zones across the catchment. These were selected through correlating flood ponding and conveyance routes during the base case scenario with expertise and observations from local government. Each transect corresponded to a major road within the catchment and was corroborated as areas of interest through historical flood observations ().
Using peak flood depth as a flood hazard metric
Performance of interventions was assessed using peak flood depths in cells within each transect identified in . Peak values were chosen for analysis as these represent the worst-case flooding and allow one image to effectively communicate overall flood hazard to stakeholders.
Results
For brevity, not all results appear in the paper. The 5% AEP event is presented to represent flooding during a design standard event and the 1% AEP event is used to present a low probability flood scenario, such as the 1972 event (Ball et al. Citation2016). Where discussion references the performance of interventions across other events, further results are available in the supplementary information.
Catchment flood characteristics
Surface water flooding was observed during the 1-h rainfall event in all scenarios and at all exceedance probabilities. Analysis of the distribution of peak flood depths per simulation indicates that the deepest mean and maximum peaks are observed in the base case scenario for all transects and during all return periods, demonstrating that no intervention had a negative effect on flooding within the study area.
Intervention performance during the 5% AEP event
The majority of interventions reduced flood depth across the three transects during the 5% AEP rainfall event. shows the distribution of peak flood depth across all cells for all strategies in each of the three transects. All scenarios are presented within this graph so they can be evaluated in terms of their relative flood reduction effect. The peak flood depth metric is used to provide an absolute reference point to assist in communicating effectiveness to a wide range of stakeholders. It should be noted that as a high-level scenario exploration tool it is most appropriate for these depths to be compared relatively and further detailed modelling with additional data is required to develop these results into values appropriate for full design.
Figure 3. Comparison of peak flood depth distribution for all transects in the 5% AEP event.
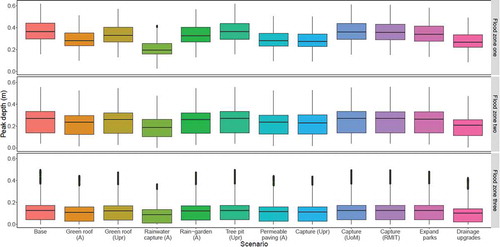
The maximum mean peak depth in the base case scenario, approximately 0.38 m, was observed in Zone One. The deepest peak flood depth, over 0.61 m, was also identified in this zone. Zone One is located at the furthest downstream point of the catchment and will have the largest contributing area when flows exceed the drainage capacity. Flooding across the other zones was on average shallower, due to smaller contributing areas.
The largest reduction in peak depth was observed in Zone One, where several strategies reduced the mean peak flood depth by 25% to 50%. The most effective interventions were those applied across large areas of the catchment, including rainwater capture, green roofs, permeable paving and the introduction of enhanced storage in the upper catchment. Rainwater capture was consistently the most effective intervention, reducing the mean peak flood depth to less than 0.2 m in Zone One and Two, and to less than 0.1 m in Zone Three. The strategy of increasing drainage capacities also results in reducing flood depths. Tree pits and capturing runoff at the city’s universities demonstrated a negligible reduction in flood depth versus the base scenario. It is suggested that, in this instance, these interventions only capture enough rainfall to delay the timing of the flood peak, rather than reduce peak magnitude.
Interventions demonstrate similar performance rankings in each zone. The most effective performances were observed in Zone One with similar, albeit a smaller range of, values exhibited in the other study areas. No interventions completely eliminated flooding; however, rainwater capture does remove all flooding from certain cells in Zone Two, a benefit which is not present in the base scenario. All interventions demonstrated cells with no flooding in Zone Three.
Intervention performance during the 1% AEP event
Deeper flooding is observed across all scenarios during the 1% AEP event (). Intervention performance generally approaches the base case scenario, with less variation in performance relative to lower return periods. Ranking of interventions remains consistent, but less apparent.
Figure 4. Comparison of peak flood depth distribution for all transects in the 1% AEP event.
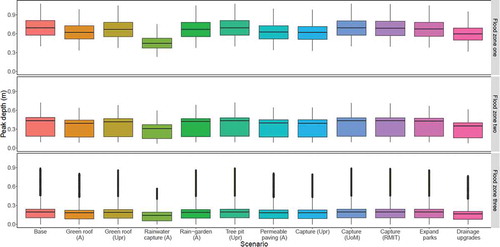
No interventions worsen flood depths; however, tree pits and capturing 1.5 Ml at the University of Melbourne and RMIT campuses show negligible differences to the base case across all transects. Other strategies based on a defined capture volume, such as green roofs in the upper catchment, rain gardens and park expansion also have little impact on flood depths. Limited performance is attributable to rainfall exceeding capture capacities during the event and therefore interventions leading to a delay, rather than reduction, in peak runoff volume. This effect is partly mitigated by strategies applied across the whole catchment or large areas, such as rainwater capture, green roofs, enhanced catchment storage and permeable paving which capture sufficient volume to reduce peak depths. Strategically targeted and intensive options such as increasing drainage capacities also demonstrate an improvement versus the base case.
Interventions flood reduction performance was less apparent in Zones Two and Three. It is suggested that this is due to the transects chosen, which receive input from smaller areas of the catchment, reaching their respective time of concentration faster after rainfall volume exceeds capture capacities.
Analysis of depth distribution is a useful tool for identifying strategic performance trends during decision support. However, it is also important for decision-makers to consider the location of flooding, in order to conceptualise and manage risk. presents a visualisation of peak depths in the base case scenario during the 1% AEP event (panel A) with a comparison of the reduction in flooding created by the application of the most effective intervention, rainwater capture (panel B).
Figure 5. Effect of catchment scale rainwater capture on peak flooding during the 1% AEP event. (a) Base case and (b) Difference in peak floods using rainwater capture.
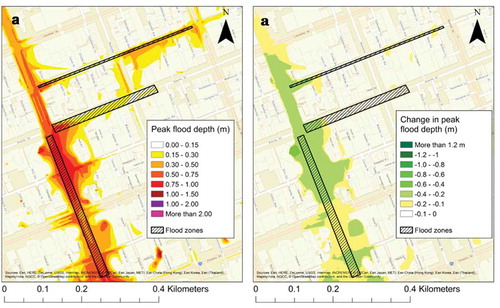
This figure shows that rainwater capture reduces peak flood depths by 0.2 to 0.6 m across the entire width of Zone One along approximately 300 m of the transect. This demonstrates a substantial public safety and damage reduction improvement versus the base case scenario.
Discussion
Green infrastructure to manage surface water
Many interventions reduced peak flood depths, and no strategy performed more poorly than the base case approach. Of particular note were interventions applied as part of a decentralised and catchment-wide strategy.
The apparent limited performance of certain localised or independent interventions should be considered in the context of an incremental development step towards a larger catchment management approach. In addition to this, although local strategies may not reduce the peak depth in the downstream catchment, their local effect and delaying flood peaks may facilitate more effective movement around areas of severe flooding which are consistent with large rainfall events.
A reduction in peak flood depth will likely correlate with a decrease in flood damage costs (Penning-Rowsell et al. Citation2005; Hammond et al. Citation2015). Reduction in flood volume will also reduce the duration of flooding, which in turn will reduce the disruption and hazard exposure to the general public. Delaying the occurrence of peak flood depths will also provide an opportunity for additional warning time, enabling more effective application of flood resilience measures and early warning systems, potentially providing safer emergency evacuations of the at-risk areas and allowing diversions to limit disruption in a key economic hub of the city (Parker, Priest, and McCarthy Citation2011).
No interventions completely prevented surface water flooding in the zones studied during any rainfall event. This is likely due to a very high capacity of storage and conveyance systems required to capture runoff from the large contributing area in combination with the high intensity of rainfall predicted during short duration events. Despite this, many strategies demonstrated a reduction in flood depth within the flood zones studied. Many interventions also created safe areas, where water levels were reduced to either zero or very low values. Safe areas prevent damage in the locality, but also have a far wider reach in minimising disruption and consequences through establishing evacuation routes which can provide the public with an opportunity to minimise hazard exposure.
Application of frameworks such as this which facilitate analysis of many simulations may have a role in iteratively combining smaller local strategies to project the impact of combined future projects and develop towards greener urban catchments. This mode of analysis could also provide useful in identifying tipping points, where the combined effect of interventions will reduce rather than delay the peak flood and limit the requirements for financially and environmentally expensive subsurface drainage upgrades.
Effect of AEP on green infrastructure performance
Fast analysis of strategies enabled evaluation of performance across multiple rainfall AEP scenarios. This analysis has identified a clear trend where, as events become more intense (i.e. AEP decreases), intervention performance to reduce peak flood depth and velocity become less effective. It should be noted that this finding is made relative to the peak values and does not include the intervention effect on hazard duration. However, in the case of surface water flooding, the peak depth rather than flood duration is likely to be the controlling factor in flood damage (Penning-Rowsell et al. Citation2005).
The reduction in intervention performance during more intense rainfall is attributed to strategies reaching capacity and then ceasing to reduce the flow rate versus the base case scenario. This pattern of interventions becoming less effective at reducing peak values during high-intensity events is observed during the 1% AEP event, where differences between interventions were negligible.
Assessing the response of green infrastructure to changing rainfall intensities is significant as it informs understanding the effective flood management beyond design standards. Green infrastructure is frequently cited as a desirable method with which to manage surface water and build resilience in urban environments (Wong and Brown Citation2009; Woods Ballard et al. Citation2015; Bowen and Lynch Citation2017). Finding that performance of certain interventions reduces in response to high-intensity rainfall indicates that resilience of interventions needs to be assessed in relation to a range of events when building urban resilience, particularly in light of increasing intensity and frequency of future hazards (Howard et al. Citation2010; IPCC Citation2014).
Supporting practical application of green infrastructure through collaborative strategy screening
It is imperative that catchment stakeholders understand the performance of flood management techniques in order for benefits to be applied to cities (Pitt Citation2008; Burns et al. Citation2015a; Schubert et al. Citation2017). Historic approaches have been limited by restrictions on time, budget and data which can lead to decision-makers considering only tried and tested interventions, resulting in institutional inertia and stifling innovation (Cettner Citation2012; O’Donnell, Lamond, and Thorne Citation2017). This research sought to develop the application of new methods to address this institutional barrier through collaborating with key personnel from the local government to devise intervention strategies. There is thought that such civic experimentation can change standard practice (Karvonen Citation2011), and in this case, could increase the capacity of the local government to implement green infrastructure. This is particularly important because case study results suggest that substantial reductions in flood risk are made possible when green infrastructure is applied across large areas of a catchment, requiring buy-in and communication between many stakeholders. Rapid analysis using the framework enabled a series of workshops in quick succession, in which stakeholders could communicate and test strategies with fast feedback upholding a collaborative momentum.
Achieving high levels of green infrastructure implementation will likely take time and trusting partnerships between those involved (Burns et al. Citation2015a). Planners, therefore, need to develop and articulate aspirational strategies which gradually implement actions towards catchment-wide surface water flood management. It is important to note that although the more localised interventions appear less effective, these will play a vital role in achieving larger scale ambitions. Communicating that substantial outcomes could take time will be an important part of stakeholder consultation efforts.
Limitations and future research
The approach applied constitutes a fast process which appears very well suited to intervention screening and to facilitating collaboration between catchment stakeholders. The tool is subject to several limitations which need to be recognised during implementation and evaluated when applying findings to direct further flood management actions.
The main limitation is the simplified inclusion of the underground drainage network. The constant infiltration approach is able to represent the recession process (Wang et al. Citation2018), but is unable to simulate hydraulic events such as downstream pipe surcharge or throttling (Webber et al. Citation2018b). Therefore, application of results should be used to direct and prioritise requirements for further detailed modelling which incorporates the sub-surface system. It should be noted that aside from speed, a further benefit of this simplified representation is that only limited understanding of a drainage network is required for setting up and screening models to examine the surface water runoff. This is of particular importance where components of the drainage system may be unknown: A common problem in many urban areas.
A further useful addition to the framework would be the inclusion of the multiple benefits associated with each intervention. Current literature regarding assessment of cost-effectiveness within this framework is available (Webber, Fu, and Butler Citation2019) however inclusion of cutting edge additional benefit measurement techniques would provide a greater opportunity for application as an integrated decision support framework able to manage resilience and sustainability (Guswa et al. Citation2014; CIRIA Citation2015; Kunapo et al. Citation2018).
This study has also focussed on evaluating uniform strategies so as to familiarise a wide range of stakeholders with a simplified version of the scenario exploration and to communicate the relative benefits of a diverse range of intervention types and strategies. This is particularly beneficial to disseminate a direct demonstration of the utility of green infrastructure versus more traditional hard engineered approaches to stakeholders from a range of backgrounds. It is recommended that future developments of this methodology expand the scenario development to include the effectiveness of combinations of interventions to explore the synergies and compounding benefits of heterogeneous strategies. Further refinement of the work would also consider the effect of antecedent conditions on runoff capture.
Conclusions
This study successfully implemented real-world application of a research-based framework to determine the positive effect catchment scale application of green infrastructure can convey upon urban flood management. The efficient implementation of the framework in collaboration with catchment stakeholders provided a clear and concise strategic intervention development mechanism to explore multiple intervention scenarios. Analysis of interventions indicated a range of strategies which were effective at reducing flooding when built up across the catchment, and that multiple smaller intervention strategies accumulate towards catchment scale benefits. This poses a future research question regarding where the tipping point for catchment-scale benefits lies.
Rapid simulation times achieved using the framework enabled a collaborative and efficient option screening process. The simplified development of intervention strategies provided a clear communication tool which supported the multi-disciplinary investigations required for screening urban planning in a complex environment. Future research should develop the utility of the rapid scenario screening approach to include cost-effectiveness, including multiple benefits.
Supplemental Material
Download PDF (506.5 KB)Acknowledgements
The authors would also like to thank the generous support provided by the City of Melbourne, Melbourne Water and Water Technology Pty.
Disclosure statement
No potential conflict of interest was reported by the authors.
Supplementary material
Supplemental data for this article can be accessed here.
Additional information
Funding
Related Research Data
References
- Ana, E. V., and W. Bauwens. 2010. “Modeling the Structural deterioration of Urban Drainage Pipes: The State-of-the-art in Statistical Methods.” Urban Water Journal 7 (1): 47–59. doi:10.1080/15730620903447597.
- Arcement, G. J., Jr, and V. R. Schneider. 1989. Guide for Selecting Manning’s Roughness Coefficients for Natural Channels and Flood Plains. Washington, DC: USGS.
- Ball, J. E., M. K. Babister, R. Nathan, P. E. Weinmann, W. Weeks, M. Retallick, and I. Testoni. 2016. Australian Rainfall and Runoff - A Guide to Flood Estimation. Geoscience Australia. Australia: Commonwealth of Australia.
- Balmforth, D., C. Digman, R. Kellagher, and D. Butler. 2006. Designing for Exceedance in Urban Drainage-good Practice’, 174–180. CIRIA.
- Bowen, K. J., and Y. Lynch. 2017. “The Public Health Benefits of Green Infrastructure: The Potential of Economic Framing for Enhanced Decision-making.” Current Opinion in Environmental Sustainability 25: 90–95. doi:10.1016/j.cosust.2017.08.003.
- Burns, M. J., T. D. Fletcher, C. J. Walsh, A. R. Ladson, and B. E. Hatt. 2012. “Hydrologic Shortcomings of Conventional Urban Stormwater Management and Opportunities for Reform.” Landscape and Urban Planning 105 (3): 230–240. doi:10.1016/j.landurbplan.2011.12.012.
- Burns, M. J., J. E. Schubert, T. D. Fletcher, and B. F. Sanders. 2015b. “Testing the Impact of At-source Stormwater Management on Urban Flooding through a Coupling of Network and Overland Flow Models.” Wiley Interdisciplinary Reviews: Water 2 (4): 291–300. doi:10.1002/wat2.1078.
- Burns, M. J., E. Wallis, V. Matic, M. J. Burns, E. Wallis, and V. Matic. 2015a. “Building Capacity in Low-impact Drainage Management through Research Collaboration.” Freshwater Science 34 (3): 1176–1185. doi:10.1086/682565.
- Butler, D., C. Digman, C. Makropoulos, and J. Davies. 2018. Urban Drainage. Fourth edi. London: CRC Press.
- Cettner, A. 2012. Overcoming Inertia to Sustainable Stormwater Management Practice. Luleå University of Technology.
- Chocat, B., R. Ashley, J. Marsalek, M. R. Matos, W. Rauch, W. Schilling, and B. Urbonas. 2007. “Toward the Sustainable Management of Urban Storm-Water.” Indoor and Built Environment 16 (3): 273–285. doi:10.1177/1420326X07078854.
- CIRIA. 2015. BeST (Benefits of SuDS Tool) W045d BeST – User Manual Release Version 1.
- City of Melbourne. 2018. “Soil Types by Area.” https://data.melbourne.vic.gov.au/Environment/Soil-types-by-area-Urban-Forest-/t3zn-qgfx
- Duffy, A., C. Jefferies, G. Waddell, G. Shanks, D. Blackwood, and A. Watkins. 2008. “A Cost Comparison of Traditional Drainage and SUDS in Scotland.” Water Science and Technology 57 (9): 1451–1459. doi:10.2166/wst.2008.262.
- Elliott, A. H., and S. A. Trowsdale. 2007. “A Review of Models for Low Impact Urban Stormwater Drainage.” Environmental Modelling and Software 22 (3): 394–405. doi:10.1016/j.envsoft.2005.12.005.
- Ellis, J. B., J. C. Deutsch, J. M. Mouchel, L. Scholes, and M. D. Revitt. 2004. “Multicriteria Decision Approaches to Support Sustainable Drainage Options for the Treatment of Highway and Urban Runoff.” Science of the Total Environment 334–335: 251–260. doi:10.1016/j.scitotenv.2004.04.066.
- Environment Agency. 2007. Cost-benefit of SUDS Retrofit in Urban Areas. Environment Agency report. Published by Environment Agency, Bristol.
- Fletcher, T. D., W. Shuster, W. F. Hunt, R. Ashley, D. Butler, S. Arthur, S. Trowsdale, et al. 2015. “SUDS, LID, BMPs, WSUD and More – The Evolution and Application of Terminology Surrounding Urban Drainage.” Urban Water Journal 12 (7): 525–542. doi:10.1080/1573062X.2014.916314.
- Ghimire, B., A. S. Chen, M. Guidolin, E. C. Keedwell, S. Djordjević, and D. A. Savić. 2013. “Formulation of a Fast 2D Urban Pluvial Flood Model Using a Cellular Automata Approach.” Journal of Hydroinformatics 15 (3): 676–686. doi:10.2166/hydro.2012.245.
- Gibson, M. J., D. A. Savic, S. Djordjevic, A. S. Chen, S. Fraser, and T. Watson. 2016. “Accuracy and Computational Efficiency of 2D Urban Surface Flood Modelling Based on Cellular Automata.” Procedia Engineering 154: 801–810. doi:10.1016/j.proeng.2016.07.409.
- Guidolin, M., A. S. Chen, B. Ghimire, E. C. Keedwell, S. Djordjević, and D. A. Savić. 2016. “A Weighted Cellular Automata 2D Inundation Model for Rapid Flood Analysis.” Environmental Modelling & Software 84: 378–394. doi:10.1016/j.envsoft.2016.07.008.
- Guswa, A. J., K. A. Brauman, C. Brown, P. Hamel, B. L. Keeler, and S. S. Sayre. 2014. “Ecosystem Services: Challenges and Opportunities for Hydrologic Modeling to Support Decision Making.” Water Resources Research 50 (5): 4535–4544. doi:10.1002/2014WR015497.
- Hamel, P., and T. D. Fletcher. 2014. “The Impact of Stormwater Source-control Strategies on the (Low) Flow Regime of Urban Catchments.” Water Science and Technology 69 (4): 739–745. doi:10.2166/wst.2013.772.
- Hamill, L. 2001. Understanding Hydraulics. Second edi. Basingstoke: Palgrave Macmillan.
- Hammond, M. J., A. S. Chen, S. Djordjević, D. Butler, O. Mark, A. S. Chen, S. Djordjević, and D. Butler. 2015. “Urban Flood Impact Assessment : A State-of-the-art Review.” Urban Water Journal 12 (1): 14–29. doi:10.1080/1573062X.2013.857421.
- Howard, G., K. Charles, K. Pond, A. Brookshaw, R. Hossain, and J. Bartram. 2010. “Securing 2020 Vision for 2030: Climate Change and Ensuring Resilience in Water and Sanitation Services.” Journal of Water and Climate Change 1 (1): 2. doi:10.2166/wcc.2010.105b.
- Hunter, N. M., P. D. Bates, S. Neelz, G. Pender, I. Villanueva, N. G. Wright, D. Liang, et al. 2008. “Benchmarking 2D Hydraulic Models for Urban Flooding.” Proceedings of the Institution of Civil Engineers - Water Management 161 (1): 13–30. doi:10.1680/wama.2008.161.1.13.
- IPCC. 2014. Climate Change 2014: Synthesis Report. Contribution of Working Groups I, II and III to the Fifth Assessment Report of the Intergovernmental Panel on Climate Change. Geneva, Switzerland: IPCC.
- Karvonen, A. 2011. Politics of Urban Runoff: Nature, Technology, and the Sustainable City. MIT Press, Urban & Industrial Environments Series.
- Kunapo, J., T. D. Fletcher, A. R. Ladson, L. Cunningham, and M. J. Burns. 2018. “A Spatially Explicit Framework for Climate Adaptation.” Urban Water Journal 15 (2): 159–166. doi:10.1080/1573062X.2018.1424216.
- Liu, H., Y. Wang, C. Zhang, A. S. Chen, and G. Fu. 2018. “Assessing Real Options in Urban Surface Water Flood Risk Management under Climate Change.” Natural Hazards 94: 1–17. doi:10.1007/s11069-018-3349-1.
- Löwe, R., C. Urich, N. Sto. Domingo, O. Mark, A. Deletic, and K. Arnbjerg-Nielsen. 2017. “Assessment of Urban Pluvial Flood Risk and Efficiency of Adaptation Options through Simulations – A New Generation of urban Planning Tools.” Journal of Hydrology 550: 355–367. doi:10.1016/j.jhydrol.2017.05.009.
- Makropoulos, C. K., K. Natsis, S. Liu, K. Mittas, and D. Butler. 2008. “Decision Support for Sustainable Option Selection in Integrated Urban Water Management.” Environmental Modelling and Software 23 (12): 1448–1460. doi:10.1016/j.envsoft.2008.04.010.
- Melbourne Water. 2005. Water Sensitive Urban Design Guidelines. Melbourne: Melbourne Water.
- Mentens, J., D. Raes, and M. Hermy. 2006. “Green Roofs as a Tool for Solving the Rainwater Runoff Problem in the Urbanized 21st Century?” Landscape and Urban Planning 77 (3): 217–226. doi:10.1016/j.landurbplan.2005.02.010.
- Mikovits, C., W. Rauch, and M. Kleidorfer. 2015. “A Dynamic Urban Development Model Designed for Purposes in the Field of urban Water Management.” Journal of Hydroinformatics 17 (3): 390–403. doi:10.2166/hydro.2014.015.
- Mohammadinia, A., M. M. Disfani, G. A. Narsilio, and L. Aye. 2018. “Mechanical Behaviour and Load Bearing Mechanism of High Porosity Permeable Pavements Utilizing Recycled Tire Aggregates.” Construction and Building Materials 168: 794–804. doi:10.1016/j.conbuildmat.2018.02.179.
- O’Donnell, E. C., J. E. Lamond, and C. R. Thorne. 2017. “Recognising Barriers to Implementation of Blue-Green Infrastructure: A Newcastle Case Study.” Urban Water Journal 14 (9): 964–971. doi:10.1080/1573062X.2017.1279190.
- Parker, D. J., S. J. Priest, and S. S. McCarthy. 2011. “Surface Water Flood Warnings Requirements and Potential in England and Wales.” Applied Geography 31 (3): 891–900. doi:10.1016/j.apgeog.2011.01.002.
- Penning-Rowsell, E., E. Johnson, S. Tunstall, S. Tapsell, J. Morris, J. Chatterton, and C. Green. 2005. The Benefits of Flood and Coastal Risk Management: A Manual of Assessment Techniques. London: Middlesex University Press.
- Pitt, M. 2008. The Pitt Review: Learning Lessons from the 2007 Floods. London: Cabinet Office.
- Schubert, J. E., M. J. Burns, T. D. Fletcher, and B. F. Sanders. 2017. “A Framework for the Case-specific Assessment of Green Infrastructure in Mitigating Urban Flood Hazards.” Advances in Water Resources 108: 55–68. doi:10.1016/j.advwatres.2017.07.009.
- Stovin, V., G. Vesuviano, and H. Kasmin. 2012. “The Hydrological Performance of a Green Roof Test Bed under UK Climatic Conditions.” Journal of Hydrology 414: 148–161. doi:10.1016/j.jhydrol.2011.10.022.
- Syme, W. 2008. “Flooding in Urban Areas - 2D Modelling Approaches for Buildings and Fences.” 9th National Conference on Hydraulics in Water Engineering: Hydraulics 2008, Australia, 367. Engineers Australia.
- University of Exeter. 2017. “CADDIES Framework” emps.exeter.ac.uk/engineering/research/cws/resources/caddies-framework/
- Wang, Y., A. S. Chen, G. Fu, S. Djordjević, C. Zhang, and D. A. Savić. 2018. “An Integrated Framework for High-resolution Urban Flood Modelling considering Multiple Information Sources and urban Features.” Environmental Modelling & Software 107: 85–95. doi:10.1016/j.envsoft.2018.06.010.
- Webber, J. L., G. Booth, R. Gunasekara, G. Fu, and D. Butler. 2018b. “Validating a Rapid Assessment Framework for Screening Surface Water Flood Risk.” Water and Environment Journal 33 (3): 427–442.
- Webber, J. L., G. Fu, and D. Butler. 2018c. “Rapid Surface Water Intervention Performance Comparison for Urban Planning.” Water Science and Technology 77 (8): 2084–2092. doi:10.2166/wst.2018.122.
- Webber, J. L., G. Fu, and D. Butler. 2019. “Comparing Cost Effectiveness of Surface Water Flood Management Interventions in a UK Catchment.” Journal of Flood Risk Management 12. doi:10.1111/jfr3.v12.S2.
- Webber, J. L., M. J. Gibson, A. S. Chen, G. Fu, and D. Butler. 2018a. “Rapid Assessment of Surface Water Flood Management Options in Urban Catchments.” Urban Water Journal 15 (3): 210–217. doi:10.1080/1573062X.2018.1424212.
- Wong, T. H. F., and R. R. Brown. 2009. “The Water Sensitive City: Principles for Practice.” Water Science and Technology 60 (3): 673–682. doi:10.2166/wst.2009.436.
- Woods Ballard, B., S. Wilson, H. Udale-Clarke, S. Illman, T. Scott, R. Ashley, and R. Kellagher. 2015. The SuDS Manual (C753). London, UK: CIRIA.
- XP Solutions. 2017. “Manning’s Roughness Tables.” http://xpsolutions.com/webhelp/SECTION_11__GLOBALS/11_4_Infiltration/Manning_s_Roughness.htm
- Xu, W., T. Fletcher, H. Duncan, D. Bergmann, J. Breman, and M. Burns. 2018. “Improving the Multi-Objective Performance of Rainwater Harvesting Systems Using Real-Time Control Technology.” Water 10 (2): 147. doi:10.3390/w10020147.
- Yong, C. F., A. Deletic, T. D. Fletcher, and M. R. Grace. 2011. “Hydraulic and Treatment Performance of Pervious Pavements under Variable Drying and Wetting Regimes.” Water Science & Technology 64 (8): 1692. doi:10.2166/wst.2011.150.
- Young, K. D., T. Younos, R. L. Dymond, D. F. Kibler, and D. H. Lee. 2010. “Application of the Analytic Hierarchy Process for Selecting and Modeling Stormwater Best Management Practices.” Journal of Contemporary Water Research & Education 146 (1): 50–63. doi:10.1111/jcwr.2010.146.issue-1.