
ABSTRACT
Drinking water quality leaving water treatment works is known to deteriorate as it makes its way through distribution networks. As deterioration rates are related to the condition of the network and how it is operated, it is important to determine the location and magnitude so that causes can be determined and effective maintenance implemented. Water quality is typically monitored at outlets of service reservoirs to help track changing water quality. However, these results do not confirm whether the issue is linked to the network between treatment and the service reservoir, the service reservoir itself, or both. The work in this paper investigates the value of using inlet monitoring at service reservoirs to overcome this limitation. Results show that monitoring at both the inlet and outlet of service reservoirs provides valuable information on asset performance and highlights the location and extent of deterioration helping inform cost-efficient resource provision.
Introduction
Drinking water quality leaving water treatment works is of a consistently high standard as evidenced by regulatory sampling at the works outlet with UK results showing England at 99.95%, Wales 99.97%, and Scotland 99.90% compliance (DWI Citation2018; DWQR Citation2018). As drinking water makes its way through the distribution network, however, quality can deteriorate, which is likely a result of network fouling, associated primarily with the process of material accumulation (Kirmeyer et al. Citation2000). This includes long-term exposure to organic and inorganic material from source waters (Kirmeyer et al. Citation2000; Slaats et al. Citation2003), incomplete removal and/or addition of suspended solids at treatment works (Gauthier et al. Citation2001; Vreeburg, Schaap, and van Dijk Citation2004), corrosion (Slaats et al. Citation2003), and biofilm growth (van der Wende and Characklis Citation1990; Douterelo, Sharpe, and Boxall Citation2013). Deterioration is reflected in consumer complaints and regulatory sample failures, such as those for bacteria, taste and odour, metal concentrations (mainly iron and manganese, although lead can have a high profile), and appearance (Mounce, Mounce, and Boxall Citation2016). As deterioration rates can be related to the condition of the water distribution network and how it is operated and maintained, it is important to determine which assets require maintenance (Lee and Schwab Citation2005; Brandt et al. Citation2016). Monitoring water quality immediately after it leaves the treatment works cannot provide a representative analysis of water quality at customer taps (NRC Citation2006; Jjemba et al. Citation2014). Water quality monitoring at different locations of the network is therefore performed to help indicate deterioration location and magnitude. In the UK, this includes treatment works outlets, service reservoir outlets, consumer taps, and any mobile vessels not hydraulically linked to the network from which consumers may collect water, such as tankers or bowsers (DWI Citation2020a).
Key indicators of water quality are disinfectant residual, bacteria, turbidity, iron, and manganese (DWI Citation2020a). These are regulated at all points of the network, with UK prescribed concentration values set at 0/100 ml for bacteria, 0.2 mg/l for iron, 0.05 mg/l for manganese, and 1 NTU for turbidity at treatment works and 4 NTU at customer taps (DWI Citation2018; DWQR Citation2018). There is no regulatory maximum or minimum for disinfectant residual (DWI Citation2020a).
The importance of monitoring disinfectant residual and bacteria in the network is based on potential public health risks, whereas the value in doing this for metals and turbidity may not be as obvious. All inorganic compounds in the distribution network influence water quality, but a principal influence comes from metals, primarily iron and manganese. These metals are not only found in source waters (Brandt et al. Citation2016), but can increase in the network due to carry-over from treatment works (Vreeburg et al. Citation2008), and corrosion of metallic pipes and internal structures in storage tanks (Peng and Korshin Citation2011). These two metals are usually grouped together because oxidised manganese (MnO2) is an effective adhesive of ferrous iron (Fe2+), so the two are often found in conjunction (AWWA Citation2011). Iron tends to be the more predominant metal, mainly because the majority of pipework (especially in the UK) is cast or ductile iron (Boxall, Skipworth, and Saul Citation2003). Both metals pose a risk to water quality when oxidised to their insoluble forms upon exposure to oxygen or disinfectant (Benson, Dietrich, and Gallagher Citation2012; Gerke, Little, and Maynard Citation2016) and in this form, the metals precipitate and can accumulate in the network (AWWA Citation2011; Gerke, Little, and Maynard Citation2016). At concentrations as low as 0.3 mg/l for iron and 0.02 mg/l for manganese, discolouration can occur, increasing disinfection demand and imparting an unpleasant taste to water, whilst excessive accumulation can clog pipes and promote bacteriological growth (Norton and LeChevallier Citation2000; Sarin et al. Citation2004; Husband and Boxall Citation2011; Brandt et al. Citation2016). It is important to determine key sources of these metals, especially as they have been linked to water quality risks throughout distribution networks (Husband et al. Citation2016).
Turbidity is a measure of suspended material in the network and can be used to rapidly indicate water quality issues and contamination events (McCoy and Olsen Citation1986; Blokker and Schaap Citation2015). Although the composition of suspended material is not limited to iron and manganese, turbidity is strongly correlated with both (Seth et al. Citation2004). Furthermore, like metals, turbidity is associated with a decrease in disinfection efficacy, bacteriological presence, and unpleasant taste and odour of the water supply (McCabe et al. Citation1970; LeChevallier, Evans, and Seidler Citation1981; Zacheus et al. Citation2001), highlighting the importance of its regulation.
Service reservoirs have been associated with a range of drinking water quality problems, from metals accumulation, nitrification, and disinfectant residual degradation to significant waterborne disease outbreaks (Clark et al. Citation1996; Craun and Calderon Citation2001; NRC Citation2006; AWWA Citation2006). Yet, without routine sampling for ammonium, nitrate, nitrite, metals, and turbidity at service reservoirs, data are limited on the aforementioned water quality problems (Grayman et al. Citation1999). Only disinfectant residual, colony counts, and Escherichia coli and coliform bacteria have UK regulatory sampling at service reservoir outlets (DWQR Citation2018; DWI Citation2020). Nevertheless, bacteriological failures have been shown to be double the rates at service reservoir outlets in comparison to their supplying water treatment works (Ellis et al. Citation2018), indicating a risk to water quality from these water storage facilities. However, the results from this service reservoir outlet sampling do not necessarily confirm the true cause and location of the contamination, because the issue could be related to the network between treatment and the service reservoir, the service reservoir itself, or both.
The lack of inlet sampling at service reservoirs makes it impossible to determine the state of the water quality or how it changes with transport through these assets (Grayman et al. Citation1999; Kirmeyer et al. Citation1999). Currently, a regulatory bacteriological sampling failure at the outlet of a service reservoir is considered as an indication of a problem emanating from the service reservoir itself, resulting in a costly investigation of the asset (Environment Agency Citation2010). However, many service reservoir investigations reveal no discernible problem with the service reservoir itself. This can often be seen in service reservoir inspection reports, whereby the structural integrity of the reservoir in question is assessed and reported to be in adequate condition, showing no signs of corrosion, or ports of ingress (typically by conducting a ‘flood test’), the latter considered the main cause of a bacteriological failure. In many instances, the regulatory outlet sample tap is a post-design addition and is located at a distance from the service reservoir, but the influence of the pipework leading to the tap is not considered. In general, service reservoirs are often overlooked or merely regarded as a small part of distribution networks, resulting in the current paucity of literature on them. This finding is supported by the NRC (Citation2006), who state that ‘documents addressing storage facilities are rare’ and that ‘storage tanks have not historically received the attention afforded to pipe maintenance’.
Lack of literature and the absence of inlet monitoring makes it difficult to quantify how often water quality issues are falsely assigned to service reservoirs as opposed to elsewhere in the network. It would be of value for water utilities to proactively identify the true causes and locations of water quality deterioration, thereby saving the effort, time, and expense of unhelpful investigations. Average costs per investigation, not including time, inconvenience or negative publicity, can be up to £4200 at service reservoirs, £4900 at water treatment works, and £1200 at customer taps (Ellis et al. Citation2018).
This paper reports results from a study investigating the fate of a range of water quality parameters including metal concentrations, turbidity, and chlorine from treatment to tap at two field sites in the UK. Sampling results were collected from the treatment works, through distribution, and critically at both the inlet and outlet of service reservoirs. The aim of this work was to investigate the value of inlet monitoring at service reservoirs as a measure to help determine the source of water quality deterioration in the network, and its magnitude. Furthermore, by incorporating parameters that are associated with water quality but are not currently routinely sampled for, the research aimed to improve understanding regarding the destiny of material and key monitoring parameters with respect to transport through service reservoirs.
The results provide a robust data set to demonstrate the impact of characterising service reservoir performance in terms of water quality to complement the few studies in the current literature (Rossman, Clark, and Grayman Citation1994; Gauthier et al. Citation2000; Grayman and Kirmeyer Citation2000; Zhang et al. Citation2014; Jjemba et al. Citation2014). A couple of these studies (Rossman, Clark, and Grayman Citation1994; Fisher et al. Citation2009) have carried out both inlet an outlet sampling, but they focus primarily on indirect measures of service reservoir water quality like mixing conditions, stratification, and retention times. It is hoped that the knowledge obtained from this work will also help inform and improve the effectiveness of operational maintenance of service reservoirs, including scheduling and interventions after regulatory sample failures.
Methods
Two field sites at two different UK water companies were selected for examination based on specific requirements established using the objectives and scope of this work. These included the site: (1) having a consistent source water and treatment; (2) being completely post treatment; (3) either having a pre-existing accessible inlet and outlet sampling line and tap or having the scope for installation; (4) be of interest/value to the host water company as a study site, based on company metrics.
Site A is an underground, rectangular, twin-compartment 90 ML reinforced concrete service reservoir with an average water retention time of 1.36 days, and last cleaned in 2012. It is fed by two 7.2 km trunk mains, one steel (1254 mm in diameter) and one cement-lined ductile iron (900 mm in diameter). Treated water is river abstracted with free chlorine as the secondary residual disinfectant.
For this study, in addition to routine regulatory sampling at the treatment works, an inlet tap was installed at this service reservoir to facilitate sampling for total iron and manganese at both inlet and outlet across 2018 (total n = 38). The following were also measured: free and total chlorine, turbidity, aluminium (total), colour, conductivity, pH, and temperature. Due to operational difficulties, inlet samples were collected October through December and the outlet samples January through May plus August. All samples were collected and analysed by water company staff in accordance with their standard procedures for regulatory compliance monitoring ISO/IEC 17025, ISO/IEC 17024, and the Drinking Water Testing Specification (DWTS), accredited by the United Kingdom Accreditation Service (UKAS) (DWI Citation2020a, Citation2020b).
Historical regulatory sampling data for this site were also compiled, which included treatment works parameters, as well as iron (total), manganese (total), pH, conductivity, turbidity, and free and total chlorine at the service reservoir outlet and in the areas it serves for the period from 2007 to 2010 (). As water companies are not regulated to sample for metals at service reservoirs and only do so for investigative reasons, the only full dataset available for the identified parameters for site A was between 2007 and 2010.
Table 1. Historical water quality parameter averages at the water treatment works, service reservoir outlet and the district-metered area served for the period from 2007 to 2010 at site A
Site B is a rectangular, underground, twin-compartment 4.84 ML reinforced concrete service reservoir with an average water retention time of 1.72 days, and last cleaned in summer 2018. It is fed by a 28 km unlined cast iron trunk main (460 mm decreasing to 384 mm in diameter). Treated water comes from a highland reservoir, with free chlorine used as the secondary, residual disinfectant. With the length of the supply main, additional chlorine dosing is added at the inlet of the service reservoir.
For this study, an inlet sample line and tap were installed on site to complement the existing outlet tap. ATi NephNet turbidity response monitors (ATi UK Citation2011) with infrared nephelometric measurement processing were installed at the inlet and outlet of the service reservoir with 1-minute logging frequency and logger functioning range set to 0–20.00 NTU with reading accuracy of ±5%. Due to operational difficulties at the time, it was not possible to install similar monitors at site A. A 24-hour sampling program was also conducted with hourly collection from inlet and outlet (at the same sample points as the turbidity monitors) using Hach AS950 automatic samplers (Hach Citation2020). These samples were analysed for iron (total and dissolved), aluminium (total), manganese (total and dissolved), colour, conductivity, pH, and turbidity by water company staff in accordance with their standard procedures for regulatory compliance monitoring ISO/IEC 17025, ISO/IEC 17024, and the DWTS, accredited by UKAS (DWI Citation2020a, Citation2020b). This program was not conducted at site A, as both inlet and outlet grab samples were being collected and analysed for the same parameters at that site. Historical regulatory sampling data were also compiled for site B, which included treatment works parameters, and free and total chlorine at the service reservoir outlet for the period from 2008 to 2019 ().
Table 2. Historical water quality parameter averages at the water treatment works, service reservoir outlet and the district-metered area served for the period from 2008 to 2019 at site B
Results
At site A, analysis of the 3 year historical water quality data revealed that total iron levels were approximately 10 times higher at the service reservoir outlet, with an average of 0.03 mg/l, in comparison to water treatment works outlet with an average of 0.005 mg/l (). Based on the measured total iron concentrations within the areas supplied by the site A service reservoir (average of 0.02 mg/l), it appears that most of the material from the outlet of the service reservoir was carried through into the distribution network. Thus, the historical sampling at the service reservoir outlet and across the distribution network provides evidence of water quality deterioration after treatment in this case, if not indicating causes or location.
Results for the year of inlet and outlet sampling for total iron and manganese at site A are summarised in and . The datasets for water quality parameters sampled at the inlet and outlet of the service reservoir in 2018 do not overlap, but the data collected provide an insight into the processes of both material accumulation and mobilisation happening at site A, which is currently not possible to do from regulatory sampling alone.
Figure 1. A box and whisker plot showing total iron concentrations in mg/l at the outlet of water treatment works, and inlet and outlet of the supplied service reservoir (site A) across 2018. The thick horizontal bar indicates the median, the top and bottom of the box indicate the interquartile range and the whiskers represent the spread of data outside of this interquartile range
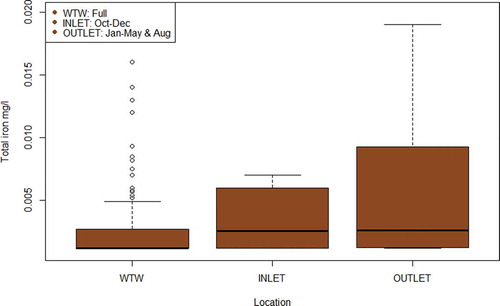
Figure 2. A box and whisker plot showing total manganese concentrations in mg/l at the outlet of water treatment works, and inlet and outlet of the supplied service reservoir (site A) across 2018. The thick horizontal bar indicates the median, the top and bottom of the box indicate the interquartile range and the whiskers represent the spread of data outside of this interquartile range
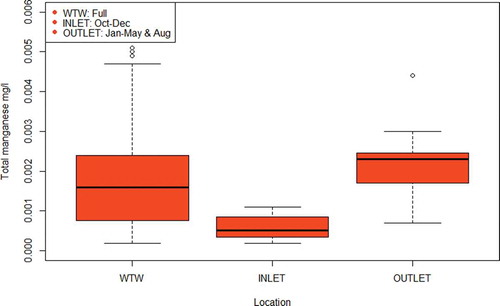
For total iron (), considering outlet and treatment works data alone, in line with current regulatory monitoring requirements that do not include inlet water quality monitoring, the cause of water quality deterioration at site A could be assumed to be the service reservoir. With the addition of the inlet sampling results, however, it can be seen that the deterioration is occurring upstream of the service reservoir, but after the treatment works, thereby identifying the supplying trunk mains as the likely source of elevated iron. It can also be observed that the service reservoir outlet iron concentrations have the same median value as the inlet concentrations, suggesting no significant further deterioration is taking place within the service reservoir. However, the wider range of iron concentrations measured at the outlet suggest iron has accumulated since the last service reservoir clean in 2012 and is periodically remobilised (Kirmeyer et al. Citation2000; Vreeburg, Schaap, and van Dijk Citation2004). Remobilisation of material can occur following a hydraulic disturbance, such as a pipe burst resulting in a drop in water level in the service reservoir, or when the accumulative capacity of material is exceeded in the facility (Kirmeyer et al. Citation1999; Vreeburg, Schaap, and van Dijk Citation2004; Husband, Jackson, and Boxall Citation2015). For total manganese (), considering the outlet and treatment works data alone, the cause of water quality deterioration could, as with total iron, be assumed to be the service reservoir. The addition of inlet sampling supports this conclusion, as it appears that total manganese levels decrease prior to entering the service reservoir, likely through the deposition in the trunk main (Sly, Hodgkinson, and Arunpairojana Citation1990). The difference between the inlet and outlet concentrations suggests that excess manganese has accumulated in the service reservoir (as carry over from the treatment works or from corrosion of the internal structures in the storage tank) and this is now negatively impacting water quality (Peng and Korshin Citation2011).
At site B, regulatory sampling () and NephNet turbidity monitoring reveals the average turbidity, a valuable parameter for determining water quality deterioration (Cook, Husband, and Boxall Citation2016), doubles at the outlet of the service reservoir (0.4 NTU) in comparison to the supplying water treatment works (0.2 NTU). Given the length of the supplying trunk main and the distance between service reservoir sample points, it is unclear whether it is the trunk main deteriorating, or the service reservoir providing a source of material. If the trunk main is responsible, then perhaps the service reservoir may be currently acting as a sink of material, thereby providing water quality benefits by reducing particulate loading.
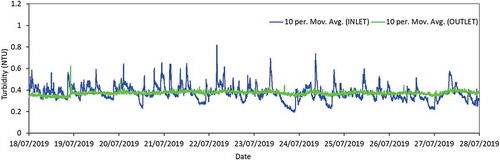
The online turbidity monitoring data for a 10-day period in summer 2019 is shown in . There is greater variability in the values of the incoming turbidity in comparison to the outgoing turbidity, supporting the notion that this service reservoir may be acting as a beneficial sink of material that is being added to the network from the supplying trunk main.
Figure 3. 10-point moving average values for turbidity at the inlet and outlet of the service reservoir (site B) at one-minute intervals
Results from the 24-hour sampling campaign in July 2019 are visualised in and (inlet and outlet, respectively). A Pearson product-moment correlation coefficient was computed using R version 3.4.3. (R Core Team Citation2017) to assess the relationship between hourly turbidity (NTU) values and total iron concentrations (mg/l) for both inlet and outlet samples. There was a strong positive correlation for the inlet turbidity and total iron (r = 0.717, df = 21, p = 0.0001) but no statistically significant correlation for the outlet turbidity and total iron (r = 0.386, df = 21, p = 0.0691).
Figure 4. Inlet turbidity values (NTU) at one-minute intervals and hourly inlet total iron concentrations (mg/l) for the 24-hour sampling campaign at site B
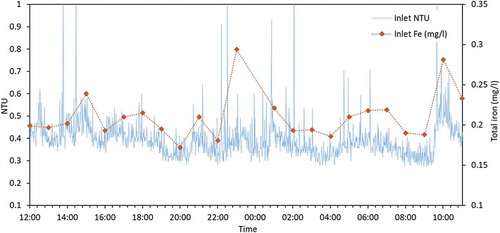
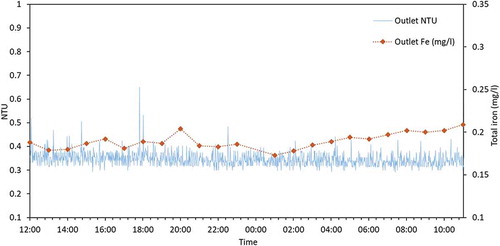
Figure 5. Outlet turbidity values (NTU) at one-minute intervals and hourly outlet total iron concentrations (mg/l) for the 24-hour sampling campaign at site B
Discussion
The aim of this work was to investigate the value of using inlet monitoring at service reservoirs to help capture the location and extent of water quality deterioration in the network. With the addition of inlet monitoring, this work also aimed to improve understanding on how material and key water quality parameters are transported through service reservoirs.
Current sampling requirements, supported by the additional monitoring, show that water quality deteriorates after leaving water treatment works. This is clear from historical data for total iron, total manganese, and turbidity from the service reservoir outlet at site A, and total iron from the district metered area of site B ( and ). However, with the inclusion of inlet monitoring, it becomes possible to determine where this deterioration is occurring. For instance, without inlet monitoring at site A, it would not be possible to show that the supplying trunk mains (one steel and one cement-lined ductile iron) are the likely source of increased iron (). Conversely, when applied to total manganese, inlet monitoring shows that the service reservoir is contributing this metal into the network (). This information could justify a service reservoir clean and monitoring post clean could be used to evaluate the benefit of the intervention and indicate future maintenance strategies or scheduling. Unfortunately, operational issues limited sampling frequency at site A, making it difficult to determine whether seasonal variation or changes in operation of the service reservoir had an influence on the results. Nevertheless, the available data provide valuable and actionable information about water quality processes at site A than is currently possible to obtain from regulatory sampling alone.
With just outlet monitoring at site B () and based on the historical water quality data at the supplying treatment works (), it could be assumed that the service reservoir is contributing to higher turbidity. However, with the addition of inlet monitoring (), the sampling results indicate that the service reservoir is instead beneficially removing material from the water and shows that the elevated turbidity is emanating from the trunk main (unlined cast iron) supplying this site. At present, it is not known whether this behaviour can be observed at all times of the year as sampling for this work was only conducted in summer. Even so, a 10-day sampling campaign was enough to provide previously non-existent information on the location of deterioration at this site.
Results from this work also highlight the value of monitoring turbidity and metals (critical indicators of water quality) at the inlet and outlet of service reservoirs. This monitoring helps improve understanding on service reservoir performance with respect to transport of material through these. For instance, both turbidity and metals are linked to a number of water quality problems, including a decrease in disinfection efficacy (AWWA Citation2011). Results from the 24-hour sampling campaign at site B ( and ) show correlation between total iron and turbidity, supporting other studies (Seth et al. Citation2004; Vreeburg, Schaap, and van Dijk Citation2004), and suggest turbidity could be used as a simple and rapid surrogate indicator for iron. If iron concentration changes with turbidity, then based on the results from , it can be deduced that iron particles and other iron-containing material are settling within this service reservoir, reducing water quality risk, primarily discolouration, in the downstream network. Comparing the inlet and outlet behaviours may also then indicate when benefits expire, as results from site A demonstrate, the performance of a service reservoir can change over a few months. Thus, regular monitoring at both inlet and outlet is critical to allow water companies to respond proactively to potential water quality incidents and as required for specific assets, rather than relying on the more common and widespread reactive approaches (Kirmeyer et al. Citation1999; Vreeburg and Boxall Citation2007).
Using enhanced sampling at service reservoirs to improve risk management has the potential to save water companies money and time. Routine cleaning of service reservoirs is recommended at different frequencies in different jurisdictions, typically every three to five years (Lambertini et al. Citation2011; Brandt et al. Citation2016), but these recommendations are not based on actual performance data. This can lead to unnecessary investigations, which can incur significant costs per investigation (Ellis et al. Citation2018). A reactive response to an outlet bacteriological sample failure at a storage tank will also lead to an investigation (Environment Agency Citation2010). In many cases, such investigations do not produce a root cause for the failure, which means that it is impossible to target remedial action and so the costs of the investigation cannot be justified (Ellis Citation2013). Cleaning a service reservoir typically requires the facility to be drained and taken out of service, causing a disruption to water supply and making such interventions undesirable (Brandt et al. Citation2016). As site-specific factors and water quality characteristics will play a significant role in fouling rates, incorporating diagnostic sampling at service reservoirs can help determine a more appropriate maintenance frequency based on past performance, which could eliminate the repeat of costly errors (Kirmeyer et al. Citation1999). This is especially important, as the impact of service reservoirs on water quality is not always negative as demonstrated here, despite the association with water quality deterioration and regulatory failures (NRC Citation2006; Ellis et al. Citation2018). For example, site B was shown to be removing material from the water supply, improving water quality () and this will continue until the material is remobilised. As for site A, without inlet monitoring, the assumption that the service reservoir is contributing iron into the network () would usually lead the host water company to take it out of service for inspection, which is difficult to do with a 90 ML tank. With inlet monitoring, it is clear that the supplying trunk mains are responsible for the influx of iron and the water company might benefit from a flow conditioning programme instead to remove the source of this accumulated material (Husband and Boxall Citation2015). This would cost less than a service reservoir inspection as flow can be increased gradually and remotely, without the need to take any assets out of supply. Conversely, this same service reservoir seems to be adding manganese to the downstream network (), which could be an indication of corrosion in the tank and should be investigated (Peng and Korshin Citation2011). Either way, the extra knowledge from doing additional monitoring can help the water company make proactive and justifiable decisions about when to schedule an intervention.
As most service reservoirs do not currently have a functioning inlet sample line and tap, there is a cost involved in the initial installation, the amount depending on specific site configuration. However, based on the potential to avoid unnecessary investigations, it would be a short-term investment for a long-term gain. Ideally, installation should be during initial construction, or at least during renovation or structural maintenance.
This work also provides a comparison between the benefits and limitations of periodic and continuous sampling. Mirroring the current periodic regulatory outlet sampling at the inlet would not require a lot of additional time, as it would simply involve water companies taking one extra sample from their service reservoirs, although it would add to the cost spent on analysis. However, periodic sampling alone rarely captures real-time events, making it difficult to alert, identify or validate causes for water quality issues (Sadiq, Kleiner, and Rajani Citation2007). Grayman and Kirmeyer (Citation2000) suggest that for characterisation of water quality in storage tanks, a more intensive sampling regime should be established. In this work, both periodic (site A) and continuous (site B) sampling were carried out. The results have demonstrated that although both are valuable in providing information on service reservoir performance, continuous sampling is more reliable as it captures and analyses water quality variation in real-time. The 10-day continuous sampling at site B () provided more in-depth information on the performance of this site than periodic sampling at site A did across an entire year. Furthermore, operational difficulties at site A meant that months of data were lost, partly due to lack of company resource to carry out the manual collection of samples. Periodic sampling also requires a wait time for the sample to undergo analysis in the laboratory, whereas online continuous sampling produces immediate results. The 24-hour continuous sampling regime at site B ( and ) also helped capture water quality changes with the patterns of diurnal demand, which is not possible to do with weekly (periodic) sampling. The downfall of continuous sampling is the cost of purchasing, installing, and maintaining the equipment. However, this type of proactive monitoring can help water companies move towards an operational paradigm in which active monitoring provides reliable indication of asset performance and will therefore improve operational management and cost in the long term. Irrespective of approach, monitoring water quality (at the inlet and outlet) can allow for the assessment of service reservoir performance and provide valuable information concerning operations, distribution, and treatment (Kirmeyer et al. Citation1999). Although the results of this work contribute to the current understanding of service reservoir performance, there are a number of limitations to take into consideration for future research. The study sites in this work were similar with respect to configuration (rectangular twin-compartment), material (reinforced concrete), secondary disinfectant (chlorine), and source water (surface). Such network structure is common, but for the purposes of obtaining extensive understanding on storage tank performance, it is important to incorporate a greater variation of sites in future work. For instance, storage tank configuration can have an influence on mixing conditions (Zhang et al. Citation2014), source water type can influence water chemistry (Brandt et al. Citation2016), and storage tank material can leach different organic chemicals into supply (AWWA Citation1996). Supplying trunk main material is also important to consider as pipe material can influence rates of corrosion and biofilm growth (AWWA Citation2011; Fish, Osborn, and Boxall Citation2016). Due to operational difficulties and time constraints, it was not possible to capture the influence of seasonal variation on sample results in this work. It is recommended that a more long-term, continuous, sampling campaign be conducted to overcome this limitation as temperature can affect stratification, microbial growth, corrosion, and disinfectant efficacy in service reservoirs (Horsley et al. Citation1998; Fisher et al. Citation2009). It was also not in the scope of this work to conduct bacteriological sampling, but the hope is to include continuous online monitoring tools, such as flow-cytometry, to identify changes in bacterial numbers between the inlet and outlet of storage tanks in future work. If working with a chloraminated network, it would be of value to incorporate ammonium, nitrates, and nitrites into the sampling programme, as storage tanks in chloraminated networks are likely to have nitrification issues (Wilczak et al. Citation1996; Kirmeyer et al. Citation1999).
While recognising the limitations of this work and the need for further research on the best indicators and monitoring approaches for the determination of service reservoir performance, it is evident that there is operational value of inlet monitoring at service reservoirs.
Conclusions
There are currently no requirements to monitor water quality at the inlet of service reservoirs, making it impossible to determine the impact of the distribution infrastructure on incoming water quality or how it changes with transport through these essential assets. In this study, inlet sample lines were installed, in addition to existing outlet monitoring, at two UK service reservoirs and the fate of key water quality parameters investigated. Results have shown that:
Water quality deteriorates as it leaves water treatment works through interactions with distribution network pipe and storage infrastructure.
Service reservoirs can have both a beneficial and negative impact on water quality.
Monitoring at the inlet of service reservoirs can help identify the location and magnitude of water quality deterioration in the network and provide information on asset performance, helping to inform proactive maintenance scheduling.
Short-term continuous sampling at service reservoirs can be more beneficial than periodic sampling.
In addition, results specific to test sites in this study show that:
Water quality deterioration is likely occurring in the supplying trunk mains at both service reservoir sites A and B.
The service reservoir at site A is acting as a source of manganese, negatively impacting water quality, whilst both sites A and B are acting as sinks of iron, which is at present improving downstream water quality. This behaviour could be used as a proactive water quality management indicator for both sites.
Acknowledgements
The authors extend their thanks to the participating water companies on the project, namely Anglian Water, Dwr Cymru Welsh Water, Northumbrian Water, and Scottish Water, for their input and support, both financial and otherwise.
Disclosure statement
No potential conflict of interest was reported by the authors.
Additional information
Funding
References
- ATi UK. 2011. Accessed 14 April 2020. http://www.atiuk.com/water-monitors/nephnet-portable-turbidity-monitor/default.aspx
- AWWA. 1996. Internal Corrosion of Water Distribution Systems. Denver, Colorado: AWWA.
- AWWA. 2006. Fundamentals and Control of Nitrification in Chloraminated Drinking Water Distribution Systems. 3rd ed. Denver, Colorado: AWWA.
- AWWA. 2011. Water Quality & Treatment: A Handbook on Drinking Water. Edited by J. K. Edzwald. New York: McGraw-Hill.
- Benson, A. S., A. M. Dietrich, and D. L. Gallagher. 2012. “Evaluation of Iron Release Models for Water Distribution Systems.” Critical Reviews in Environmental Science and Technology 42 (1): 44–97. doi:10.1080/10643389.2010.498753.
- Blokker, E. J. M., and P. G. Schaap. 2015. “Particle Accumulation Rate of Drinking Water Distribution Systems Determined by Incoming Turbidity.” Procedia Engineering 119 (1): 290–298. Elsevier B. V. doi:10.1016/j.proeng.2015.08.888.
- Boxall, J. B., P. J. Skipworth, and A. J. Saul. 2003. “Aggressive Flushing for Discolouration Event Mitigation in Water Distribution Networks.” Water Science and Technology: Water Supply 3 (1–2): 179–186.
- Brandt, M. J., K. M. Johnson, A. J. Elphinston, and D. D. Ratnayaka. 2016. Twort’s Water Supply. 7th ed. Oxford: Elsevier Science, Butterworth-Heinemann.
- Clark, R. M., E. E. Geldreich, K. R. Fox, E. W. Rice, C. H. Johnson, J. A. Goodrich, J. A. Barnick, F. Abdesaken, J. E. Hill, and F. J. Angulo. 1996. “A Waterborne Salmonella Typhimurium Outbreak in Gideon, Missouri: Results from A Field Investigation.” International Journal of Environmental Health Research 6 (3): 187–193. doi:10.1080/09603129609356889.
- Cook, D. M., P. S. Husband, and J. B. Boxall. 2016. “Operational Management of Trunk Main Discolouration Risk.” Urban Water Journal 13 (4): 382–395. doi:10.1080/1573062X.2014.993994.
- Craun, G. F., and R. L. Calderon. 2001. “Waterborne Disease Outbreaks Caused by Distribution System Deficiencies.” Journal - American Water Works Association 93 (9): 64–75. doi:10.1002/j.1551-8833.2001.tb09287.x.
- Douterelo, I., R. L. Sharpe, and J. B. Boxall. 2013. “Influence of Hydraulic Regimes on Bacterial Community Structure and Composition in an Experimental Drinking Water Distribution System.” Water Research 47 (2): 503–516. doi:10.1016/j.watres.2012.09.053.
- DWI. 2018. Drinking Water 2018: A Report by the Chief Inspector of the Drinking Water Inspectorate. London: Drinking Water Inspectorate.
- DWI. 2020. Guidance on the Implementation of the Water Supply (Water Quality) Regulations 2016 (As Amended) in England and the Water Supply (Water Quality) Regulations (Wales) 2018. Part 3 – Wholesomeness, Regulation 4. London: Drinking Water Inspectorate. Accessed 10 April 2020. http://www.dwi.gov.uk/stakeholders/guidance-and-codes-of-practice/wswq/index.html
- DWI. 2020a. Guidance on the Implementation of the Water Supply (Water Quality) Regulations 2016 (As Amended) in England and the Water Supply (Water Quality) Regulations (Wales) 2018. Part 4 – Monitoring of Water Supplies, Regulations 5-10. London: Drinking Water Inspectorate. Accessed 11 April 2020. http://www.dwi.gov.uk/stakeholders/guidance-and-codes-of-practice/wswq/index.html
- DWI. 2020b. Guidance on the Implementation of the Water Supply (Water Quality) Regulations 2016 (As Amended) in England and the Water Supply (Water Quality) Regulations (Wales) 2018. Part 5 – Monitoring Additional Provisions, Regulations 11-16.1. London: Drinking Water Inspectorate. Accessed 11 April 2020. http://www.dwi.gov.uk/stakeholders/guidance-and-codes-of-practice/wswq/index.html
- DWQR. 2018. Drinking Water Quality in Scotland 2018 Public Water Supply. Edinburgh: Drinking Water Quality Regulator for Scotland.
- Ellis, K., 2013. “Improving Root Cause Analysis of Bacteriological Water Quality Failures.” Doctoral dissertation, University of Sheffield.
- Ellis, K., C. Gowdy, N. Jakomis, B. Ryan, C. Thom, C. A. Biggs, and V. Speight. 2018. “Understanding the Costs of Investigating Coliform and E. Coli Detections during Routine Drinking Water Quality Monitoring.” Urban Water Journal 15 (2): 101–108. doi:10.1080/1573062X.2017.1398762.
- Environment Agency. 2010. The Microbiology of Drinking Water (2010) – Part 2 – Practices and Procedures for Sampling. Methods for the Examination of Waters and Associated Materials. Standing Committee of Analysts (SCA). Accessed 10 April 2020. http://www.standingcommitteeofanalysts.co.uk/library
- Fish, K. E., A. M. Osborn, and J. B. Boxall. 2016. “Characterising and Understanding the Impact of Microbial Biofilms and the Extracellular Polymeric Substance (EPS) Matrix in Drinking Water Distribution Systems.” Environmental Science: Water Research & Technology 2 (4): 614–630. Royal Society of Chemistry.
- Fisher, I., A. Sathasivan, P. Chuo, and G. Kastl. 2009. “Effects of Stratification on Chloramine Decay in Distribution System Service Reservoirs.” Water Research 43 (5): 1403–1413. doi:10.1016/j.watres.2008.12.012.
- Gauthier, V., B. Barbeau, R. Millette, and M. Prévost. 2001. “Suspended Particles in the Drinking Water of Two Distribution Systems.” Water Science and Technology: Water Supply 1 (4): 237–245.
- Gauthier, V., M. C. Besner, B. Barbeau, R. Millette, and M. Prevost. 2000. “Storage Tank Management to Improve Drinking Water Quality: Case Study.” Journal of Water Resources Planning and Management 126 (4): 221–228. ASCE. doi:10.1061/(ASCE)0733-9496(2000)126:4(221).
- Gerke, T. L., B. J. Little, and B. J. Maynard. 2016. “Manganese Deposition in Drinking Water Distribution Systems.” Science of the Total Environment 541: 184–193. doi:10.1016/j.scitotenv.2015.09.054.
- Grayman, W. M., and G. J. Kirmeyer. 2000. Quality of Water in Storage. Water Distribution Systems Handbook, 11–1. New York: McGraw-Hill.
- Grayman, W. M., L. A. Rossman, C. Arnold, R. Deininger, C. Smith, J. F. Smith, and R. Schnipke. 1999. Water Quality Modelling of Distribution System Facilities. Denver, Colorado: AWWARF.
- Hach. 2020. Accessed 14 April 2020. https://uk.hach.com/as950-peristaltic-samplers/family?productCategoryId=30680446366
- Horsley, M. B., B. W. Northup, W. J. O’Brien, and L. L. Harms. 1998. “Minimizing Iron Corrosion in Lime Softened Water.” In Proceedings of the 1998 AWWA WQTC Conference, San Diego, CA. Denver, Colorado: AWWA.
- Husband, P. S., and J. Boxall. 2015. “Predictive Water Quality Modelling and Resilience Flow Conditioning to Manage Discolouration Risk in Operational Trunk Mains.” Journal of Water Supply: Research and Technology 64 (5): 529–542. AQUA. doi:10.2166/aqua.2014.042.
- Husband, P. S., and J. B. Boxall. 2011. “Asset Deterioration and Discolouration in Water Distribution Systems.” Water Research 45 (1): 113–124. doi:10.1016/j.watres.2010.08.021.
- Husband, P. S., M. Jackson, and J. B. Boxall. 2015. “Identifying Material Accumulation Processes in Drinking Water Distribution Systems with Extended Period EPANET MSX Turbidity Simulations.” Procedia Engineering 119: 398–406. doi:10.1016/j.proeng.2015.08.901.
- Husband, S. P., K. E. Fish, I. Douterelo, and J. B. Boxall. 2016. “Linking Discolouration Modelling and Biofilm Behaviour within Drinking Water Distribution Systems.” Water Science and Technology: Water Supply 16 (4): 942–950.
- Jjemba, P., W. Johnson, Z. Bukhari, and M. LeChevallier. 2014. “Review of the Leading Challenges in Maintaining Reclaimed Water Quality during Storage and Distribution.” Journal of Water Reuse and Desalination 4 (4): 209–237. doi:10.2166/wrd.2014.001.
- Kirmeyer, G. J., L. Kirby, B. M. Murphy, P. F. Noran, K. D. Martel, T. W. Lund, J. L. Anderson, and R. Medhurst. 1999. Maintaining Water Quality in Finished Water Storage Facilities. Denver, Colorado: AWWARF and AWWA.
- Kirmeyer, G. J., M. Friedman, J. Clement, A. Sandvig, P. F. Noran, K. D. Martel, D. Smith, et al. 2000. Guidance Manual for Maintaining Distribution System Water Quality. Report Number. 90798. Denver: Colorado AWWARF and AWWA.
- Lambertini, E., S. K. Spencer, B. A. Kieke, F. J. Loge, and M. A. Borchardt. 2011. “Virus Contamination from Operation and Maintenance Events in Small Drinking Water Distribution Systems.” Journal AWWA 9 (4): 799–812.
- LeChevallier, M. W., T. M. Evans, and R. J. Seidler. 1981. “Effect of Turbidity on Chlorination Efficiency and Bacterial Persistence in Drinking Water.” Applied Environmental Microbiology 42 (1): 159–167. doi:10.1128/AEM.42.1.159-167.1981.
- Lee, E. J., and K. J. Schwab. 2005. “Deficiencies in Drinking Water Distribution Systems in Developing Countries.” Journal of Water and Health 3 (2): 109–127. doi:10.2166/wh.2005.0012.
- McCabe, L. J., J. M. Symons, R. D. Lee, and G. G. Robeck. 1970. “Survey of Community Water Supply Systems.” Journal - American Water Works Association 62 (11): 670–687. doi:10.1002/j.1551-8833.1970.tb03990.x.
- McCoy, W. F., and B. H. Olsen. 1986. “Relationship among Turbidity, Particle Counts and Bacteriological Quality within Water Distribution Lines.” Water Research 20 (8): 1023–1029. doi:10.1016/0043-1354(86)90045-X.
- Mounce, S. R., R. B. Mounce, and J. B. Boxall. 2016. “Case-based Reasoning to Support Decision Making for Managing Drinking Water Quality Events in Distribution Systems.” Urban Water Journal 13 (7): 727–738. doi:10.1080/1573062X.2015.1036082.
- Norton, C. D., and M. W. LeChevallier. 2000. “A Pilot Study of Bacteriological Population Changes through Potable Water Treatment and Distribution.” Applied and Environmental Microbiology 66 (1): 268–276. doi:10.1128/AEM.66.1.268-276.2000.
- NRC. 2006. National Research Council: Drinking Water Distribution Systems: Assessing and Reducing Risks. Washington, DC: National Academy Press.
- Peng, C. Y., and G. V. Korshin. 2011. “Speciation of Trace Inorganic Contaminants in Corrosion Scales and Deposits Formed in Drinking Water Distribution Systems.” Water Research 45 (17): 5553–5563. doi:10.1016/j.watres.2011.08.017.
- R Core Team. 2017. R: A Language and Environment for Statistical Computing. Vienna, Austria: R Foundation for Statistical Computing. http://www.R-project.org/
- Rossman, L. A., R. M. Clark, and W. M. Grayman. 1994. “Modeling Chlorine Residuals in Drinking-water Distribution Systems.” Journal of Environmental Engineering 120 (4): 803–820. doi:10.1061/(ASCE)0733-9372(1994)120:4(803).
- Sadiq, R., Y. Kleiner, and B. Rajani. 2007. “Water Quality Failures in Distribution Networks—Risk Analysis Using Fuzzy Logic and Evidential Reasoning.” Risk Analysis: An International Journal 27 (5): 1381–1394. doi:10.1111/j.1539-6924.2007.00972.x.
- Sarin, P., V. L. Snoeyink, J. Bebee, K. K. Jim, M. A. Beckett, W. M. Kriven, and J. A. Clement. 2004. “Iron Release from Corroded Iron Pipes in Drinking Water Distribution Systems: Effect of Dissolved Oxygen.” Water Research 38 (5): 1259–1269. doi:10.1016/j.watres.2003.11.022.
- Seth, A., R. Bachmann, J. Boxall, A. Saul, and R. Edyvean. 2004. “Characterisation of Materials Causing Discolouration in Potable Water Systems.” Water Science and Technology 49 (2): 27–32. doi:10.2166/wst.2004.0080.
- Slaats, P. G. G., L. P. M. Rosenthal, W. G. Siegers, M. van den Boomen, R. H. S. Beuken, and J. H. G. Vreeburg. 2003. Processes Involved in the Generation of Discolored Water. Report Number 90966F. Denver, Colorado: AWWARF.
- Sly, L. I., M. C. Hodgkinson, and V. Arunpairojana. 1990. “Deposition of Manganese in a Drinking Water Distribution System.” Applied and Environmental Microbiology 56 (3): 628–639. doi:10.1128/AEM.56.3.628-639.1990.
- van der Wende, E., and W. G. Characklis. 1990. “Biofilms in Potable Water Distribution Systems.” In Drinking Water Microbiology, edited by G. A. McFeters. New York: Springer-Verlag:249–268.
- Vreeburg, J. H. G., D. Schippers, J. Verberk, and J. van Dijk. 2008. “Impact of Particles on Sediment Accumulation in a Drinking Water Distribution System.” Water Research 42 (16): 4233–4242. doi:10.1016/j.watres.2008.05.024.
- Vreeburg, J. H. G., and D. J. B. Boxall. 2007. “Discolouration in Potable Water Distribution Systems: A Review.” Water Research 41 (3): 519–529. doi:10.1016/j.watres.2006.09.028.
- Vreeburg, J. H. G., P. G. Schaap, and J. C. van Dijk. 2004. “Particles in the Drinking Water Systems: From Source to Discolouration.” Water Science Technology 4 (5–6): 431–438.
- Wilczak, A., J. G. Jacangelo, J. P. Marcinko, and L. H. Odell. 1996. “Occurrence of Nitrification in Chloraminated Distribution Systems.” Journal - American Water Works Association 88 (7): 74. doi:10.1002/j.1551-8833.1996.tb06586.x.
- Zacheus, O. M., M. J. Lehtola, L. K. Korhonen, and P. J. Martikainen. 2001. “Soft Deposits, the Key Site for Microbial Growth in Drinking Water Distribution Networks.” Water Research 35 (7): 1757–1765. doi:10.1016/S0043-1354(00)00431-0.
- Zhang, J. M., H. P. Lee, B. C. Khoo, K. Q. Peng, L. Zhong, C. W. Kang, and T. Ba. 2014. “Shape Effect on Mixing and Age Distributions in Service Reservoirs.” Journal - American Water Works Association 106 (11): E481–E491. doi:10.5942/jawwa.2014.106.0094.