
 ?Mathematical formulae have been encoded as MathML and are displayed in this HTML version using MathJax in order to improve their display. Uncheck the box to turn MathJax off. This feature requires Javascript. Click on a formula to zoom.
ABSTRACT
An increasing interest in retrofitting rooftops as green roofs require improved understanding of the impact on runoff within urban catchments. In this study, a model of Risvollan, an urban catchment in the coastal city of Trondheim, Norway was built using the PCSWMM (Storm Water Management Model) model version 7.2.2780. Rooftops in the catchment were retrofitted as green (vegetated) or grey (non-vegetated – expanded clay, detention-based) roofs. The detention impact was evaluated for nine scenarios using three exceedance thresholds by measuring runoff at the catchment outlet. It was found that implementing green roofs on as little as 11% of the roof area can substantially reduce maximum flows. The implementation of the grey roofs outperformed the green roofs in all the investigated aspects: duration, number, and volume. The study provides insight to urban planners and decision-makers in how to quantify the contribution of rooftop detention to runoff reduction for stormwater management.
Introduction
The drainage systems in urban areas are exposed to excessive stress due to urbanization resulting in increasing impervious covers, and climate change resulting in randomly occurring heavier precipitation, (among others: (Shuster et al. Citation2005; Semadeni-Davies et al. Citation2008; Haase Citation2009; Jha, Bloch, and Lamond Citation2012)). Moreover, excessive stormwater, commonly polluted by wastewater in combined sewer systems, causes surcharging of manholes, local street, and basement flooding, and may contaminate groundwater through infiltration and pollute receiving waters (Novotny Citation2002; Semadeni-Davies et al. Citation2008). This significantly reduces the quality in water reservoirs, rivers and streams, which serve as drinking sources, bathing waters, or as a natural habitat for aquatic animals (Goel Citation2006; Postel and Richter Citation2012).
The way of designing drainage systems has transformed from closed pipe systems towards sustainable stormwater solutions (Chocat et al. Citation2007). This means that urban drainage has become a complex system that involves diverse approaches where the design and decision-making process is driven by multiple objectives (Marsalek and Chocat Citation2002; Zhou Citation2014). Many principles and practices are included, often using different terminology based on the location they are utilized in, or the scope they cover, among others: Low Impact Development (LID), Best Management Practices (BMPs), Sustainable Urban Drainage System (SUDS), Green Infrastructure (GI), Water Sensitive Urban Drainage (WSUD), or Nature-Based Solution (NBS) (Fletcher et al. Citation2015). They found significant overlap between different sets of terms in urban drainage terminology which is: ‘(i) mitigation of changes to hydrology and evolution towards a flow regime as much as feasible towards natural level for local environmental objectives and (ii) improvement of water quality and reduction of pollutants’. The Norwegian Water Association has adopted a three-step train for stormwater management, which applies infiltration (retention) based solutions for small events, infiltration and additional detention for the medium events, and safe floodways for large events (according to the authors, the storm intensity should be set based on local precipitation information) (Lindholm et al. Citation2008).
In this study, the focus has been on stormwater management using retrofitted rooftops, which are commonly known as vegetated green roofs (in this paper: ‘green roofs’). They benefit from their detention of peak flows, as well as retention abilities through the evapotranspiration of water during dry periods (Voyde et al. Citation2010; Stovin, Poë, and Berretta Citation2013; Stovin et al. Citation2015). A pressing issue related to stormwater management in urban areas is the lack of space for sustainable stormwater measures. At the same time, impervious rooftops represent a large unused potential for retrofitting sustainable stormwater management through green roof solutions (Dunnett and Kingsbury Citation2008). In the Norwegian stormwater management train solutions applied to rooftops offer detention and retention primarily targeting the first step, the small events (Johannessen, Muthanna, and Braskerud Citation2018). Medium events are partially retained on the roof and partially detained and released as delayed runoff. Some work has been conducted to study rooftops detention on a building scale (Stovin, Vesuviano, and De-Ville Citation2017; Johannessen, Muthanna, and Braskerud Citation2018). Recently, new research dealing with rooftops retrofitted with a lightweight expanded clay (also called ‘LECA-based roofs’, in this paper used: ‘grey roofs’) has demonstrated the potential to handle even larger rainfalls at building scale pilot (Hamouz et al. Citation2018). However, detention-based rooftop solutions have only to a small extent been explored worldwide. Additionally, on the catchment scale specifically, there is a research gap on the hydrological contribution of stormwater management options for rooftops’ contribution to runoff reduction within a catchment (Khader and Montalto Citation2009; Krebs et al. Citation2013).
In order to develop better management techniques, civil and environmental engineers rely on computer simulation tools, and advanced mathematical modelling to design urban water systems and predict water system performance (Adams Citation2000; Mitchell, Mein, and Mcmahon Citation2001; House‐Peters and Chang Citation2011). In this context, a model setup with the high spatial and temporal resolution is required for the simulation of rooftops for stormwater management (LID controls and green infrastructure) due to the high complexity of urban environments (Elliott and Trowsdale Citation2007; Krebs et al. Citation2013). In this paper, the Storm Water Management Model (PCSWMM) was selected for quantification of the efficiency of green or grey roof implementation in an urban catchment for long-term continuous datasets. The motivation for this study was to investigate the green and grey roof contribution towards runoff reduction at the catchment outlet to quantify the potential catchment scale stormwater management benefit of these solutions. In urban areas with combined sewer systems, the outlet point of a catchment would also typically be the location of a combined sewer overflow structures, where runoff reduction will reduce combined sewer overflow to recipients.
The aforementioned knowledge gap in the catchment scale performance potential was the motivation for the study. The study aims to provide an extensive investigation of the model performance, and limitations on a catchment scale for use as a decision support tool for the implementation of detention-based roof systems. The objectives were to: i) quantify the green and grey roofs contribution to runoff reduction in urban catchments, ii) investigate to what extent the detention-based roof implementation reduces peak flows, runoff duration, number of occurrences, and discharged volume over certain exceedance threshold, iii) examine how the roof area and the catchment slope impact the runoff volumes, and iv) identify the most sensitive parameter(s) within the catchment model.
Materials and methods
Study area and input data
This study contains data from two field stations (study sites) located in Trondheim, Norway. The first field station serves as a full-scale testing facility for rooftop stormwater management solutions at Høvringen (, 63°26ʹ47.5”N 10°20ʹ11”E) equipped with a meteorological station, including a high-resolution precipitation gauge and ultrasonic wind sensors. Data from this field station were used as input to the roof configurations, this data originates from previously published studies (Hamouz et al. Citation2018; Hamouz and Muthanna Citation2019; Johannessen et al. Citation2019). The second site is an urban hydrological research catchment at Risvollan (, catchment outlet 63°23ʹ55.1”N 10°25ʹ22”E) established by the Norwegian University of Science and Technology (NTNU) together with the city of Trondheim and Norwegian Water Resources and Energy Directorate (NVE), used for long-term monitoring and data collection of hydraulic and hydrological processes in the urban area (Matheussen Citation2004; Hailegeorgis and Alfredsen Citation2018).
Figure 1. Green and grey roof in cross-section used in the implementation strategy within the experimental catchment
The Risvollan experimental urban catchment has separate sewers for wastewater and stormwater and is located at a ground elevation ranging from 85 to 134 m above sea level in Trondheim, Norway (). It occupies 20.6 ha which is characterized as 57% pervious and 43% impervious landuse. The catchment delineation was carried out in ArcGIS Desktop 10.7 (Environmental Systems Research Institute, California, USA) using high-resolution aerial photographs (https://kartkatalog.geonorge.no) and digital elevation model (DEM) was made out of light detection and ranging (LiDAR) data with a resolution of 25 cm (https://hoydedata.no/LaserInnsyn/). It is a remote sensing technique for 3D terrain mapping, which measures the distance to a target illuminating the target with laser light and measuring the reflected light with a sensor. In order to evaluate different rooftops scenarios, a detailed spatial analysis of the catchment surface had to be carried out. The catchment was subdivided using eight surface type categories (expressed as a percentage of the total area in the next paragraph). A further subdivision, defining flow routing between sub-catchments and subareas as well as identifying the network inlets, were determined using topographical and in-situ observations.
All green areas were considered as pervious, thus equal to 57%, whereas the impervious areas were represented by 8.9 % roads, 6.3 % parking lots, 2.9 % paths, 11.9 % courtyards, 1.2 % playgrounds, 1% pitched rooftops and 10.7 % flat roofs. It was some uncertainty whether the whole 11.9 % of the courtyards should be considered impervious, as they also could include flower beds and vegetated patches. There was also a lack of information if the courtyards are connected to the drainage network. Therefore, it was left as a parameter to be potentially calibrated. The native soils of the catchment are characterized by marine deposits with high clay content and therefore, naturally poor infiltration. The sea and fjord deposits usually have low permeability due to fine-grained clay with a continuous layer from 0.5 m to several tens of meters.
Figure 2. Location map (the city of Trondheim marked by the yellow star), Risvollan catchment with gauging station (marked by the blue star), the stormwater drainage network, and flat roofs (marked yellow) chosen for green and grey roofs implementation. In total, 45 subcatchments form the whole catchment and 25 subcatchments contain flat roofs (pitched roofs were not considered) which are potential for retrofitting
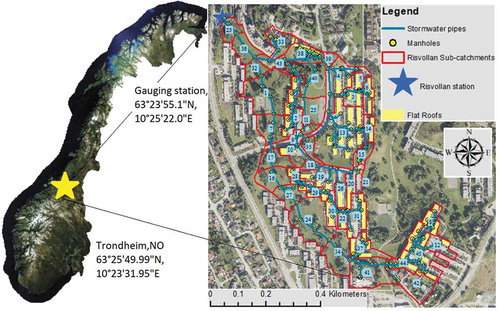
The gauging station in the Risvollan catchment is located at the catchment outlet (shown in by the blue star) measuring precipitation, air temperature, wind speed, and rainfall-runoff. During the year 2017, it was registered 1146 mm of precipitation by a heated tipping bucket rain gauge (Lambrecht meteo GmbH, Göttingen, Germany) with a resolution of 0.1 mm at 1-min intervals and with an accuracy of ± 2%, and 502 mm of runoff using a V-notch weir equipped by a pressure sensor (IMCTL Submersible level & temperature transmitter) at 1-min intervals with an accuracy of ±0.1%. There was a negligible amount of missing data for the precipitation (0.004%), and a relatively low number of missing flow records (8.5%). Unfortunately, some of the missing data were during one of the largest events which occurred on 29.8.2017 between 18:13 and 18:46. The air temperature was measured with a temperature probe (Vaisala HMP45) ranging from −15.8°C to 28.5°C with an average value of 5.9°C and accuracy ± 0.2°C at 20°C and wind speed using an ultrasonic anemometer (Young 85,004) ranging from 0.56 km/h to 8.51 km/h with an average value of 2.59 km/h and accuracy ±2% for wind speed within 0 to 108 km/h (). According to the local climate, the year was divided into a cold period from October to April and a warm period from May to September. This was done in order to assess the model performance for summer and winter conditions, which is important in a country like Norway where winter operations and performance are important design criteria.
Model description and parameter estimation
This study used the PCSWMM Professional model version 7.2.2785 (64-bit) (Computation Hydraulics International, Ontario, Canada) with the SWMM 5.1.013 hydrology and hydraulics engine, which was primarily developed for modelling of water quantity and quality in urban areas for both short- and long-term simulation runs (James, Rossman, and James Citation2010). The PCSWMM model is a modelling software for stormwater, wastewater, watershed, and water distribution systems (https://www.pcswmm.com/), including import functions for entity and attribute data from GIS (Geographic Information System) formats as well as the coordinate system of the desired location. The PCSWMM model is also a spatial decision support system for stormwater management modelling, which was essential for the model selection in this study. Another important factor for the choice of modelling tool was the PCSWMM’s LID control editor with building- scale resolutions. The simulation engine is the EPA’s SWMM model with its LID Control editor (Rossman Citation2015). The Rainfall/Runoff, Snow melt, and Flow routing processes were used to simulate stormwater flow through the system. The Green-Ampt method was applied for infiltration from pervious areas, and the dynamic wave was used for flow routing. The dynamic wave routing solves the complete 1-D (one-dimensional) Saint-Venant flow equations. These equations contain the continuity and momentum equations for conduits and volume continuity equation at nodes and account for channel storage, backwater, entrance/exit losses, flow reversal, and pressurized flow. The model distinguishes several computation time steps for reporting, dry weather runoff, wet weather runoff, and flow routing through the drainage system (James, Rossman, and James Citation2010). Sub-catchments in the PCSWMM model are characterized by the area, width (or flow length), slope, impervious cover, depression storage on the pervious and impervious area, and Manning’s roughness for the pervious and impervious area. The parametrization of the sub-catchment area, width (length), slope, and the fraction of impervious cover was performed using GIS. The municipality of Trondheim provided data for the stormwater network which contains 222 manholes and 222 stormwater conduits with a total length of 4633 m and a diameter ranging from 110 mm to 800 mm conveying the runoff to the catchment outlet. It should be noted that most of the information linked to the pipe depth or invert elevation was missing, for which terrain slope was used as a slope for conduits and inverts were calculated based on slope. The 20.6 ha catchment was subdivided into 45 sub-catchments ranging in size from 0.07 ha to 1.95 ha with 0.46 ha and 14% slope on average. In this study, seven of the sub-catchments had 0% impervious cover and six sub-catchments had impervious coverage exceeding 90%. The Manning’s roughness coefficients were adopted from the SWMM manuals; impervious areas (N Imperv = 0.03); pervious areas (N Perv = 0.4); and conduits (N Cond = 0.014) (James, Rossman, and James Citation2010; Rossman Citation2015). Depression storage for impervious areas (Dstor Imperv = 0.12–0.31) and pervious areas (Dstor Perv = 0.49–1.22) were estimated using EquationEquation (1)(1)
(1) , which applies a coefficient depending on the surface type and ground slope.
where d is depression storage (mm), k is a coefficient depending on the surface type (0.07 for impervious surfaces and 0.28 for pervious surfaces) and s is the ground slope (Butler et al. Citation2018). The parameters related to the Green-Ampt infiltration model (Suction head – soil capillary suction head, Conductivity – Soil saturated hydraulic conductivity and Initial deficit – initial soil moisture deficit) were adopted from a study focused on infiltration estimation using MDP infiltrometer (Becker Citation2016). The parameters related to the green and grey roofs were adopted from the study focusing on modelling of runoff from the green and grey roofs using the EPA’s SWMM model (Hamouz and Muthanna Citation2019).
Objective functions for model evaluation
The model performance was evaluated through a parameter optimization which included a sensitivity analysis of a selected set of parameters, and for individual events using the below-selected criteria suggested based on previous work in the literature (Moriasi et al. Citation2007; Krebs et al. Citation2013; Ritter and Muñoz-Carpena Citation2013) The criteria were the coefficient of determination (R2) (EquationEquation 2(2)
(2) ), the Nash-Sutcliffe model efficiency (NSME) (EquationEquation 3
(3)
(3) ) (Nash and Sutcliffe Citation1970), the per cent volume error (VE) (EquationEquation 4
(4)
(4) ), and the per cent mean flow error (MFE) (EquationEquation 5
(5)
(5) ) (Krebs et al. Citation2013). In general, the NSME indicates how well the simulated data match the observed data, and range between – ∞and 1. The closer the NSME is to 1, the more accurately the model can predict the observed performance. According to Dongquan et al. (Citation2009), an NSME greater than 0.5 indicates acceptable model performance. Thus, parameters fulfilling the requirement of NSME > 0.5, R2 > 0.5 or │errors│ <25% were defined as acceptable model performance. Additionally, the NSME classification according to Ritter and Muñoz-Carpena (Citation2013) was used in the model performance evaluation.
where is the sum of squares of residuals,
is the total sum of squares,
is the observed discharge,
is the simulated discharge,
is the mean of observed discharge,
is the number of observations,
is the observed runoff volume,
is the simulated runoff volume,
is the observed mean flow, and
is the simulated mean flow.
Model evaluation and sensitivity analysis
The precipitation-runoff data were applied as a long-term continuous time series with high resolution. For the model evaluation, 15 periods (events) were selected from the precipitation-runoff data according to the largest registered precipitation or runoff intensity for both the year of calibration 2017 and the year of validation 2018 (, ).
Table 1. The selected monitored and evaluation periods, including date, precipitation depth, precipitation duration, peak precipitation, event duration, runoff depth, and runoff coefficient. The events in bold were considered as warm-period events
The parameters identified from the spatial analysis, in particular, sub-catchment width, slope, and the impervious cover were found to contain errors (explained in ‘Study area and input data’) and were therefore inspected during the sensitivity analysis (Liong, Chan, and Lum Citation1991), e.g. information about where stormwater from courtyards flows in order to determine stormwater redistribution between subareas. A useful feature within the PCSWMM model is the sensitivity-based radio tuning calibration (SRTC) tool, which served to identify sensitive parameters within the model, as well as the minimum number of key parameters for the model calibration (James, Rossman, and James Citation2010). The SRTC tool enables the selection in PCSWMM entity layers (sub-catchments, junctions, conduits, LID editor, or Snow pack) with an allowable tolerance to be initially defined. The sensitivity was tested on 17 parameters: eight parameters within the sub-catchment layer (Flow length – length of overland sheet flow, Slope – average surface slope, % Imperv – percent of impervious area, N Imperv – Manning’s roughness for impervious area, N Perv – Manning’s roughness for pervious area, Dstor Imperv – depth of depression storage on impervious area, Dstor Perv – depth of depression storage on pervious area and Zero Imperv – percent of impervious area with no depression storage), 3 parameters within the Green-Ampt infiltration model (Suction head – soil capillary suction head, Conductivity – Soil saturated hydraulic conductivity and Initial deficit – initial soil moisture deficit), 4 parameters within the Snow Pack layer (Min. and Max. Melt Coeff. – minimum and maximum melt coefficient which used to estimate snowmelt from pervious and impervious area), 1 parameter within the conduits (N Cond – Manning’s roughness coefficient) and 1 parameter within the network junction (Baseline – baseline value in direct inflow). Each parameter was increased and decreased by ±10, and ±50% and the goodness of fit was evaluated for the whole continuous period and period without the appearance of snow and negative temperatures.
Rooftop retrofitting scenarios
According to the spatial analysis, the study catchment has a total of 10.7% flat roofs (yellow-shaded in ), which potentiallyFootnote1 can be retrofitted with a stormwater measure. In total, nine scenarios were created in this study. Flat roofs were changed from a conventional black roof, which was used as a reference called ‘Scenario A’, to either a vegetated green ‘Scenario B, D, F, and H’ or a non-vegetated grey roof ‘Scenario C, E, G, and I’ (). The vegetated green and non-vegetated grey roofs were calibrated using the EPA SWMM Green roof LID module. More information can be found in Hamouz and Muthanna (Citation2019). It was tested how the green and grey roof implementation impacts runoff in the catchment in terms of peak flows, volume reduction, and exceedance of three thresholds (100, 50, and 25 L/s). The thresholds were defined by flow analysis subdividing the high-resolution 1-min flow dataset into three groups according to flow magnitude. The roof area was fictionally doubled () to investigate how this change in proportion between impervious cover and green and grey roofs would affect the runoff. Additionally, placement of the green and grey roofs was investigated to be located upstream and downstream to check whether the location of the retrofitted roofs would be important for runoff alteration in the catchment outlet or not. In this case, the actual roof area (10.7% for the whole catchment) was fictionally located either in downstream subcatchments, or upstream in the subcatchments, however only in subcatchments where the flat roofs appear originally. The entire model setup process conducted in this study is shown in .
Figure 3. A flowchart of the methodology of the study
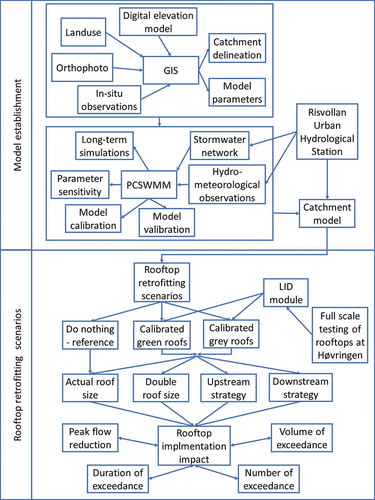
Table 2. Tested rooftops scenarios
Table 3. Sensitivity analysis of selected parameters during the calibration for the whole continuous period and the warm continuous period regarding the objective functions. Model performance with respect to objective functions before and after calibration and for validation. This table contains only a limited part of the parameters tested within the sensitivity analysis; the complete table is shown in Appendix
Table 4. The selected evaluation periods, including coefficient of determination, Nash-Sutcliffe model efficiency, mean flow error, and volume error. The events in bold were considered as warm-period events
Table 5. Impact of the green and grey roofs implementation for different exceedance thresholds 100, 50, and 25 L/s with respect to the evaluation criteria. Scenario A, B and C from
Table 6. Impact of the green and grey roofs implementation with doubled roof size for different exceedance thresholds 100, 50 and 25 L/s with respect to the evaluation criteria. Scenario A, D and E from
Results and discussion
Sensitivity analysis and model performance
The sensitivity analysis was carried out by changing 17 model parameters, as described in the method section, within the catchment model independently to investigate the effect of these modifications on the model simulation performance. The sensitivity analysis revealed that the model is mainly sensitive to percentage impervious cover and to some degree the parameters related to the impervious cover. There was an expected error in the overestimation of the impervious cover due to including all areas of courtyards as imperviousness. It was found that the best fit between observed and simulated runoff was found with a decrease in impervious cover. It was found that decreasing the impervious cover by 33%, together with increasing the Manning’s roughness for impervious cover by 50% resulted in improvement of model performance (). The increase in Manning’s roughness for impervious areas was supported by visual inspections of the condition of the typical-paved surfaces. It can be seen that the modification of the parameters did not result in large changes of the coefficient of determination R2 ranging between 0.41 and 0.42 (EquationEquation 2(2)
(2) ) for the whole period 2017 and between 0.77 and 0.78 (EquationEquation 2
(2)
(2) ) for the warm period. One can, therefore, conclude that R2 is not the best indicator for the parameter sensitivity evaluation. On the other hand, NSME, which is sensitive to the peak runoff, experienced a larger variation between −0.45 and 0.23 (EquationEquation 3
(3)
(3) ) for the whole period and between −0.64 and 0.48 (EquationEquation 3
(3)
(3) ) for the warm period, indicating unsatisfactory model performance (Dongquan et al. Citation2009; Ritter and Muñoz-Carpena Citation2013). All the performed parameter changes and simulation runs are shown in the Appendix ().
The calibration resulted in a model improvement from the initially assumed parameter set NSME value of −0.04 to a calibrated value of 0.35 for the whole period (the year of calibration 2017) and from 0.03 to 0.70 for the warm period. The initially estimated parameters resulted in a model which performed reasonably well in terms of mean flow error and volume error for the whole period, but with a large error during the warm period. Overall, the mean flow error (EquationEquation 5(5)
(5) ) and volume error (EquationEquation 4
(4)
(4) ) were very close to each other for the long-term continuous periods as well as for the event-based evaluation. The calibrated model was validated against the whole year 2018, the warm period (), and 15 selected periods ( and ).
Assessed using water balance, the model was able to simulate the total inflow and outflow values with a low continuity error −0.045%. The total inflow value, which entered the catchment, equalled 1154 mm, consisting of 8 mm of initial snow cover and 1146 mm of precipitation. The total outflow value equalled 1155 mm and consisted of 31 mm of evaporation loss, 849 mm of infiltration loss 261 mm of surface runoff, and 13 mm of final snow cover. One can see that infiltration loss caused the main conversion of stormwater in the catchment with nearly 74%, followed by surface runoff which was nearly 23%. Information in this paragraph is from the PCSWMM internal status software report (James, Rossman, and James Citation2010), which is based on a water balance between user-defined input and model-defined output values.
Fifteen events (seven events for the warm period and eight for the cold period) were chosen for individual assessment during the calibration period in 2017 in terms of the objective functions specified in chapter Materials and Methods. The intention was to fit the observed and simulated runoff for the long-term continuous period to objective functions. Therefore, there was quite a great variation in terms of mean flow error and volume error. The model calibration resulted in underestimating the total volume by 17% (EquationEquation 4(4)
(4) )) for the whole period (simulated less volume of water than observed). On the other hand, the model calibration resulted in overestimating the total registered volume by 20% (EquationEquation 4
(4)
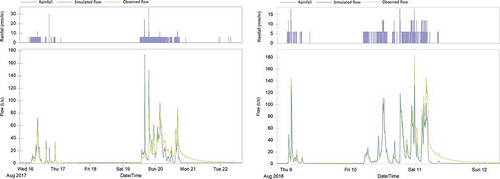
(4) )) during the warm period. The model showed a good performance for the events during the warm period with R2 varying from 0.72 to 0.97 and with NSME varying from 0.42 to 0.83, which means that the model was able to capture peak runoffs reasonably well. The largest event in 2017 (C10) was registered in August (). One can see that the model incorrectly simulated the antecedent dry period resulting in that the initial peak was not simulated well. Even though the initial peak runoff was not captured well, the model simulated the event with acceptable performance in terms of NSME = 0.70, R2 = 0.75, MFE = 14% and VE = 14% . Only one event out of eight (nr. 13) during the cold period with NSME = 0.75 was simulated with acceptable model performance according to the literature (Ritter and Muñoz-Carpena Citation2013). On the other hand, four events out of seven during the warm period were simulated with acceptable model performance and one event (nr. 9) with good model performance according to the literature (Ritter and Muñoz-Carpena Citation2013). The events selected for the validation showed similar characteristics as the events for the calibration when the events in the warm period were simulated with better goodness of fit than the events in the cold period. While the coefficient of determination R2 ranged between 0 and 0.97, the NSME experienced a larger variation between −286 and 0.92. The largest event in 2018 (V8) was also registered in August and the model simulated the event with acceptable performance in terms of NSME = 0.83, R2 = 0.88, MFE = 29% and VE = 29%.
Figure 4. The largest event in 2017; event nr. C10 with R2 = 0.75; NSME = 0.70; MFE = 14%, and VE = 14% and the largest event in 2018; events nr. V8 with R2 = 0.88; NSME = 0.83; MFE = 29%, and VE = 29%
The impact of the green and grey roofs implementation
In addition to the initial model performance assessment, the calibrated model was used for simulation of the catchment runoff while artificially retrofitting all the flat roofs in the catchment (10.7%) with either the green or grey roofs (). It was found that green and grey roofs can equally reduce the maximum flow by 17%. Three exceedance thresholds were chosen to test the frequency, duration, and volume of stormwater runoff from the catchment. The exceedance flows were set at 100, 50, and 25 L/s based on observed flow data analysis. The implementation of either a solution with the green roofs or a solution with the grey roofs showed essential improvements, specifically in terms of peak runoff reduction. This can be observed for the largest exceedance threshold where the reductions were the largest. The impact of the roof’s implementation decreased together with the reduction of the exceedance threshold (from 100 L/s down to 25 L/s). The grey roof implementation outperformed the green roofs in all the aspects: duration, number, and volume of exceedance and even in the long-term continuous simulation which was found to be overestimated (commented in Modelling remarks).
Further, an extra scenario within the green and grey roof implementation was evaluated to changes in the roof area versus impervious cover. The roof area was artificially enlarged to twice the area in each of the sub-catchments, simulating a scenario with urban densification. In this case, it was found that the green roofs were able to reduce the maximum flow by 30% and grey roofs by 35%. Both the green and grey roofs implementation was very effective in reducing volume (green roofs – 78% and grey roof – 98%), which exceeded the threshold equalled 100 L/s. In comparison to the green roof, the grey roof delivered large reductions for all exceedance thresholds.
The impact of the roof implementation was additionally evaluated in each of the individual sub-catchments in order to identify common sub-catchment characteristics that produced the largest runoff reduction, or oppositely, which sub-catchment characteristics cause that the green or grey roofs to have limited or no effect on the sub-catchment. One can see that the model contained 25 sub-catchments, where either the green or grey roofs were tested (). The other 20 sub-catchments were without any roof. The green or grey roof implementation had a positive effect on peak runoff reduction in all the sub-catchments except one where the roof area in that sub-catchment was rather small, less than 0.25%. Concerning mean and median peak runoff reductions in , the roofs caused a decrease in the maximum flow by 15% on average and 16% in the median. The largest peak reduction by 32% in the sub-catchment nr. 6 was in line with the total roofs area, which was 42% of the total sub-catchment area. Overall it was found that the retrofitted roofs reduced peak flow by more than 20% for the sub-catchment comprised of at least 33% of the roof area on average (potential area for retrofitting) with an average slope of 8%. On the other end, the retrofitted roofs reduced the peak flow by less than 10% in subcatchments with a relatively small roof area, 8% on average, and with a larger slopeof 15%.
Table 7. Impact of the roof implementation on each of the sub-catchment where flat roofs are present. Abbreviations: Subcatch.nr. – sub-catchment number, Imperv – imperviousness; Highlighting: bold – peak reduction larger and equal 20%, italics + underlined – peak reduction lower and equal 10%
Practical implication and limitations
The paper presents a method to examine an urbanized area using modelling tools and identify potential areas for retrofitting. It provides an important contribution towards utilizing retrofitted rooftops for the detention of stormwater at the place where it is generated. This can be a valuable tool for urban planners when deciding whether to keep rooftops impervious or focus on green and/or grey roof retrofitting strategies. Still, it should be kept in mind that the rooftop retrofitting alone helps to reduce urban runoff and therefore rooftops runoff should be additionally treated by disconnecting and redirecting in other decentralized drainage systems like bioretention cells or raingardens (Davis et al. Citation2009; Gleick Citation2014; Jarden, Jefferson, and Grieser Citation2016). The overall performance is however also dependent on other situations, e.g. summer/winter conditions (Li and Babcock Citation2014; Johannessen, Hanslin, and Muthanna Citation2017), initial saturation (Alfredo, Montalto, and Goldstein Citation2009; Berretta, Poë, and Stovin Citation2014), roof size, media and slope (Vanwoert et al. Citation2005; Getter, Rowe, and Andresen Citation2007; Hakimdavar et al. Citation2014). Last but not least, deep percolation within a catchment with native soils formed from fjord or marine deposits is limited. Therefore, the use of rooftops retrofitting can be a favourable stormwater solution rather than infiltration-based measures. It should be noted that the potential to be retrofitted is considered from the construction point of view with flat roofs (‘low-slope’ roofs). The privacy or load conditions were not considered.
Modelling remarks
Errors in runoff simulation – after several rainfalls, the observed base flow lasted for more extended periods. This was, however, not the case for the simulated runoff, which disappeared sooner after the rain stopped. The model cannot accurately model all the periods of the year and all the events due to parameter uncertainty, uncertainty in model structure, uncertainty in flow redistribution between individual sub-catchments and subareas, and uneven precipitation distribution over the catchment (especially during extreme events).
Volume errors – water redistribution between sub-catchments and subareas may differ from season to season and from event to event. This may also apply to pipe infiltration, which presumably changes from season to season. Consequently, it is questionable to use a constant value for baseline flow during the whole period as this value is expected to fluctuate according to, e.g. groundwater level. Applying different values for baseline inflow for the cold and warm periods would most likely result in the improvement of the model performance in terms of mean flow error and volume error.
The water balance was checked within the model with and without implemented roofs. It was found that the model accounted for evaporation loss of 2.7% for set-up without roof implementation. Whereas evaporation loss with green roof implementation was 5.4% and grey roof implementation was even higher 5.8%. This shows that the LID Green roof module does not simulate the evaporation loss from the roof with and without vegetation well (the evaporation loss for the grey roof was overestimated).
It was noticed that the input data (primarily precipitation and flow data) contained unexpectable events, e.g. due to calibration of the rain gauge or maintenance of the drainage network with the use of a flushing device (regular pipe cleaning by the municipality). It admits additional uncertainty to the simulated results.
The implementation of retrofitted rooftops upstream and downstream revealed the importance of time of concentration for particular sections within the entire catchment (, ). This means that the roof implementation may change the time to travel to the catchment outlet less favourably concerning peak runoffs. For catchments with multiple subareas, the time of concentration must be considered individually, thus, the in-situ investigation ought to be needed.
Weather observations play an important role in the quality of model outputs. This applies to the quality of the observed data with respect to temporal and spatial resolution. In this sense, temperature measurements were collected at the catchment outlet at 85 meters above sea level and are representative of the whole catchment, which is located between 85 and 134 m above sea level. However, in the region as Trondheim, precipitation often falls as rain, snow, sleet, or hail during a single event, and an increase or decrease in elevation may decide about the type of precipitation. In this case, temperature, which is in the model used to differentiate between solid and liquid precipitation, decides about the quality of the simulated data.
Conclusion
In this study, a PCSWMM-based model of the Risvollan urban catchment was built to investigate the performance of rooftop stormwater management solutions for runoff reduction on a catchment level. The results of long-term continuous runoff simulations at the catchment outlet before and after green and grey roofs implementation are described and discussed. The study presents a method to examine an urbanized area remotely and investigate the green and grey roof contribution towards runoff reduction at the catchment outlet.
The model results showed a good performance level for the largest events in 2017 and 2018 and events during the warm season (April through October) with R2 varying from 0.72 to 0.97 and with NSME varying from 0.42 to 0.83. The flow simulation during the cold period was acceptable only for one event while the rest of the events had unsatisfactory model performance according to NSME. The sensitivity analysis revealed that the impervious area and Manning’s roughness coefficient for the impervious areas were the most important parameters for the model output. The analysis also showed that the model was nearly insensitive to the parameters related to pervious cover and infiltration.
As little as 11% of roof surface can essentially reduce maximum flows running out of an urban area. Concerning the exceedance thresholds, the grey roofs implementation outperformed the green roofs in all the aspects: duration, number, and volume of exceedance. It was found that the rooftops retrofitting provided the largest reduction for flows exceeding 100 L/s, whereas the reduction was less for flows exceeding 25 L/s in all the scenarios.
The performance, in terms of reduction of peak flows, increases in line with the implementation area for the green and/or grey roofs. Additionally, the performance increases with a decrease in the catchment slope. Further, the results showed that even a relatively small area of roofs retrofitted with green or grey roofs can make considerable differences in runoff reduction on the catchment level. These results indicated that PCSWMM type modelling tools can be a useful planning tool for urban planners and decision-makers making implementation plans and strategies for stormwater management.
Acknowledgements
The authors would like to acknowledge the municipality of Trondheim for providing data of the drainage network, Norwegian Water resources and Energy directorate (NVE) for providing flow data and Birgitte Gisvold Johannessen, Rannveig Høseggen, Endre Våland Bø and Teklu Tesfaye Hailegeorgis for information related to the drainage network and the gauging station at the Risvollan catchment.
Disclosure statement
No potential conflict of interest was reported by the author(s).
Additional information
Funding
Notes
1. The potential to be retrofitted is considered from the construction point of view with flat roofs (with mild slope). The privacy or load conditions were not considered.
References
- Adams, B. J. 2000. Urban Stormwater Management Planning with Analytical Probabilistic Models. USA: N. p.
- Alfredo, K., F. Montalto, and A. Goldstein. 2009. “Observed and Modeled Performances of Prototype Green Roof Test Plots Subjected to Simulated Low-and High-intensity Precipitations in a Laboratory Experiment.” Journal of Hydrologic Engineering 15 (6): 444–457. doi:10.1061/(ASCE)HE.1943-5584.0000135.
- Becker, M. A. 2016. Assessment of Downspout Disconnection by Modeling Infiltration Potential in Urban Areas. Trondheim, Norway: NTNU.
- Berretta, C., S. Poë, and V. Stovin. 2014. “Moisture Content Behaviour in Extensive Green Roofs during Dry Periods: The Influence of Vegetation and Substrate Characteristics.” Journal of Hydrology 511: 374–386. doi:10.1016/j.jhydrol.2014.01.036.
- Butler, D., C. J. Digman, C. Makropoulos, and J. W. Davies. 2018. Urban Drainage. Abingdon, United Kingdom: CRC Press.
- Chocat, B., R. Ashley, J. Marsalek, M. Matos, W. Rauch, W. Schilling, and B. Urbonas. 2007. “Toward the Sustainable Management of Urban Storm-water.” Indoor and Built Environment 16 (3): 273–285. doi:10.1177/1420326X07078854.
- Davis, A. P., W. F. Hunt, R. G. Traver, and M. Clar. 2009. “Bioretention Technology: Overview of Current Practice and Future Needs.” Journal of Environmental Engineering 135 (3): 109–117. doi:10.1061/(ASCE)0733-9372(2009)135:3(109).
- Dongquan, Z., C. Jining, W. Haozheng, T. Qingyuan, C. Shangbing, and S. Zheng. 2009. “Gis-based Urban Rainfall-runoff Modeling Using an Automatic Catchment-discretization Approach: A Case Study in Macau.” Environmental Earth Sciences 59 (2): 465.
- Dunnett, N., and N. Kingsbury. 2008. Planting Green Roofs and Living Walls. Portland, USA: Timber press Portland, OR.
- Elliott, A., and S. A. Trowsdale. 2007. “A Review of Models for Low Impact Urban Stormwater Drainage.” Environmental Modelling & Software 22 (3): 394–405. doi:10.1016/j.envsoft.2005.12.005.
- Fletcher, T. D., W. Shuster, W. F. Hunt, R. Ashley, D. Butler, S. Arthur, S. Trowsdale, S. Barraud, A. Semadeni-Davies, and J.-L. Bertrand-Krajewski. 2015. “Suds, Lid, Bmps, Wsud and More–the Evolution and Application of Terminology Surrounding Urban Drainage.” Urban Water Journal 12 (7): 525–542.
- Getter, K. L., D. B. Rowe, and J. A. Andresen. 2007. “Quantifying the Effect of Slope on Extensive Green Roof Stormwater Retention.” Ecological Engineering 31 (4): 225–231. doi:10.1016/j.ecoleng.2007.06.004.
- Gleick, P. H. 2014. “ The world’s water: The biennial report on freshwater resources volume 8.”
- Goel, P. 2006. Water Pollution: Causes, Effects and Control. Delhi, India: New Age International.
- Haase, D. 2009. “Effects of Urbanisation on the Water Balance–a Long-term Trajectory.” Environmental Impact Assessment Review 29 (4): 211–219. doi:10.1016/j.eiar.2009.01.002.
- Hailegeorgis, T. T., and K. Alfredsen. 2018. “High Spatial–temporal Resolution and Integrated Surface and Subsurface Precipitation-runoff Modelling for a Small Stormwater Catchment.” Journal of Hydrology 557: 613–630. doi:10.1016/j.jhydrol.2017.12.054.
- Hakimdavar, R., P. J. Culligan, M. Finazzi, S. Barontini, and R. Ranzi. 2014. “Scale Dynamics of Extensive Green Roofs: Quantifying the Effect of Drainage Area and Rainfall Characteristics on Observed and Modeled Green Roof Hydrologic Performance.” Ecological Engineering 73: 494–508. doi:10.1016/j.ecoleng.2014.09.080.
- Hamouz, V., J. Lohne, J. R. Wood, and T. M. Muthanna. 2018. “Hydrological Performance of Leca-based Roofs in Cold Climates.” Water 10 (3): 263. doi:10.3390/w10030263.
- Hamouz, V., and T. M. Muthanna. 2019. “Hydrological Modelling of Green and Grey Roofs in Cold Climate with the Swmm Model.” Journal of Environmental Management 249: 109350.
- House‐Peters, L. A., and H. Chang. 2011. “Urban Water Demand Modeling: Review of Concepts, Methods, and Organizing Principles.” Water Resources Research 47 (5): 5. doi:10.1029/2010WR009624.
- James, W., L. A. Rossman, and W. R. C. James. 2010. User’s Guide to Swmm 5: Based on Original Usepa Swmm Documentationed. Ontario, Canada: CHI.
- Jarden, K. M., A. J. Jefferson, and J. M. Grieser. 2016. “Assessing the Effects of Catchment‐scale Urban Green Infrastructure Retrofits on Hydrograph Characteristics.” Hydrological Processes 30 (10): 1536–1550. doi:10.1002/hyp.10736.
- Jha, A. K., R. Bloch, and J. Lamond. 2012. Cities and Flooding: A Guide to Integrated Urban Flood Risk Management for the 21st Century. Washington, DC: World Bank.
- Johannessen, B., T. Muthanna, and B. Braskerud. 2018. “Detention and Retention Behavior of Four Extensive Green Roofs in Three Nordic Climate Zones.” Water 10 (6): 671. doi:10.3390/w10060671.
- Johannessen, B. G., V. Hamouz, A. S. Gragne, and T. M. Muthanna. 2019. “The Transferability of Swmm Model Parameters between Green Roofs with Similar Build-up.” Journal of Hydrology 569: 816–828.
- Johannessen, B. G., H. M. Hanslin, and T. M. Muthanna. 2017. “Green Roof Performance Potential in Cold and Wet Regions.” Ecological Engineering 106: 436–447. doi:10.1016/j.ecoleng.2017.06.011.
- Khader, O., and F. A. Montalto. 2009. “Development and Calibration of a High Resolution Swmm Model for Simulating the Effects of Lid Retrofits on the Outflow Hydrograph of a Dense Urban Watershed.” Low Impact Development for Urban Ecosystem and Habitat Protection 1–9. doi:10.1061/41009(333)58.
- Krebs, G., T. Kokkonen, M. Valtanen, H. Koivusalo, and H. Setälä. 2013. “A High Resolution Application of A Stormwater Management Model (Swmm) Using Genetic Parameter Optimization.” Urban Water Journal 10 (6): 394–410. doi:10.1080/1573062X.2012.739631.
- Li, Y., and R. W. Babcock. 2014. “Green Roof Hydrologic Performance and Modeling: A Review.” Water Science and Technology 69 (4): 727–738. doi:10.2166/wst.2013.770.
- Lindholm, O. G., S. Endresen, S. T. Thorolfsson, S. Sægrov, G. Jakobsen, and L. Aaby. 2008. “Veiledning I Klimatilpasset Overvannshåndtering.” Rapport 162: 2008.
- Liong, S., W. Chan, and L. Lum. 1991. “Knowledge-based System for Swmm Runoff Component Calibration.” Journal of Water Resources Planning and Management 117 (5): 507–524. doi:10.1061/(ASCE)0733-9496(1991)117:5(507).
- Marsalek, J., and B. Chocat. 2002. “International Report: Stormwater Management.” Water Science and Technology 46 (6–7): 1–17. doi:10.2166/wst.2002.0657.
- Matheussen, B. V. 2004. “Effects of anthropogenic activities on snow distribution, and melt in an urban environment.”
- Mitchell, V. G., R. G. Mein, and T. A. Mcmahon. 2001. “Modelling the Urban Water Cycle.” Environmental Modelling & Software 16 (7): 615–629. doi:10.1016/S1364-8152(01)00029-9.
- Moriasi, D. N., J. G. Arnold, M. W. Van Liew, R. L. Bingner, R. D. Harmel, and T. L. Veith. 2007. “Model Evaluation Guidelines for Systematic Quantification of Accuracy in Watershed Simulations.” Transactions of the ASABE 50 (3): 885–900. doi:10.13031/2013.23153.
- Nash, J. E., and J. V. Sutcliffe. 1970. “River Flow Forecasting through Conceptual Models Part I—a Discussion of Principles.” Journal of Hydrology 10 (3): 282–290. doi:10.1016/0022-1694(70)90255-6.
- Novotny, V. 2002. Water Quality: Diffuse Pollution and Watershed Management. Hoboken, New Jersey: John Wiley & Sons.
- Postel, S., and B. Richter. 2012. Rivers for Life: Managing Water for People and Nature. Washington, DC: Island Press.
- Ritter, A., and R. Muñoz-Carpena. 2013. “Performance Evaluation of Hydrological Models: Statistical Significance for Reducing Subjectivity in Goodness-of-fit Assessments.” Journal of Hydrology 480: 33–45.
- Rossman, L. 2015. Swmm 5.1 Storm Water Management Model User’s Manual. Cincinnati, OH: US Environmental Protection Agency.
- Semadeni-Davies, A., C. Hernebring, G. Svensson, and L.-G. Gustafsson. 2008. “The Impacts of Climate Change and Urbanisation on Drainage in Helsingborg, Sweden: Combined Sewer System.” Journal of Hydrology 350 (1): 100–113. doi:10.1016/j.jhydrol.2007.05.028.
- Shuster, W. D., J. Bonta, H. Thurston, E. Warnemuende, and D. Smith. 2005. “Impacts of Impervious Surface on Watershed Hydrology: A Review.” Urban Water Journal 2 (4): 263–275. doi:10.1080/15730620500386529.
- Stovin, V., S. Poë, and C. Berretta. 2013. “A Modelling Study of Long Term Green Roof Retention Performance.” Journal of Environmental Management 131: 206–215. doi:10.1016/j.jenvman.2013.09.026.
- Stovin, V., S. Poë, S. De-Ville, and C. Berretta. 2015. “The Influence of Substrate and Vegetation Configuration on Green Roof Hydrological Performance.” Ecological Engineering 85: 159–172. doi:10.1016/j.ecoleng.2015.09.076.
- Stovin, V., G. Vesuviano, and S. De-Ville. 2017. “Defining Green Roof Detention Performance.” Urban Water Journal 14 (6): 574–588. doi:10.1080/1573062X.2015.1049279.
- Vanwoert, N. D., D. B. Rowe, J. A. Andresen, C. L. Rugh, R. T. Fernandez, and L. Xiao. 2005. “Green Roof Stormwater Retention.” Journal of Environmental Quality 34 (3): 1036–1044. doi:10.2134/jeq2004.0364.
- Voyde, E., E. Fassman, R. Simcock, and J. Wells. 2010. “Quantifying Evapotranspiration Rates for New Zealand Green Roofs.” Journal of Hydrologic Engineering 15 (6): 395–403. doi:10.1061/(ASCE)HE.1943-5584.0000141.
- Zhou, Q. 2014. “A Review of Sustainable Urban Drainage Systems considering the Climate Change and Urbanization Impacts.” Water 6 (4): 976–992. doi:10.3390/w6040976.
Appendix
Figure A1. Climate data in 2017, maximum and minimum daily temperature, and wind speed records
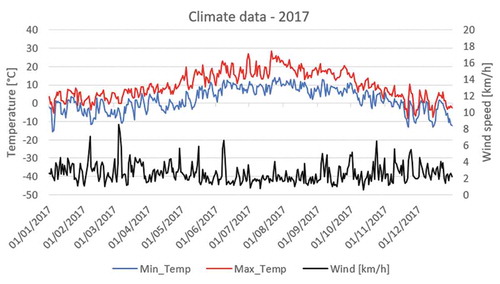
Figure A2. Climate data in 2018, maximum and minimum daily temperature, and wind speed records
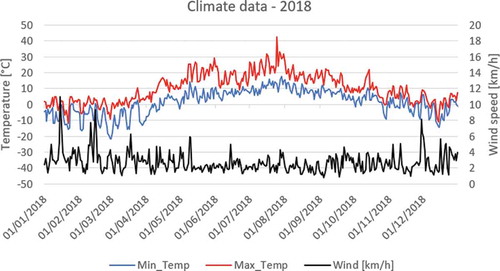
Table A1. Sensitivity analysis of 17 parameters for the whole period andwarm period with individual parameter adjustment by ±10% and ±50%
Table A2. Impact of the green and grey roofs downstream implementation for different exceedance thresholds 100, 50, and 25 L/s with respect to the evaluation criteria. Scenario A, F and G from Table 2
Table A3. Impact of the green and grey roofs upstream implementation for different exceedance thresholds 100, 50, and 25 L/s with respect to the evaluation criteria. Scenario A, H and I from Table 2