
 ?Mathematical formulae have been encoded as MathML and are displayed in this HTML version using MathJax in order to improve their display. Uncheck the box to turn MathJax off. This feature requires Javascript. Click on a formula to zoom.
ABSTRACT
This paper presents a case study demonstrating the process used to develop an overland flow model of radionuclide transport following an aerosol deposition from a hypothetical radiological dispersal device explosion. The process included the integration of digital elevation, building, and land cover information with hydrologic information from a calibrated Stormwater Management Model (SWMM) model. The overland flow model was used to explore the impact of washoff parameter selection and different storm events on radionuclide transport in surface flow. The range of washoff parameters used in the literature resulted in over a 7 times difference in radionuclide washoff, from a small surface removal to nearly full removal. The overland flow model illuminated the primary pathways of contaminant transport, a potentially useful tool that informs emergency response, planning, and remediation activities.
1. Introduction
Radionuclides have been widely dispersed in the environment following nuclear weapons testing and reactor accidents, and Cesium-137 (137Cs) is a particularly persistent contaminant, with a half-life of approximately 30 years. 137Cs poses a risk to human health as a high-energy gamma emitter, and it can quickly spread throughout surface and subsurface environments (Cornell Citation1993; Evrard et al. Citation2015). Of recent concern has also been the potential detonation of radiological dispersal devices, or ‘dirty bombs’, and improvised nuclear devices (CitationU.S. Department of Health and Human Services), which could contaminate a wide urban area with 137Cs. Because environmental cleanup efforts can take months to years, precipitation would likely mobilize 137Cs and transport it beyond its initial fallout deposition. Accordingly, modeling tools are useful for predicting the spread of contamination in the environment following a widespread contamination incident, whether it be accidental or manmade.
The Homeland Security Research Program (HSRP) at the United States (US) Environmental Protection Agency (EPA) conducted a comprehensive review of different contaminant fate and transport models that could be used following a wide-area urban-release event to inform contamination mapping, characterization, and site clearance (Chen et al. Citation2018). Due to its widespread use and open-source engine code, the EPA’s Stormwater Management Model [SWMM; Rossman (Citation2015)] was selected for use and expansion of emergency response and remediation capabilities. SWMM is widely used throughout the world to simulate both single event and long-term stormwater runoff quantity and quality. Its pollutant transport capabilities, including washoff, are suitable for modeling non-traditional contaminants, including radionuclides. EPA’s HSRP is actively conducting research to improve fate and transport-related modeling capabilities and contaminant parameterizations through laboratory and field studies.
The objective of this case study is to establish a process for developing and adapting a stormwater model that can be used to assist in emergency response and recovery functions. The purpose of this type of model is to support decision-making for remediation actions, such as sampling, waste staging, and installation of treatment technologies (Lemieux, Boe, and Hayes Citation2020). We use a hypothetical dirty bomb detonation in downtown Detroit, Michigan, which uses SWMM to model its stormwater conveyance network, to present the process of building a model capable of simulating radionuclide transport pathways in stormwater runoff and the relative radionuclide surface concentration remaining after rain events. We also discuss the unique aspects of modeling non-traditional pollution, such as selecting and testing various washoff parameters, and explore the effects of different types of storm events on 137Cs transport.
2. Materials and methods
2.1. Case study area
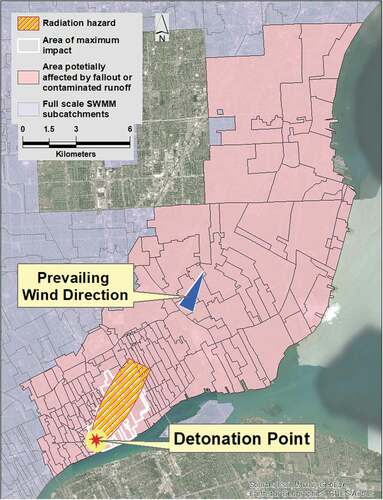
Southeast Michigan has one of the largest water and wastewater utilities in the US, and it is maintained and operated by the Great Lakes Water Authority (GLWA) in collaboration with the City of Detroit’s Water and Sewage Department (DWDS). In 2019, approximately 2.9 million people used the GLWA wastewater services, and 298 kilometers of sewer pipes are operated and maintained in the sewershed (Great Lakes Water Authority Citation2019). Like many older collection systems in large cities located along rivers in the US, Detroit’s stormwater infrastructure features a combined sewer overflow system (CSO). Given its diverse urban environment and infrastructure and the fact that GLWA has used SWMM to model the Greater Detroit Regional Sewer System (GDRSS), Detroit was selected as the location for this case study. A downtown location was selected for the hypothetical detonation point based on the density of likely targets with high potential for disruption of commercial and civil activities and operations ().
Figure 1. Detonation point and stormwater subcatchments potentially affected by air dispersion of radiological contamination (orange dashed area represents the area of highest radiation hazard in hypothetical scenario).
2.2. SWMM model development
This case study expands on existing components from a 2013 GRDSS SWMM model to enable modeling radionuclide transport in overland flow at finer spatial scales in an area most impacted by the hypothetical 137Cs deposition. In support of this case study, the Interagency Modeling and Atmospheric Assessment Center (IMAAC) modelled 137Cs fallout. While the modelled deposition plume is not available for public release, its extent was used to determine the areas of the GDRSS model that warranted greater detail for modeling 137Cs washoff and transport (). Several publicly available data sources were used in addition to the GRDSS SWMM model to develop a more refined model for part of the case study focus area (). The model building process is summarized in and further described in the following sections.
Table 1. Data sources used in developing the case study SWMM model
Figure 2. Contents and steps in overland flow model preparation and execution.
2.2.1. LIDAR/DEM
A digital elevation model (DEM) for the case study area was developed using publicly available LiDAR data from the US Geological Survey and the LiDAR Dataset geospatial analysis tools in ArcMap (v10.6). Raster grid files obtained from public repositories were aggregated and processed to produce a bare earth DEM by filtering for ground surface returns only. The separate DEMs were mosaiced and reconditioned using the ArcHydro fill sinks tool (U.S. Army Corps of Engineers Citation2003; Esri Citation2017).
2.2.2. Buildings
Buildings represent both obstructions to overland flow and their roofs impervious areas that rapidly shed precipitation and direct it to curb gutters or pervious areas. Therefore, we include these roof structures as a special type of subcatchment in developing the overland flow model in SWMM. Building footprint files were obtained from the South East Michigan Council of Governments (SEMCOG) GIS data warehouse (). The study area contains many buildings, some of which are smaller than the intended overland flow model resolution. These buildings typically represent sheds and storage facilities and have little impact on direct discharge to the sewer system; instead, they primarily contribute runoff to the pervious and impervious areas on which they are located. Removing buildings smaller than 18.6 m2 decreases the computational burden, both in generating the model and in running it, while maintaining the desired resolution for the overland flow model. See Supplemental Material Text S1 and Figure S1 for a more detailed description of evaluating building size relative to subcatchment size.
2.2.3. Landcover
Data from the United States National Landcover Database (NLCD) were used to update the percent impervious property of the SWMM model subcatchments (Homer et al. Citation2015). The model was developed using the 2011 NLCD data (). To estimate the mean value of the percent impervious for the SWMM subcatchments, the percent impervious NLCD raster was converted to a polygon layer using geoprocessing tools in ArcMap (v10.6). The resulting layer was then imported into PCSWMM, and the area weighting tool was used to calculate and populate the impervious property of the model’s subcatchments.
2.2.4. Overland flow model
PCSWMM 2D (v7, pcswmm.com) includes a module for developing 2D cells, junctions, and conduits for modeling overland flow in a quasi-2D mode by discretizing the model domain with a hexagonal or rectangular mesh based on a model boundary layer, an obstruction layer, and a DEM. These cells, junctions, and conduits are generated based on a network of nodes created using a 2D boundary layer, which enforces node spacing and cell geometry. The 2D cells generated in PCSWMM can then be converted into SWMM subcatchments for hydrologic modeling. This 2D modeling is intended for use with cells that have a very small surface area (~0.1 m2). Since our model domain is significantly larger than the typical PCSWMM 2D domain, developing 2D cells at this resolution is not feasible, and therefore our model does not adhere to the assumptions made for modeling overland flow in quasi-2D. We do, however, use the PCSWMM 2D mesh generation tools to develop finer-resolution subcatchments and hydraulic network that solves the 1D depth-averaged momentum and continuity equations for simulating overland flow via a network of junctions and open conduits. Open-source tools are also available for automating the process of generating finer-scale subcatchments that allow for more detailed flow routing (Warsta et al. Citation2017; Niemi et al. Citation2019).
Developing an overland flow model for the entire GDRSS is not practical given the computational resources available at the time of model development, nor is it necessary to model overland flow at a fine scale in areas that received little or no hypothetical radiological contamination to achieve the aims of this study. The fallout plume was used to determine which subcatchments were contaminated above a threshold that poses a more significant radiation hazard, representing the area of maximum impact (), and subcatchments expected to receive contaminated washoff from these radiation hazard areas were also included. Within this down-selected area, we utilized a nested model resolution strategy to balance tradeoffs between model detail and computation time. Closest to the detonation area, where contamination levels are highest, the finer scale grid resolution (12 m) was used in generating the overland flow model. A coarser cell resolution was utilized in areas affected by fallout but lower activity levels, with cell sizes ranging from 24 to 48.8 m. Hexagonal cells were used in generating the model mesh, except for along roads, which were modelled discretely as rectangular geometry using road centreline data from SEMCOG () at a resolution of 12 m. Emergency response activities may focus on roadways separately from other areas, so it was important to build in this flexibility during the mesh generation and to match the shape of the mesh/sub catchments to the type of questions being asked of the model. Building footprints were used as obstructions in generating the overland flow mesh (except those smaller than 18.6 m2, see section 2.2.2) and incorporated in the SWMM model as separate subcatchments (). The outlets of the building subcatchments were automatically assigned to junctions using PCSWMM’s set outlet tool. Subcatchments were assigned their respective land use (road, building, or urban) and their properties were populated using spatial datasets and the pre-existing GDRSS model information (). The average area (in hectares) for the subcatchments used in the model was 0.03 (σ = 0.04) for mesh areas, 0.01 (σ = 0.004) for roads, 0.08 (σ = 0.23) for buildings and 117 (σ = 237) for the original subcatchments in the area of the model with coarser resolution.
Figure 3. Subarea of the model domain containing finer resolution overland flow mesh. Subcatchment, building, and road layers were used to construct the model.
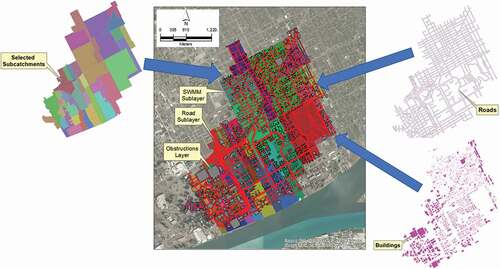
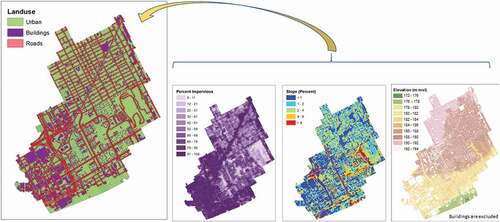
Figure 4. Input data for converting 2D cells to subcatchments included land use type, percentage impervious, slope, and elevation information for the model domain.
2.3. Modeling cesium washoff
In this study, we focus on modeling the fallout and washoff of 137Cs, a likely constituent of ‘dirty bombs’ (CitationU.S. Department of Health and Human Services), which is persistent in the environment (t1/2 = 30 years) and has posed challenges for environmental remediation (Lee Citation2015). Research has been conducted on the environmental mobility of 137Cs following radionuclide releases in the environment, primarily focused on rural and agricultural settings following the Chernobyl and Fukushima Daichi (FDI) reactor accidents. Investigations following these release events have found that particulates from the reactor fuel matrix that were heavily contaminated with 137Cs were deposited in the soils close to the accident site. In these settings, studies have documented a slow release of 137Cs due to the weathering of fuel and soil erosion (Khanbilvardi et al. Citation1999; Smith, Clarke, and Saxén Citation2000; Anspaugh Citation2008; Ueda et al. Citation2013). Farther from the release site, 137Cs fallout was predominantly in its mobile form (Konoplev Citation2016). In this form, 137Cs readily sorbs to clays in soil (Beasley and Jennings Citation1984; Dominik, Burrus, and Vernet Citation1987; Ratliff, Mikelonis, and Duffy Citation2020). Because clays often constitute a significant component of the total suspended solid (TSS) load in runoff, a conceptual model of cesium transport can be developed based on washoff models that have been developed for TSS. Since the release scenario for this case study assumes that 137Cs would be deposited in its mobile form that would rapidly sorb into clays in soil, we choose to model 137Cs transport as a fraction of TSS washoff.
Initially introduced by Sartor and Boyd (Citation1972) and implemented in SWMM, an exponential relationship is most frequently used for modeling constituent washoff:
where W(t) = the cumulative washoff mass at time t, mB(0) = the initial mass of the constituent on the surface at time = 0, and k is a coefficient that relates the runoff rate:
where KW is a washoff coefficient, q is the runoff rate over the subcatchment, and NW is a washoff exponent (U. S. Envrionmental Protection Agency Citation2016). Generic values for these empirically derived coefficients and exponential terms for modeling pollutant loads are available in the EPA SWMM Reference Manuals (U. S. Envrionmental Protection Agency Citation2016), although these parameters can be highly variable and controlled by localized factors, including landscape topography and land use (Di Modugno et al. Citation2015; Maharjan, Pachel, and Loigu Citation2017; Muthusamy et al. Citation2018).
The washoff parameter values we used in this case study were informed by published values from studies of TSS washoff featuring similar land use types (Temprano et al. Citation2006; Hood, Reihan, and Loigu Citation2007; Maharjan, Pachel, and Loigu Citation2017). The range of values reported in these studies, along with site-specific knowledge of our study area and a simple assessment with a cumulative loss model, guided washoff coefficient and exponent selection for this case study (). Buildings are generally rapidly flushing and are modelled using terms closer to the higher end of calculated parameter values. The case study model’s urban land use type features a mix of high-density developed areas and more open areas, and we chose to model this land use type using the minimum of the relevant values reported in Maharjan, Pachel, and Loigu (Citation2017). Parameter values for the road land use type, which features a variety of surfaces including concrete, asphalt, and brick, were derived by computing the geometric mean of the urban and building values. See Supplemental Material Section S3 (Washoff Parameter Analysis) for a more detailed description of the cumulative loss model that guided washoff parameter value selection.
Table 2. Washoff coefficients and exponents used in the case study model representing the statistical summary of the relevant values from Maharjan, Pachel, and Loigu (Citation2017) (used in the maximum/minimum parameter value comparison) and the values assigned to each land use type
2.4. Meteorological analysis and simulated storms
Precipitation data from the Detroit Metropolitan Airport available through the National Oceanic and Atmospheric Administration (NOAA) are the most robust and complete publicly available precipitation dataset for the case study location, containing hourly and sub-hourly observations, daily summary data, and short-duration precipitation summaries (). Using the Local Climatological Dataset tool (https://www.ncdc.noaa.gov/cdo-web/datatools/lcd), we obtained data for the years 1981–2017 and conducted a storm frequency analysis to establish the return frequency of storm intensities for both 1-hour and 24-hour peak rainfall events. For a 2-year return period, the estimated total precipitation is 26.7 mm for a 1-hour event and 48 mm for a 24-hour event. Wind data were also analysed to determine a prevailing wind direction from the southwest with sustained winds 24–48 km per hour (Figure S2). See Supplemental Material S2 for a more detailed description of the meteorological data analysis. This analysis guided the selection of the atmospheric conditions that were used in selecting precipitation events for the washoff parameter sensitivity study.
Within the case study model, a single SWMM rain gauge was used in all model simulations, and two different 2-year return frequency storms were modelled: 1) a 24-hour design storm and 2) a real storm that included the calculated peak 1-hour rainfall total. We selected a Midwest and Southeast (MSE) Type III storm (59.7 mm total rainfall) as the 24-hour design storm relevant to this climatic zone (Michigan Department of Transportation Citation2006). The actual storm data were obtained from a storm that occurred on 27 July 2014. For modeling purposes, we simulated a 24-hour antecedent dry period and 3 days of post-rainfall dry weather to track the movement of water and contaminants through the system.
3. Results and discussion
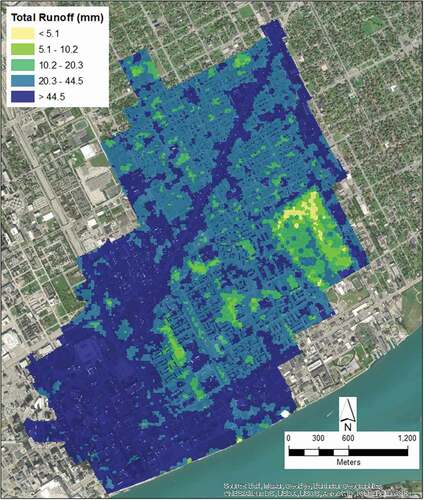
Both the design storm and the 27 July 2014 storm produced acceptable continuity errors in the Detroit overland flow case study model. The design storm produced continuity errors of -1.1% and 1.7% for runoff and routing, respectively, and the 27 July storm resulted in errors of -3.3% and -0.3% for runoff and routing, which is consistent with general practice of simulation acceptability when continuity errors are less than ± 10% (Rossman Citation2015). The design storm featured a 140% increase in the total rainfall amount than the 27 July storm, which resulted in maximum allowed simulated runoff depths at 16 nodes between 20 and 24 hours after the start of the simulated storm. Most of the runoff was generated from highly urbanized areas that feature a greater fraction of impervious cover (), along major roadways, and in the low relief areas along the river front (). The overland flow case study model was not calibrated. When geographical and land use information are integrated into uncalibrated models, as done for the case study model, their performance greatly improves, sometimes to levels comparable to calibrated models that do not contain this information (Petrucci and Bonhomme Citation2014).
Figure 5. Total runoff generated during the 2-year 24-hour MSE Type III storm (total precipitation = 58.7 mm). The subterranean conduit system was not factored into this analysis.
Two different washoff comparison studies were conducted to evaluate the impact of 1) varying washoff parameters and 2) the effect of different precipitation events using the Detroit case study model.
3.1. Washoff parameter effects
We used the precipitation data from the 27 July 2014 storm (2-year return frequency for 1-hour peak intensity, total precipitation 24.9 mm) to evaluate the impact of a wide range of TSS washoff parameter values reported by Maharjan, Pachel, and Loigu (Citation2017) on contaminant washoff processes. The maximum and minimum values for the relevant land use types from that study () were each uniformly applied to all subcatchments over the entire case study model domain to investigate how significantly this range of parameter values impacts 137Cs washoff during one particular storm. Uniform application helps to avoid known issues of model over parameterization (Petrucci and Bonhomme Citation2014). Results from these two simulations are reported in .
Table 3. Simulation mass balance summary for the washoff studies using the Detroit case study model and the precipitation data from the 27 July 2014 storm
For the minimum values of the washoff parameters, only 12% of the 137Cs contamination was entrained in runoff by washoff processes, with 88% of the initial contamination remaining on subcatchment surfaces after the storm. Conversely, for the maximum washoff parameter values tested, 88% of the 137Cs was washed off. When specific parameter values are assigned for each land use type (buildings, roads, urban; see ), approximately half (55%) of the 137Cs washes off during a moderately heavy, short-duration storm. Washoff parameter values are typically obtained from small-scale experiments and then transposed to larger-scale applications. Researchers have found that once scaled-up, the parameters lose their physical meaning (Bonhomme and Petrucci Citation2017). This case study includes finer-scale subcatchment sizes that are closer in scale to the experiments performed to generate washoff coefficients than other models. This facilitates scenarios where changes in land use may be related to changes in model parameters. It has also been shown that due to the initial erosion of pollutants during the first flush of a rainfall event, spatially distributed deposits of contamination have little effect at the scale of a large subcatchment outlet (Hong et al. Citation2017). The finer resolution subcatchments also facilitate improved modeling of this scenario.
The wide range of 137Cs washoff over the parameter values tested resulted in large differences between the amounts of contaminant mobilized, from a small fraction washed off to nearly full removal, which highlights the importance of these washoff coefficient and exponent values in modeling contaminant transport processes. Since 137Cs readily sorbs to clay and fine particles in soil, we approximate 137Cs by using washoff parameters for TSS, because more data from urban areas are available to inform TSS washoff parameterization. Modeling of 137Cs transport in urban areas would be improved with controlled laboratory studies or field studies using safe tracer materials (e.g. 133Cs sorbed into solids, the only stable isotope of cesium) in areas with surfaces characteristic of large cities (e.g. concrete and asphalt).
3.2. Storm impacts
We also compared the differences between the actual 27 July 2014 storm with a 2-year peak intensity to the 2-year 24-hour MSE Type III design storm using the case of specific washoff parameter values assigned to each land use type. compare both the amount of 137Cs washed off and the maximum overland flow activity levels as a result of the two different precipitation events. Given that buildings have been assigned higher washoff parameter values, they are flushed rapidly and contribute the majority of the initial contaminant load for both precipitation events (). For the real 27 July storm, roads closest to the initial blast area see 33–66% of 137Cs washed off, whereas in areas farther away from the blast, roads generally see a smaller fraction of their contamination washed away. This is in part due to the higher initial contamination load close to the blast zone, and also potentially because the less densely urbanized areas towards the north end of the model domain generated less runoff, as more of the precipitation was able to infiltrate in these areas (). Subcatchments characterized with the urban land use type exhibit little loss of their original fallout contamination (<12%). In contrast, following the design storm featuring a higher total precipitation amount, nearly all the roads lose 33–66% of their initial buildup, and much of the urban land use type loses a greater fraction of the initial 137Cs contamination (12–33%) compared to the real storm.
Figure 6. (a) 137Cs washoff and (b) maximum activity in overland flow and cumulative activity discharged at outfalls as a result of the 1-hour 2-year peak intensity storm that occurred on 27 July 2014.
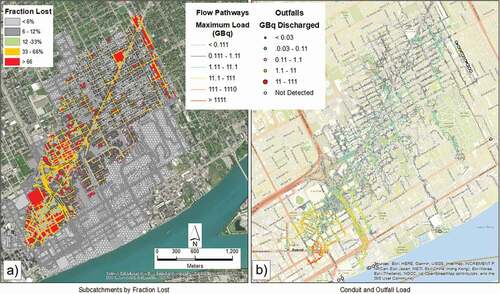
Figure 7. (a) 137Cs washoff and (b) maximum activity in overland flow and cumulative activity discharged at outfalls as a result of the 2-year, 24-hour MSE type III design storm.
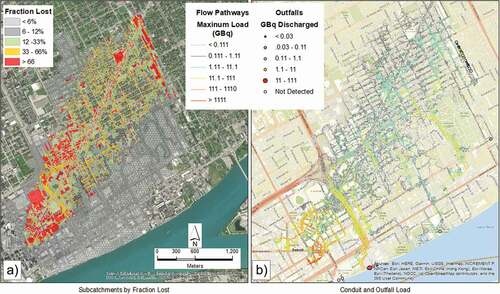
The maximum activity levels in overland flow () show a higher level of contamination closer to the detonation zone, which experiences a greater amount of initial contamination. The general distribution of the maximum 137Cs load in overland flow is similar between the two storms, but for the longer duration design storm, a greater fraction of the contamination is mobilized, as indicated by the higher total activity levels discharged at the model outfalls. The observed flux at the outfalls along the eastern model boundary are about the same as observed for the July 27 storm, but the amount discharged to the Detroit River is much greater for the longer duration storm. Identifying these primary pathways of contaminant transport and discharge areas to the Detroit River provides valuable information for conducting emergency response and remediation activities by identifying shifting ‘hot spots’ of contamination and informing more effective resource allocation.
4. Conclusions and future directions
This case study illustrates the process of modeling the washoff behavior and overland flow transport of 137Cs fallout that has been deposited following a hypothetical dirty bomb detonation in an urban setting using SWMM. Consistent with the literature (Vanoni Citation1975; Chow, Yusop, and Toriman Citation2012; Di Modugno et al. Citation2015), we find that the transport behavior is highly sensitive to the washoff coefficient and exponent, which highlights the need for additional studies to refine these parameters for radionuclides and other contaminants of public health concern. For both a short duration 2-year peak intensity rainfall event and a longer duration design storm, the primary contamination transport pathways in stormwater runoff were similar. This case study highlights the utility of modeling contamination washoff and transport processes, which is useful for identifying potential areas where contamination is likely to persist over time or concentrate in overland flow following a wide area contamination event. This information is beneficial for making informed decisions about emergency response and clean-up activities, as well as for emergency planning purposes.
Overland flow pathways will be intercepted by existing stormwater infrastructure, and some portion of the contaminant load will enter a subterranean conduit system and move in unanticipated ways due to flow control structures, routing systems, and redirection to storages. Therefore, additional work is needed to connect overland flow models to more traditional models of the existing pipe networks and other stormwater infrastructure to properly account for the movement of contamination from the surface to the drainage network. Because movement of contaminant mass into the drainage network effectively reduces the contaminant loading in surface flow, representation of these processes is necessary to more accurately predict surface concentration values and migration pathways. Surface models are much faster to develop than combined models, and therefore are useful for a cursory understanding of topographic driven contaminant transport during the early stages of response and recovery. However, with more time, these combined models will provide additional guidance for determining where contamination may accumulate and for estimating volumes of contaminated water that would require containment and storage. Information from a combined model would also better inform emergency response and recovery efforts, providing guidance, such as determining which storm drains should be stoppered to prevent further spread of contamination and in identifying optimal monitoring points for quantification of the impact and success of these efforts. It is recognized that more spatially detailed modeling demands a higher computational cost for varying degrees of impact (Ghosh and Hellweger Citation2012; Krebs et al. Citation2014; Goldstein, Foti, and Montalto Citation2016). The value added by the high resolution combined modeling continues to be an area of active research within EPA’s HSRP.
Disclaimer
The research described in this article has been funded wholly or in part by the U.S. Environmental Protection Agency Contract No. 68HERC19D0009 to APTIM Government Services. This manuscript was subject to administrative review but does not necessarily reflect the view of the U.S. Environmental Protection Agency. No official endorsement should be inferred, as the EPA does not endorse the purchase or sale of any commercial products or services.
Supplemental Material
Download PDF (639.2 KB)Acknowledgements
We are grateful to numerous contributors including Radha Krishnan of APTIM, Sherri Gee, John Norton, Wendy Barrott, and Walter Davis of Great Lakes Water Authority, and Brian Kelly of the USEPA Region 5.
Disclosure statement
No potential conflict of interest was reported by the author(s).
Supplementary material
Supplemental data for this article can be accessed https://doi.org/10.1080/1573062X.2021.1968007.
Related Research Data
References
- Anspaugh, L. 2008. Environmental Consequences of the Chernobyl Accident and Their Remediation: 20 Years of Experience, 47. Vienna, Austria: International Atomic Energy Agency.
- Beasley, T. M., and C. D. Jennings. 1984. “The Inventories of Plutonium-239,-240, Americium-241, Cesium-137, and Cobalt-60 in Columbia River Sediments from Hanford to the Columbia River Estuary.” Environmental Science & Technology 18 (3): 207–212. doi:https://doi.org/10.1021/es00121a014.
- Bonhomme, C., and G. Petrucci. 2017. “Should We Trust Build-up/wash-off Water Quality Models at the Scale of Urban Catchments?” Water Research 108: 422–431. doi:https://doi.org/10.1016/j.watres.2016.11.027.
- Chen, L., S. Roy, T. Boe, and A. Mikelonis. 2018. Survey and Assessment of Fate and Transport Models for Use following a Wide-area Urban Release to Inform Mapping, Characterization, and Site Clearance. Washington, DC, EPA/600/R-18/282.
- Chow, M., Z. Yusop, and M. E. Toriman. 2012. “Modelling Runoff Quantity and Quality in Tropical Urban Catchments Using Storm Water Management Model.” International Journal of Environmental Science and Technology 9 (4): 737–748. doi:https://doi.org/10.1007/s13762-012-0092-0.
- Cornell, R. 1993. “Adsorption of Cesium on Minerals: A Review.” Journal of Radioanalytical and Nuclear Chemistry 171 (2): 483–500. doi:https://doi.org/10.1007/BF02219872.
- Di Modugno, M., A. Gioia, A. Gorgoglione, V. Iacobellis, G. La Forgia, A. F. Piccinni, and E. Ranieri. 2015. “Build-up/wash-off Monitoring and Assessment for Sustainable Management of First Flush in an Urban Area.” Sustainability 7 (5): 5050–5070. doi:https://doi.org/10.3390/su7055050.
- Dominik, J., D. Burrus, and J.-P. Vernet. 1987. “Transport of the Environmental Radionuclides in an Alpine Watershed.” Earth and Planetary Science Letters 84 (2–3): 165–180. doi:https://doi.org/10.1016/0012-821X(87)90083-5.
- Esri. 2017. [ online].
- Evrard, O., J. P. Laceby, H. Lepage, Y. Onda, O. Cerdan, and S. Ayrault. 2015. “Radiocesium Transfer from Hillslopes to the Pacific Ocean after the Fukushima Nuclear Power Plant Accident: A Review.” Journal of Environmental Radioactivity 148: 92–110. doi:https://doi.org/10.1016/j.jenvrad.2015.06.018.
- Ghosh, I., and F. L. Hellweger. 2012. “Effects of Spatial Resolution in Urban Hydrologic Simulations.” Journal of Hydrologic Engineering 17 (1): 129–137. doi:https://doi.org/10.1061/(ASCE)HE.1943-5584.0000405.
- Goldstein, A., R. Foti, and F. Montalto. 2016. “Effect of Spatial Resolution in Modeling Stormwater Runoff for an Urban Block.” Journal of Hydrologic Engineering 21 (11): 06016009. doi:https://doi.org/10.1061/(ASCE)HE.1943-5584.0001377.
- Great Lakes Water Authority. 2019. “Capital Improvement Plan 2020-2024.” [ online]. https://www.glwater.org/wp-content/uploads/2019/01/2020-2024-CIP-Approved-2019-03-13.pdf
- Homer, C., J. Dewitz, L. Yang, S. Jin, P. Danielson, G. Xian, J. Coulston, N. Herold, J. Wickham, and K. Megown. 2015. “Completion of the 2011 National Land Cover Database for the Conterminous United States—representing a Decade of Land Cover Change Information.” Photogrammetric Engineering and Remote Sensing 81 (5): 345–354.
- Hong, Y., C. Bonhomme, B. Van Den Bout, V. Jetten, and G. Chebbo. 2017. “Integrating Atmospheric Deposition, Soil Erosion and Sewer Transport Models to Assess the Transfer of Traffic-related Pollutants in Urban Areas.” Environmental Modelling & Software 96: 158–171. doi:https://doi.org/10.1016/j.envsoft.2017.06.047.
- Hood, M., A. Reihan, and E Loigu. 2007. “Modeling Urban Stormwater Runoff Pollution in Tallinn, Estoniaed.” In Proceedings of International Symposium on New Directions in Urban Water Management, 12–14. Paris: UNESCO.
- Khanbilvardi, R., V. Shestopalov, I. Onishchenko, V. Bublyas, and V. Gudzenko. 1999. “Role of Erosion Processes in Transfer of Radionuclides: Results of Field Experiments 1.” JAWRA Journal of the American Water Resources Association 35 (4): 887–898. doi:https://doi.org/10.1111/j.1752-1688.1999.tb04182.x.
- Konoplev, A. 2016. “Comparative Analysis of Radioactive Cesium Wash-off from Contaminated Catchment Areas after Accidents at the Fukushima Dai-ichi and Chernobyl Nuclear Power Plants.” Geochemistry International 54 (6): 522–528. doi:https://doi.org/10.1134/S0016702916040042.
- Krebs, G., T. Kokkonen, M. Valtanen, H. Setälä, and H. Koivusalo. 2014. “Spatial Resolution Considerations for Urban Hydrological Modelling.” Journal of Hydrology 512: 482–497. doi:https://doi.org/10.1016/j.jhydrol.2014.03.013.
- Lee, S. 2015. Particle Transport of Radionuclides following a Radiological Incident. EPA Report Number EPA/600/R-15/113. Washington, DC: U.S. Environmental Protection Agency.
- Lemieux, P., T. Boe, and C. Hayes. 2020. “Tool for Developing Integrated Strategies for Decontamination and Waste Managemented.” In 2020 Waste Management Symposia. Phoenix, AZ: WM SYMPOSIA.
- Maharjan, B., K. Pachel, and E. Loigu. 2017. “Modelling Stormwater Runoff, Quality, and Pollutant Loads in a Large Urban Catchment.” Proceedings of the Estonian Academy of Sciences 66 (3): 225. doi:https://doi.org/10.3176/proc.2017.3.02.
- Michigan Department of Transportation. 2006. Rainfall Frequency Zones and Intensity Duration Tables, Drainage Manual Appendix 3-b. Lansing, MI: Michigan Department of Transportation. https://www.michigan.gov/mdot/0,4616,7-151-9621_11041_91575_91583-93193--,00.html
- Muthusamy, M., S. Tait, A. Schellart, M. N. A. Beg, R. F. Carvalho, and J. L. De Lima. 2018. “Improving Understanding of the Underlying Physical Process of Sediment Wash-off from Urban Road Surfaces.” Journal of Hydrology 557: 426–433. doi:https://doi.org/10.1016/j.jhydrol.2017.11.047.
- Niemi, T. J., T. Kokkonen, N. Sillanpää, H. Setälä, and H. Koivusalo. 2019. “Automated Urban Rainfall–runoff Model Generation with Detailed Land Cover and Flow Routing.” Journal of Hydrologic Engineering 24 (5): 04019011. doi:https://doi.org/10.1061/(ASCE)HE.1943-5584.0001784.
- Petrucci, G., and C. Bonhomme. 2014. “The Dilemma of Spatial Representation for Urban Hydrology Semi-distributed Modelling: Trade-offs among Complexity, Calibration and Geographical Data.” Journal of Hydrology 517: 997–1007. doi:https://doi.org/10.1016/j.jhydrol.2014.06.019.
- Ratliff, K., A. Mikelonis, and J. Duffy. 2020. “Characterizing Cesium Sorption in Freshwater Settings Using Fluvial Sediments and Characteristic Water Chemistries.” Journal of Environmental Management 253: 109688. doi:https://doi.org/10.1016/j.jenvman.2019.109688.
- Rossman, L. 2015. Storm Water Management Model User’s Manual Version 5.1. Washington, DC, EPA- 600/R-14/413b.
- Sartor, J. D., and G. B. Boyd. 1972. Water Pollution Aspects of Street Surface Contaminants. Report Number: EPA-R2-72-081. Washington, DC: U.S. Government Printing Office.
- Smith, J., R. Clarke, and R. Saxén. 2000. “Time-dependent Behaviour of Radiocaesium: A New Method to Compare the Mobility of Weapons Test and Chernobyl Derived Fallout.” Journal of Environmental Radioactivity 49 (1): 65–83. doi:https://doi.org/10.1016/S0265-931X(99)00088-0.
- Temprano, J., Ó. Arango, J. Cagiao, J. Suárez, and I. Tejero. 2006. “Stormwater Quality Calibration by Swmm: A Case Study in Northern Spain.” Water Sa 32 (1): 55–63.
- U. S. Envrionmental Protection Agency. 2016. Swmm Technical Reference Manual Volume 3, Water Quality, EPA 600-R1-2016.
- U.S. Army Corps of Engineers. 2003. Geospatial Hydrologic Modelling Extension, Hec-geohms, Version 1.1. California, USA: US Army Corps of Engineers Hydrologic Engineering Center.
- U.S. Department of Health and Human Services. “O.O.T.a.S.F.P.a.R., National Planning Scenario #11.” [ online]. https://www.phe.gov/Preparedness/planning/playbooks/rdd/Pages/scenario.aspx
- Ueda, S., H. Hasegawa, H. Kakiuchi, N. Akata, Y. Ohtsuka, and S. I. Hisamatsu. 2013. “Fluvial Discharges of Radiocaesium from Watersheds Contaminated by the Fukushima Dai-ichi Nuclear Power Plant Accident, Japan.” Journal of Environmental Radioactivity 118: 96–104. doi:https://doi.org/10.1016/j.jenvrad.2012.11.009.
- Vanoni, V. 1975. Sedimentation Engineering, Manuals and Reports on Engineering Practice No. 54. New York, NY: American Society of Civil Engineers.
- Warsta, L., T. J. Niemi, M. Taka, G. Krebs, K. Haahti, H. Koivusalo, and T. Kokkonen. 2017. “Development and Application of an Automated Subcatchment Generator for Swmm Using Open Data.” Urban Water Journal 14 (9): 954–963. doi:https://doi.org/10.1080/1573062X.2017.1325496.