
ABSTRACT
The paper investigates per capita water consumption in Sirte city using a questionnaire survey data. The data captured included frequency, duration, flow rate, time of water use for each water end-use and household characteristics (demographic and socio-economic). The results show that the average daily per capita water consumption is 255 l/p/d. The per capita water consumption decreases with the increase in family size, while household income does not affect water consumption. Handwash basin tap accounts for the highest water consumption. The diurnal water consumption pattern is different from developed countries patterns and has multiple peaks. To predict the city’s future water demand, three statistical models based on multiple linear regression technique (STEPWISE) were developed. The comparison of the developed models suggests that the models based on demographic variables can produce acceptable results and any further inclusion of additional variables (physical characteristics of households) do not necessarily improve the prediction accuracy.
1. Introduction
Water is a key resource for economic development. Sufficient quantities of water is a must for sustaining life, industrial development, agricultural expansion, and environmental protection (Duarte, Pinilla, and Serrano Citation2013). Water demand in turn increases due to population growth, urbanization, industrialization and improving living standards (Domene and Saurí Citation2006; Kenney et al. Citation2008; Lee, Park, and Jeong Citation2012; Simukonda, Farmani, and Butler Citation2018). The demand increases rapidly, particularly in developing countries, to the extent that infrastructure is under enormous pressure. Local water supply authorities and water planners face challenges to adequately provide water supply and sanitation services (Abderrahman Citation2000; Simukonda, Farmani, and Butler Citation2018). A combination of these factors has contributed to freshwater scarcity issues in both developed and developing countries (Al-Rashed and Sherif Citation2000; Hussien, Memon, and Savic Citation2016).
Additionally, limited water resources and climate uncertainties magnify the water scarcity challenge. The water demand-supply deficit is reaching critical levels in many countries. In 2017, 29% of the global population (2.2 billion people) faced water scarcity (World Health Organization WHO, UNICEF Citation2019). Two-thirds of the world’s population would be living in water-stressed countries by 2025 (Arnell Citation2004). Consequently, improved water resources management approaches are critical.
For domestic water demand management, there is a need for detailed information on water end-use behavior and household water use patterns to ensure efficient water resources management planning. Domestic water demand is a function of several factors such as econometric variables (Bhatti and Nasu Citation2010), socio-demographic profiles (Duarte, Pinilla, and Serrano Citation2013), housing characteristics (Syme, ShaoQ, and Campbell Citation2004), accessibility to the water source (Davies et al. Citation2014), household economic class, water quality, climate and hydrological factors (Slavíková et al. Citation2013). In order to understand domestic water demand, daily water end-uses (bath, shower, toilet flushing, hand wash basin tap, cooking, dishwashing, laundry, house washing, garden watering, yard cleaning, vehicle washing and swimming pool) should be investigated. Understanding water consumption behaviours through water end uses analysis can also help develop targeted water efficiency campaigns, prioritise retrofitting of water-saving devices and influence consumption behaviours (Marinoski et al. Citation2014).
In developed courtiers, domestic water demand has been effectively analysed (Loh and Coghlan Citation2003; Nauges and Whittington Citation2009; Willis et al. Citation2013; Beal, Stewart, and Fielding Citation2013; Davies et al. Citation2014), In these countries, several studies have analysed end-use water consumption characteristics (Gregory and Leo Citation2003; Loh and Coghlan Citation2003; Syme, ShaoQ, and Campbell Citation2004; Beal, Stewart, and Fielding Citation2013). The findings from these studies are broadly similar and indicate diurnal water consumption profiles.
Domestic water consumption varies according to the time of the day, day of the week and season of the year. Daily variations in domestic water consumption are represented in the form of diurnal time patterns. These patterns are the main tool for studying and understanding the variations of households water use during the day. Several studies have investigated diurnal time patterns for various end uses such as shower, bath, toilet flushing, dishwashing and laundry. However, all these studies were in developed countries and they provide limited details on end uses such as tap, other domestic and external uses. In addition, some end uses such as vehicle washing, cooking and house floor washing (room, kitchen and toilets) are not discussed in these studies. Moreover, there is a lack of studies on developing countries, especially in the North African countries. This study not only investigates the missing water end uses but attempts to develop water consumption diurnal profiles segregated at a micro-component level. The information developed via this study can help towards improved water demand management and an evidence-based (data-driven) water supply and wastewater management infrastructure design and operation. The average daily water consumption, peak day and peak hour demand are the major parameters for designing and construction of water delivery infrastructure (Beal and Stewart Citation2014).
In developing countries, several studies have modelled and estimated domestic water demand using different households socio-economic characteristics. These are the number of women in the household in Ukunda, Kenya (Mu, Whittington, and Briscoe Citation1990), education level in Faisalabad, Pakistan (Madanat and Humplick Citation1993), family size in Madagascar, Southern Africa (Larson, Minten, and Razafindralambo Citation2006) and walking time to water source in Freetown City, Sierra Leone (Ibrahim, Memon, and Butler Citation2021). Besides evaluating the influence of socio-economic characteristics on per capita consumption patterns in urban areas of Duhok city, Iraq and Freetown City, Sierra Leone, Hussien, Memon, and Savic (Citation2016) and Ibrahim, Memon, and Butler (Citation2021) considered physical household characteristics (e.g. built-up area, garden area, number of rooms, kitchen, toilet and number of floors) to develop effective models for domestic water demand estimation. However, they did not take into account the number of kitchens and toilets in the investigated typical households. The present study also attempts to develop data driven water consumption forecasting models using a holistic approach that includes all the investigated water end uses for a typical city in Libya.
2. Materials and methods
2.1. Study area
Libya is one of the water-stressed countries. It is an arid and dry country with about 94.5% of the country being a desert (PCSC Citation2003; GMRWUA Citation2005). The rainy season in the country is very short with a limited amount of rainfall. Around only 5% of the country receives more than 100 mm every year (Abufayed and El-Ghuel Citation2001; Bindra et al. Citation2013). The water scarcity problem in Libya was managed by pumping groundwater from the south for agriculture, industry, and domestic uses (Abufayed and El-Ghuel Citation2001).
The city of Sirte is located in the north of Libya between 31° 12’ 32.11” North and 16° 35’ 19.18’ East (). It has a population of around 128,123 inhabitants and an area of 77.66 km2 (SMP Citation2018). The arid climate of the city is affected by the Mediterranean Sea in the north and the desert in the south. The temperature varies during the year. It ranges from 8 to 23°C in winter and from 18 to 31°C in summer. Relative humidity ranges between 65% in March and 78% in July. The annual rainfall in Sirte ranges between 7 and 435 mm/year with an average of 189 mm/year (WWCI Citation2019).
Figure 1. Sirte city location in Libya, MMRP distribution system (GMRWUA Citation2005) and the distribution of surveyed households in the city.
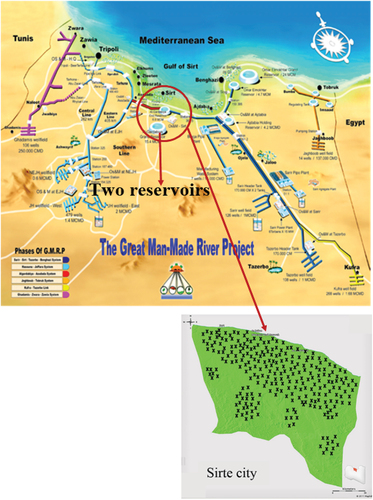
The water source in the city derives from Man-Made River Project (MMRP). The MMRP was designed and implemented to transfer huge volumes of groundwater from south of Libya to the north through 4 m diameter pipes (Pim and Binsariti Citation1994; Abderrahman Citation2000, Citation2008; Nasar Citation2015). The water is stored in large reservoirs located in different cities in Libya. Sirte city has two of these reservoirs () (McKenzie, Elsaleh, and PARKMAN Citation1994). From these reservoirs, the water is supplied to many competing uses. These include agricultural and livestock which use 83% of the water, municipalities that get 14% of the water which they distribute for domestic use and industries that use 3% (GMRWUA Citation2005). The estimated water consumption for Sirte city from MMRP is 12 million m3/year which is fully supplied by the city municipality (GMRWUA Citation2006).
2.2. Data collection
In this study, a comprehensive water consumption survey was conducted at the household level. The survey was prepared in both English and Arabic language with 72 multiple choice questions, attached as appendix/supplementary material. The ultimate objective of the survey was to collect data on household characteristics and water end-use parameters. The collected information on household characteristics included the number of people living in a household (children, elders, adult males and females) and their ages, household type, number of rooms, number of kitchens and toilets, number of floors, total built-up area, garden area and total monthly income. Regarding household water consumption, the survey included questions on the frequency, duration of end-use and flow rate of each end-use (i.e. bath, shower, hand wash basin tap, toilet flushing, dishwashing, clothes washing (manually or using the machine), room, kitchen and toilet floor washing, garden watering, vehicle washing and swimming pool. In addition, the time of water use for each activity during the day was also captured.
The survey was distributed for the winter season in December 2017 and February 2018. It was distributed to over 400 local staff and students of the faculties of engineering and medicine in the University of Sirte and 380 replies were received. For the students, the survey was given as coursework. Because of the absence of meters to measure the water flow rate and duration, the students were trained to measure the duration and flow rate of water. This was done using clocks and buckets for collecting water for each end-use. By this approach, the water consumption was calculated for each end-use as a function of frequency, flow rate and duration of running water.
To make sure all students made accurate measurements, the method was tested by some members of staff from the faculties who had meetings where they explained how the measurements should be done as directed by the first author. Then, the method was separately tested by the first author and 10 purposively selected educated people from the community. The results from this test were compared with those from the members of staff. From the comparison of results and discussions with the members of staff, the first author decided on the acceptable ranges for flow rate and duration of all water end uses. The ranges were used to check and control students’ answers thereby providing reasonably reliable data. The values that were outside the acceptable ranges were rejected. With regards to diurnal water end-uses patterns, every participant recorded the time when using water for all end uses. The collected data were analysed using IBM SPSS Statistics Version 25 package. The analysis included calculations of statistical parameters (i.e. average, minimum, maximum and distribution shape identification through kurtosis and skewness) for the characteristics of the 380 households. The analysis also determined the correlation coefficient which is a statistical parameter that shows whether and how strongly pairs of variables are related. The correlation coefficient was calculated for the relationship between household water consumption (l/hh/d) and household characteristics.
2.3. Development of statistical models
The data collected from 380 households were divided into 70% as calibration set (i.e. training) while the remaining 30% was spared for validation (i.e. testing) purposes. In particular, the calibration data set was used to develop statistical models to predict household water consumption as a function of demographic and physical characteristics. The household demographic characteristics were family size, number of children, elders, adult males and females. Physical characteristics were total household built-up area, garden area, number of rooms, number of kitchens, number of toilets, number of floors and household income. The validation set was then used towards evaluating the performance of the model after it learnt from the calibration set.
Three regression models were developed using the multiple linear regression (STEPWISE) technique implemented in IBM SPSS Statistics (v. 25) software. The STEPWISE technique has been used widely to predict water demand (Cevik Citation2007; Hussien, Memon, and Savic Citation2016; Yasar, Bilgili, and Simsek Citation2012; Ibrahim, Memon, and Butler Citation2021). The best subset model was used for daily household water consumption estimation.
3. Results and discussion
3.1. Household characteristics
The collected data of surveyed households in Sirte City were analysed. The statistical parameters of household characteristics are shown in (Appendix B). The analysis shows that the average number of people in a household is 6.58 () which is approximately equivalent to the average standard family size (7.04) in Duhok city, Iraq (Hussien, Memon, and Savic Citation2016). The average number of children, adult males females and elders is 1.86, 2.10 2.32 and 0.33 respectively (, Appendix B). These numbers are broadly comparable with earlier study (Hussien, Memon, and Savic Citation2016) for the developing countries context similar to Libya. (Appendix B) shows that 77% of families live in houses and 23% in apartments. Out of 380 households, 305 were single-storey, 69 were double-storey and only 6 were triple-storey. The average number of rooms in a household was 6. The average number of kitchens in each apartment was 1.6 (Appendix B). However, it varied from 1 to 5 kitchens in a house depending on the number of people living in a house, the number of floors and the house size. The number of toilets in an apartment is 1 to 2 toilets, while, in a house, it ranged between 1 and 6 depending on the size of the house and the number of floors.
Figure 2. Frequency distribution of household characteristics.
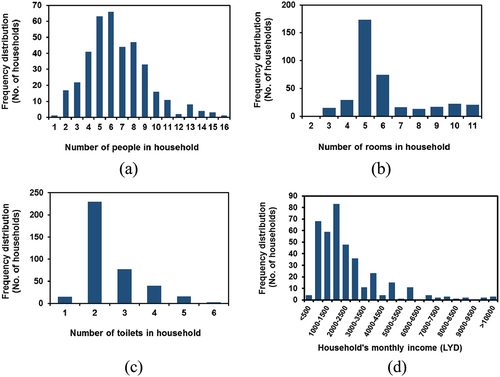
The socio-economic characteristics of the households show that the total built-up area for a house or apartment in the investigated area ranges between 100 and 650 m2 with about 31.45 m2 as a garden area. The average monthly household income is £1335.493.Footnote1 shows the frequency distribution of household characteristics.
3.2. Average per capita end-use water consumption
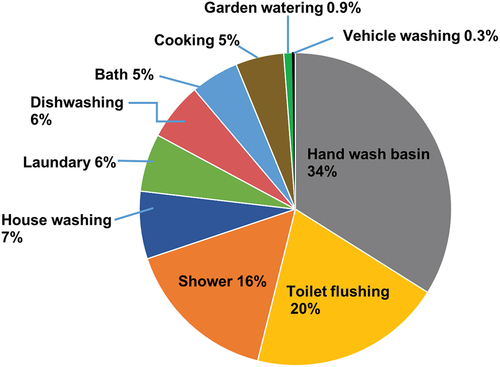
The analysis of surveyed data shows that the average per capita water consumption in Sirte is 255 l/p/d in the winter season. This is considerably higher than many of the developed countries (e.g 138 l/p/d in Portugal (Jorge et al. Citation2015), 128 l/p/d in the UK, 143 l/p/d in the USA and 138 l/p/d in Korea (Lee, Park, and Jeong Citation2012) and 128 l/p/d in Australia for summer (Athuraliya, Roberts, and Brown Citation2012)). There seems to be considerable scope for implementing water demand management measures. The per capita water consumption was divided into end-uses which are bath, shower, hand wash basin use, toilet flushing, dishwashing, laundry, house washing, garden watering, cooking, vehicle washing and swimming pool. The daily per capita water use for all activities is a function of the frequency, the duration and the flow rate from the respective water using appliance/fitting.
shows the percentage and average per capita consumption for each water end-use. The figure shows that the largest consumption is attributed to hand wash basin tap use (34%), followed by toilet flushing (20%). Water consumption from taps use is much higher than reported for the developed world, (e.g. 15.7% in the USA (Mayer et al. Citation1999) and 16% in Australia (Athuraliya, Roberts, and Brown Citation2012; Beal and Stewart Citation2014)). High tap water use in Libya can be attributed to water consumption for ablution, a mandatory requirement before five daily prayers. The percentage of per capita water consumption for bathing and cooking are the lowest (5%). For outdoor use (watering garden and vehicle washing), per capita water consumption is less than 1%. The results suggest that in Libyan gardening watering in winter is not frequent. Vehicle washing at home is not frequent because households tend to wash their vehicle at the services.
Figure 3. Characteristics of end-use water consumption.
3.3. Impact of household characteristics on the daily average water consumption per household (l/hh/day)
The analysis of the surveyed households shows a strong positive correlation coefficient (R2 = 0.89) between household water consumption and household occupancy (i.e. the number of people in the household) (). On the contrary per capita consumption tend to decrease with increased household occupance.
Figure 4. Relationship between household water consumption (l/hh/d) and household characteristics.
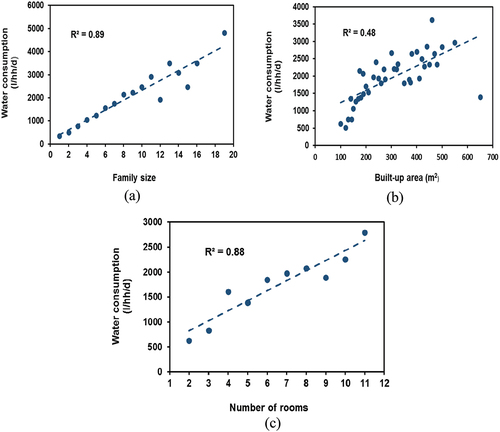
It can be observed from the data that the household water consumption also increases with the increase in total household built-up area (R2 = 0.48) and the number of rooms (R2 = 0.88) ()). This finding is in agreement with other studies for developing (Hussien, Memon, and Savic Citation2016) and developed (Cavanagh, Hanemann, and Stavins Citation2002) countries. For Sirte city, the garden area has no relationship (R2 = 0.0001) with water consumption because many people in the city do not water their gardens. However, Hussien, Memon, and Savic (Citation2016) found a strong relationship (R2 = 0.59) between garden watering and garden area for an Iraqi city.
Moreover, the total household water consumption increases with the increase in the number of children, adult males and females, elders, number of kitchens and toilets with a very positive strong correlation coefficient (R2 = 0.85, 0.86, 0.69, 0.92, 0.59, 0.90 and 0.88, respectively). However, there is no correlation (R2 = 0.01) between water consumption and family income. This means that the total household income does not seem to affect water consumption because water is free.
3.4. The Influence of household characteristics on the average per capita water consumption per day (l/p/d)
The analysis found that the average daily per capita water consumption is 255 l/p/d. Apartments consume slightly less (251 l/p/d) because for apartments garden-watering end-use does not exist. shows the distribution of daily per capita water consumption. Approximately 3% of surveyed households consume water more than 450 l/p/d. In terms of gender, the average water consumption for females (260 l/p/d) is higher than that for males (247 l/p/d), because they stay most of the time at home and take care of the family. Further analysis shows that the increase in the number of children and elders (i.e. > 65 years), reduces average per capita water consumption with R2 = 0.71 and 0.70 respectively.
Figure 5. Frequency distribution of average per capita water consumption (l/p/d).
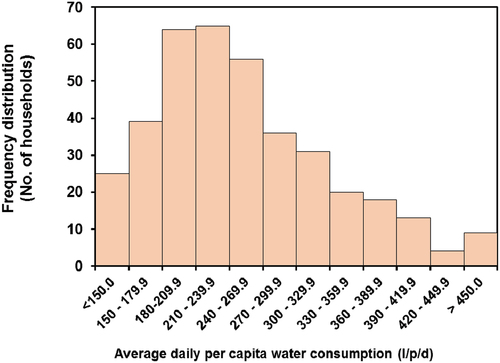
In agreement with Edwards and Martin (Citation1995) and Hussien, Memon, and Savic (Citation2016), the analysis shows that daily per capita consumption increases with the increase in the total built-up area of the household. Daily per capita water consumption also increases with the increase in the number of floors in a household (R2 = 0.79). The number of toilets in a household, in general, shows increases in the daily average per capita water consumption (R2 = 0.56).
3.5. Water user behavior
3.5.1 Diurnal patterns
The survey data was used to extract water consumption variations over 24 hours for each water end-use per capita and household. The developed plots can help to identify the peak time(s) where a particular end-use typically occurs and its associated water consumption. shows that using water for toilet flushing, hand washing basin and shower starts in the morning and reaches the peak between 7 am and 9 am depending on the time when members of the household get up and prepare to go to work or school. Then, water use decreases sharply and starts to increase again after the people return to their homes.
Figure 6. Time pattern for water usage for each end-use per capita per day.
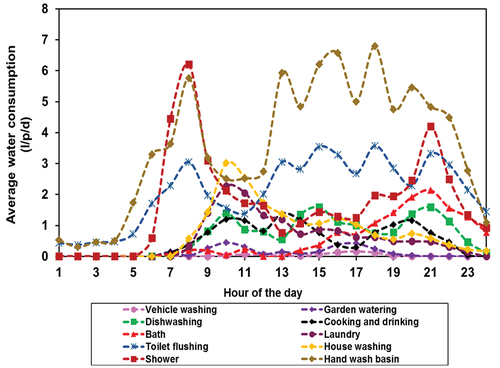
The remaining water end-uses start later in the morning from 9 am. In the case of bathing, normally water use is low during day time but increases at night time when the people are back home after work and have a bath to relax. Generally, water comparison for indoor end-uses (bath, shower, toilet use, cooking, house washing, hand wash basin, dishwashing and laundry) is higher than outdoor end-use (garden watering and vehicle washing). The outdoor water consumption is very small because households prefer washing vehicles at washing services and they do not water gardens frequently. The diurnal water consumption profile in this study () has multiple peaks which are significantly different from typical profiles reported for the developed countries (). This difference can be attributed to several factors including cultural difference, male to female employment ratio, climate and affluence.
Table 1. Summary of the diurnal water demand patterns in developed countries.
3.5.2. Water end-uses
The water usage behavior was investigated through the detailed analysis of frequency, duration (minute) and flow rate (liter per minute) for each end-use. The results are summarised below in and (Appendix B).
Table 2. Summary of average water end-uses for the surveyed household.
3.5.2.1. Bath
Although bathtub is available in most surveyed households, bathing is not a common practice in Sirte but bathtubs are usually used for showering. Of the 380 households, only 129 use bathtubs for bathing. The average per capita water consumption for bathing is 13 l/p/d (). The average frequency and volume of water used for bathing are shown in (Appendix B). The surveyed households tend to have 1 to 4 baths per week. The analysis of the time pattern for bathing shows that most of the people in the study area prefer bathing in the evening (). This is expected and suggests bathing activity only takes place for relaxing purposes. Based on the limited use of baths as discovered in this study, any further investigations focusing on baths are unlikely to reveal any significant insights for the quantification of per capita consumption in the study area.
3.5.2.2. Shower
The results show that showering is the third largest user for water in the surveyed households. The daily average per capita water consumption for showering is 41 l/p/d (). The average daily frequency, duration and flow rate for showering are presented in (Appendix B) which shows that households take a lot of time showering, but the flow rate is less when compared with other research findings (). This is because most of the households seem to use showerheads with a low flow rate and power showerheads are not common, an emerging concern mainly in the developed world. The water use hourly peak for showering in the study area is 6 l/p/d at 8 am before people go to work or school. Water use for the shower is low during day times, but it is high again in the night before going to bed as presented in .
Table 3. Comparison of mean values of water end-use parameters with other studies.
3.5.2.3. Hand wash basin (taps)
The average daily per capita water consumption for hand wash basin tap is 86 l/p/d which is the highest compared to other water end-uses (). The average usage frequency for handwash basin tap is approximately 6.87 times per day. This could be for ablution before prayers and after the use of the toilet. The average duration and flow rate of tap usage is shown in (Appendix B). shows that the first peak of using hand wash basin tap is in the morning from 7 to 8 am. This is before people go to work. The other peaks are in the afternoon and evening. These peaks appear a result of the presence of all the people at home after work and school and maybe indicating water use for ablution before prayers.
3.5.2.4. Toilet use
Average daily per capita water consumption for toilet flushing is a function of the volume of water used per flushing and the frequency of toilet use. Toilet flushing is the second highest water end-use (50.71 l/p/d) in the study area (). (Appendix B) presents the frequency and volume of water used per toilet flushing which depends on the type of the flushing toilet (i.e. cistern volume). shows that the average flush volume from 7 am to 9 am is around 3 l/p/d. Then, the volume of water usage decreases until 13:00 hours when people are out of their households either at work or at school. After 13:00 hours, the toilet usage starts increasing. Further investigations indicated the toilet use during off-peak hours correlates well with the number of female and elderly family members at home.
3.5.2.5. Dishwashing
The survey investigated whether the households use a dishwasher, manual wash, or both. Out of the 380 households, 315 wash dishes manually, 36 use machines and 29 do both. The dishwasher ownership was found to be low and is broadly consistent with global trends including the developed world. The total average daily water consumption for dishwashing is 15.71 l/p/d ().
3.5.2.5.1. Dishwashing Manually
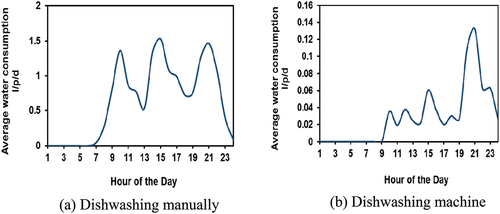
The average daily per capita water consumption for manual dishwashing is 14.97 l/p/d (). The average frequency, duration and flow rate for dishwashing are presented in (Appendix B). The time pattern analysis for manual dishwashing shows that there are 3 peaks at 10 am for breakfast, at 15:00 hours for lunch and at 21:00 hours for dinner . Further analysis of the manual dishwashing activities indicated that the associated water use pattern of three distinct peaks is consistent for households with a higher proportion of female members and children, eating at home mainly instead frequent out of home meals.
Figure 7. Time pattern for water usage for dishwashing per capita per day.
3.5.2.5.2. Dishwashing Machine
The average daily per capita water consumption for dishwashing by machine is 0.71 l/p/d (). This is a function of frequency and the rate of water use by the dishwashing machine. The average frequency and rate of water usage are shown in (Appendix B).
For hourly use of dishwashing, shows that dishwashers are mainly used at night time between 20:00 and 21:00 hours. The temporal profile shows three distinct peaks correlating well with dishwashing after each of the three daily meals. A comparison of results indicates that water consumption for manual dishwashing is much higher than that for dishwashing with machines. With the deployment of more water-efficient machines, consumption can be reduced further. However, changing established practices embedded in cultural norms, space constraints in existing kitchens, uneasy access to dishwashers and lack of their wider availability in Sirte city are some of the key challenges that need addressing.
3.5.2.6. Laundry
This study investigated whether the households do their laundry manually, use a washing machine or both. Of the 380 households, 317 use washing machine only for laundry times and 63 wash their clothes both manually and by washing machines. The total average water consumption for laundry is 14.24 l/p/d ().
3.5.2.6.1. Manual laundry
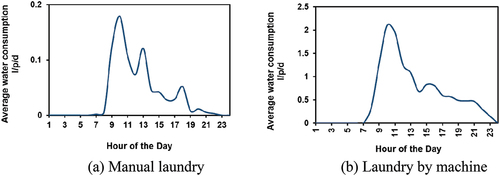
The average daily water consumption is 0.84 l/p/d with average frequency, duration and flow rate as shown in and (Appendix B) respectively. shows the hourly usage of water for laundry and suggests that households start to do their laundry in the morning between 9 am and 11 am depending on the availability of housewives or holidays.
Figure 8. Time pattern for water usage for laundry per capita per day.
3.5.2.6.2. Laundry by machine
The average water consumption for laundry by machine was computed as a function of the volume of water usage per washing cycle and the washing machine use frequency. From , the average daily water consumption is 13.4 l/p/d. The small volume of water consumed in this end-use is because people in the study area especially males prefer to wash and iron their clothes at paid external washing services. The average frequency of washing machine use and the volume of water used is shown in (Appendix B). The analysis shows that the surveyed households do their laundry from 1 to more than 10 times a week, depending on the family size.
shows the hourly use of water for this end-use. It shows that laundry is mostly done in the morning time between 9 am and 11 am.
3.5.2.7. House washing
About 7% of the total water consumption is used for house washing (). The total average daily water consumption for house washing is 18.3 l/p/d (). House washing activities include washing of room, toilets and kitchens floors. Households in Sirte city, tend to wash the floor of their toilets every day depending on the number of people occupying the house. However, kitchen washing is not as regular as toilets because people cover the kitchen floor with carpet which is the same for rooms. For this reason, the households were asked questions for each part (toilets, kitchens, and rooms) separately in terms of the frequency, duration, flow rate and the time that they use water for each end-use for house washing (, Appendix B). The total time pattern for house washing is shown in which shows that the majority of households (housewives) prefer to wash their houses from 9 am to 11 am with the peak at 10 am.
3.5.2.7.1. Toilet washing
The average daily water consumption for toilet washing is 12.94 l/p/d with an average frequency of 1.83 per day ( and , Appendix B). Depending on the number of toilets in the house, households tend to wash toilet floors every day between 1 to 4 times a day depending on the number of people who occupy the house and their availability.
The frequency, duration and flow rate are shown in (Appendix B). Most households use water for toilet washing and cleansing between 9 am and 11 am which results in the highest peaks of 2.1 l/p/d at 10 am as shown in .
Figure 9. Time pattern for water usage for house washing per capita per day.
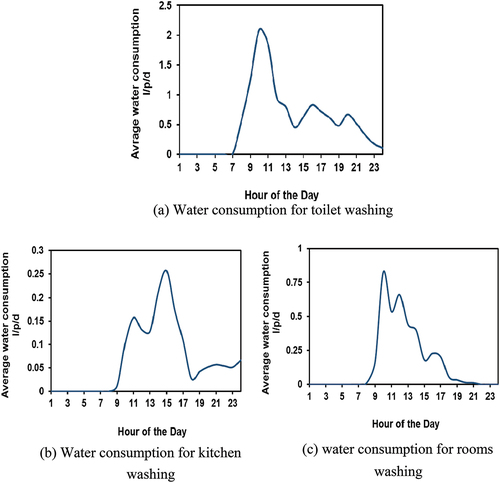
3.5.2.7.2. Kitchen washing
The average daily water use for kitchen washing is 1.60 l/p/d () The average frequency, duration and flow rate of water usage are shown in (Appendix B). Households tend to wash kitchen floors between 1 to 4 times per week. Around 3.2% of the households do not wash kitchen floors during the week because the floor is covered to keep the kitchen warm. The duration of using the tap for washing kitchens varies depending on the size and number of kitchens in the house and the attitude of households in terms of water usage. Most of the households tend to wash the floors of their kitchens after finishing dishwashing after lunch time around 15:00 hours .
3.5.2.7.3. Rooms washing
The average household water consumption for washing rooms is 3.81 l/p/d () and the average frequency, duration and flow rate are shown in (Appendix B). The duration of water usage for washing rooms depends on the number and the size of rooms in the house and also the attitude of the households on water consumption. The 24 hours time pattern for water usage for washing rooms shows that households start using water for washing between 10 am and 12 noon.
3.5.2.8. Cooking
The volume of water used for cooking includes water for preparing food (washing vegetables, meat, and fruits) and water used for drinking or preparing coffee, tea or juice. The average water consumption is 12.7 l/p/d (). The average frequency and volume of water required for cooking are shown in (Appendix B). The analysis shows that the whole family consumed water for cooking less than 10 l/hh to more than 40 l/hh depending on the family size and family members’ availability in the household.
shows the hourly usage of water for food preparation and indicates that there are 3 peaks in the pattern, between 9 am and 11 am, 13:00 and 14:00 hours and 19:00 and 20:00 hours corresponding to breakfast, lunch and dinner times respectively.
3.5.2.9. Garden watering
The average water consumption for garden watering is 2.4 l/p/d as shown in . The average frequency, duration and flow rate per day are shown in (Appendix B). The results show that about 217 (57%) of the households do not water gardens. Some of these have gardens while others do not have. About 18% of the households water their gardens twice per week. 33% of the households take between 20 and 30 minutes to water their gardens and 22% water their gardens for 10 to 20 minutes. Watering gardens is in the morning from 9 am to 11 am and in the afternoon between 16:00 and 18:00 hours ().
3.5.2. 10. Vehicle washing
Water usage for vehicle washing is the lowest (0.74 l/p/d) compared to other end-uses as shown in . This is because households 276 (73%) in Sirte city prefer washing their vehicles at car wash service stations. The average frequency, duration of water use and flow rate for vehicle washing is shown in (Appendix B). For households that wash their vehicles at home , they mostly wash their vehicles at home in the afternoon from 16:00 to 18:00 hours The morning peak (between 10 am and 12 pm) is at the weekend and holidays.
The comparison of frequency, duration and flow rates for all end uses discussed in this study with past studies are summarised in . The table suggests there is a considerable variation in the magnitude of water used for different end uses. This is not surprising, since the reported studies represent different countries, contexts and cultural shades and to some extent predominant climatic and socio-economic conditions including demographic compositions. Consequently, although households in Sirte use devices with very low flow rates for all end uses, water consumption is high because of the long duration and high frequency of water use. These may be related to households habits, lack of knowledge to use water efficiently or because the water is free.
3.7 Performance of the statistical models
Using the calibration data set, the relationship between the household characteristics (independent variables) and households water consumption (dependent variable) is investigated and the values of the correlation coefficient (R) are obtained (). From the table, it can be seen that the strongest relationship of household consumption is with the family size followed by the number of adult females and the number of adult males in the house.
Table 4. Correlation coefficients between household characteristics and household water consumption.
Three different models for calculating household water consumption were developed using demographic (Model 1), physical (Model 2) and combined demographic and physical characteristics (Model 3) as shown in . These models were statistically significant (at p < 0.05). The performance of these models was evaluated by plotting the collected household water consumption data against the predicted values by the three models. The investigated households based on demographic characteristics, physical characteristics and both demographic and physical characteristics are presented in , respectively. shows that the trend lines of the household water consumptions obtained from the calibration data are almost identical to those of the testing data for the three models. However, Model 3 was found to have the highest R2 values indicating the improvement in the model performance when both demographic and physical characteristics were incorporated.
Figure 10. Relationship between actual and predicted daily per capita water consumption using STEPWISE method.
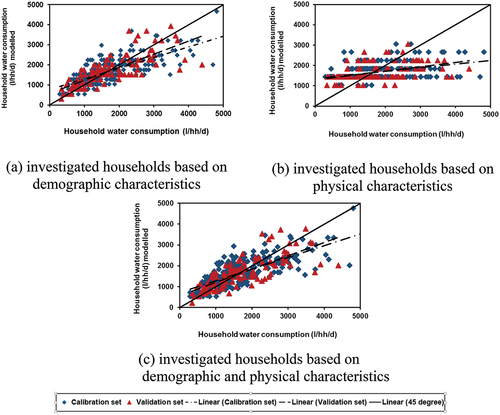
Table 5. Models and coefficients of determination (R2) using multiple linear regression method (STEPWISE).
The three models developed in STEPWISE were compared using R2 values (). The R2 values suggest that the demographic characteristics have a relatively strong influence on household water consumption and improve the accuracy of the model and eliminating household physical characteristics are unlikely to influence the model predictions radically. This is an important inference suggesting that any future studies may mainly focus on investigating user behaviour and associated influencing factors and the role of physical household characteristics is broadly insignificant.
Table 6. Coefficients of determination (R2) of the final regression model.
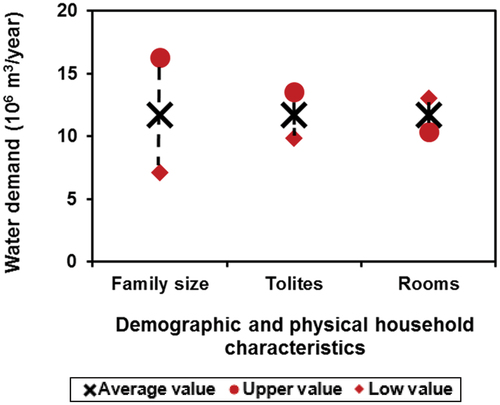
The study also investigated the sensitivity of the developed models. All input parameters were tested using three values (i.e. average, average + standard deviation and average – standard deviation). The average and standard deviation statistics (, appendix B) were used to calculate the low and high values of each household characteristic. The calculated upper and lower values of each household characteristic were used with the STEPWISE developed models to estimate the annual total water demand for households in Sirte city as shown in . The figure shows that the developed models are very sensitive to the family size.
Figure 11. Sensitivity analysis of input parameters for STEPWISE based domestic water demand prediction models for Sirte city.
4. Limitations
The study faced some significant limitations which might affect the accuracy of the determined average per capita water consumption. The first limitation is that there are no available previous research studies on the study area in terms of water consumption and diurnal patterns for end uses to develop confident comparisons. Secondly, due to the massive loss of documents in 2011 as a result of the war, there is no social-economic data for households characteristics in Sirte city. Therefore, there is no existing information in the city that can be compared with the finding of this study. Thirdly, because of missing meters to measure the duration and flow rates of water consumption, the study developed a method to collect data. However, the accuracy of the flow rates and durations could not be validated by measured data. The end-use water consumption data are a result of a questionnaire, so they may be dependent on the ability and sensitivity of subject in measuring and /or replying.
5. Conclusion
The paper studied the domestic water consumption at the end-use level in Sirte city, Libya. The effect of household characteristics (demographic and socio-economic) on per capita water consumption was investigated using a comprehensive questionnaire survey. The collected data was analysed using IBN SPSS Statistics software package Version 25 to obtain daily per capita water consumption of each end-use as a function of household characteristics. The average daily water consumption was calculated as a function of the frequency of water use, duration of running water from taps and flow rate of water for all end-uses. The study obtained the 24 hours time pattern for all end-uses. The multiple linear regression (STEPWISE) technique was used to develop regression models from which the best fit model was selected which can be used to predict future per household water consumption.
The results revealed that the average daily per capita water consumption is 255 l/p/d for the winter season. The number of toilets for households in the study area is high compared with other developing countries. It ranged between 1 and 6 toilets depending on the type and size of the house. The same situation exists for the kitchens. Some houses have more than one kitchen. The increase in the number of toilets and kitchens leads to increased water consumption and has a strong positive correlation coefficient. In addition, the results indicated that there is a strong positive correlation between household water consumption and household occupancy, total household built-up area, number of children, adult males and females, elders. However, there is no correlation between per capita water consumption and the total household income because the water is free. The result showed that the frequency and duration of hand wash basin tap use are much higher than the case is in developed countries. This could be because of additional water use activities (e.g. ablution) via the hand wash basin tap.
In terms of the diurnal water consumption profile, the results indicated that the time patterns for all end uses have multiple peaks which are significantly different from typical profiles for the developed countries reported in the literature. For the statistical models, the analysis revealed that the demographic characteristics provide more accurate predictions of per household water consumption than the predictions resulting from the use of physical characteristics of the investigated households.
The study findings provide information that can be used to improve water demand forecasts and management. Moreover, the information will be useful to those designing and operating water supply and sewer systems. Specifically, the data collected and analysed (average water consumption and diurnal patterns) will serve as input to software tools such as EPANET and Stormwater Management Model (SWMM) for analysing the water supply and sewer systems respectively.
The high household water consumption was found to be a result of the long duration of running water for particular end-uses. This provides the basis for developing policies and programs aimed at creating awareness and improving water consumption behaviour. These will help to increase the adoption of techniques such as rainwater harvesting and greywater reuse for non-potable water uses. These have the potential not only to reduce household water consumption but also sewer systems flooding.
Acknowledgements
The funding for this research has been provided by the Ministry of Higher Education and Scientific Research in Libya which is thankfully acknowledged.
Disclosure statement
No potential conflict of interest was reported by the author(s).
Notes
1 £1 = 1.89 LYD
References
- Abdelrhem, I.M., K. Raschid, and A. Ismail. 2008. “Integrated Groundwater Management for Great man-made River Project in Libya.” Eur. J. Sci. Res 22 (4): 562–569.
- Abderrahman, W. A. 2000. “Urban Water Management in Developing Arid Countries.” International Journal of Water Resources Development 16 (1): 7–20. doi:10.1080/07900620048536.
- Abufayed, A. A., and M.K.A. El-Ghuel. 2001. “Desalination Process Applications in Libya.” Desalination 138 (1–3): 47–53. doi:10.1016/S0011-9164(01)00243-0.
- Al-Rashed, M.F., and M. M. Sherif. 2000. “Water Resources in the GCC Countries: An Overview.” Water Resources Management 14 (1): 59–75. doi:10.1023/A:1008127027743.
- Arnell, N. W. 2004. “Climate Change and Global Water Resources: SRES Emissions and socio-economic Scenarios.” Global Environmental Change 14 (1): 31–52. doi:10.1016/j.gloenvcha.2003.10.006.
- Athuraliya, A, P Roberts, and A Brown. 2012. Residential Water Use Study Volume 2-Summer 2012. Melbourne: Yarra Valley Water.
- Beal, C. D., R. A. Stewart, and K. Fielding. 2013. “A Novel Mixed Method Smart Metering Approach to Reconciling Differences between Perceived and Actual Residential End Use Water Consumption.” Journal of Cleaner Production 60: 116–128. doi:10.1016/j.jclepro.2011.09.007.
- Beal, C.D., and R.A. Stewart. 2014. “Identifying Residential Water End Uses Underpinning Peak Day and Peak Hour Demand.” Journal of Water Resources Planning and Management 140 (7): 04014008. doi:10.1061/(ASCE)WR.1943-5452.0000357.
- Bhatti, A. M., and S. Nasu. 2010. “Domestic Water Demand Forecasting And Management Under Changing Socio: Economic Senario.” Society for Social Management Systems (SSMS-2010) 6 (1): 1–8.
- Bindra, S. P., S. Abulifa, A. Hamid, H.S. Al Reiani, and H. K. Abdalla. 2013. “Assessment of Impacts on Ground Water Resources in Libya and Vulnerability to Climate Change.” Scientific Bulletin of The” Petru Maior” University of Targu Mures 10 (2): 63.
- Blokker, JME, JGH Vreeburg, and JC Van Dijk. 2010. “Simulating Residential Water Demand with Stochastic end-use Model.” Journal of Water Resources Planning and Management 136 (1): 19–26. doi:10.1061/(ASCE)WR.1943-5452.0000002.
- Butler, D., and W. John. 2004. Urban Drainage. 2nd ed. London and New York: Taylor & Francis Group.
- Cavanagh, S., W.M. Hanemann, and R.N Stavins. 2002. “Muffled Price Signals: Household Water Demand under increasing-block Prices.” Available at SSRN 317924 40: 1–45.
- Cevik, A. 2007. “Unified Formulation for Web Crippling Strength of cold-formed Steel Sheeting Using Stepwise Regression.” Journal of Constructional Steel Research 63 (10): 1305–1316. doi:10.1016/j.jcsr.2007.01.001.
- Davies, K., C. Doolan, R. van den Honert, and R. Shi. 2014. “Water‐saving Impacts of Smart Meter Technology: An Empirical 5 Year, Whole‐of‐community Study in Sydney, Australia.” Water Resources Research 50 (9): 7348–7358. doi:10.1002/2014WR015812.
- Domene, E., and D. Saurí. 2006. “Urbanisation and Water Consumption: Influencing Factors in the Metropolitan Region of Barcelona.” Urban Studies 43 (9): 1605–1623. doi:10.1080/00420980600749969.
- Duarte, R., V. Pinilla, and A. Serrano. 2013. “Is There an Environmental Kuznets Curve for Water Use? A Panel Smooth Transition Regression Approach.” Economic Modelling 31: 518–527. doi:10.1016/j.econmod.2012.12.010.
- Edwards, K., and L. Martin. 1995. “A Methodology for Surveying Domestic Water Consumption.” Water and Environment Journal 9 (5): 477–488. doi:10.1111/j.1747-6593.1995.tb01486.x.
- Estrela, T, Dimas Menéndezm, M Leonard, Ovesen INB J, NJ Fehér, and V Consult. 2001. Sustainable Water Use in Europe. Denmark: Office for Official Publications of the European Communities.
- Gato, S (2006) “Forecasting Urban Residential Water Demand.” PhD thesis, RMIT University
- GMRWUA. 2005. “Great Man-Made River Water Utilization Authority Report.”
- GMRWUA. 2006. “Great Man-Made River Water Utilization Authority Report.”
- Gregory, G. D., and M. D. Leo. 2003. “Repeated Behavior and Environmental Psychology: The Role of Personal Involvement and Habit Formation in Explaining Water Consumption 1.” Journal of Applied Social Psychology 33 (6): 1261–1296. doi:10.1111/j.1559-1816.2003.tb01949.x.
- Hussien, W. A., F. A. Memon, and D. A. Savic. 2016. “Assessing and Modelling the Influence of Household Characteristics on per Capita Water Consumption.” Water Resources Management 30 (9): 2931–2955. doi:10.1007/s11269-016-1314-x.
- Ibrahim, A, S., F.A Memon, and D. Butler. 2021. “Seasonal Variation of Rainy and Dry Season per Capita Water Consumption in Freetown City Sierra Leone.” Water 13 (4): 499. doi:10.3390/w13040499.
- Jorge, C., P. Vieira, M. Rebelo, and D. Covas. 2015. “Assessment of Water Use Efficiency in the Household Using Cluster Analysis.” Procedia Engineering 119: 820–827. doi:10.1016/j.proeng.2015.08.945.
- Kenney, D. S., C. Goemans, R. Klein, J. Lowrey, and K. Reidy. 2008. “Residential Water Demand Management: Lessons from Aurora, Colorado.” JAWRA Journal of the American Water Resources Association 44 (1): 192–207. doi:10.1111/j.1752-1688.2007.00147.x.
- Larson, B, B Minten, and R Razafindralambo. 2006. “Unravelling the Linkages between the Millennium Development Goals for Poverty, Education, Access to Water and Household Water Use in Developing Countries: Evidence from Madagascar.” Journal of Development Studies 42 (1): 22–40. doi:10.1080/00220380500356258.
- Lee, D. J., N. S. Park, and W. Jeong. 2012. “End‐use Analysis of Household Water by Metering: The Case Study in Korea.” Water and Environment Journal 26 (4): 455–464. doi:10.1111/j.1747-6593.2011.00304.x.
- Loh, M., and P. Coghlan. 2003. “Domestic Water Use Study in Perth.” In Western Australia, 1998–2001. Perth: Water Corporation.
- Madanat, S, and F Humplick. 1993. “A Model of Household Choice of Water Supply Systems in Developing Countries.” Water Resources Research 29 (5): 1353–1358. doi:10.1029/93WR00126.
- Marinoski, A, A Vieira, A Silva, and E Ghisi. 2014. “Water end-uses in low-income Houses in Southern Brazil.” Water 6 (7): 1985–1999. doi:10.3390/w6071985.
- Mayer, Peter W., William B. DeOreo, Eva M. Opitz, Jack C. Kiefer, William Y. Davis, Benedykt Dziegielewski, and John Olaf Nelson. 1999.“
- McKenzie, H.S., B.O. Elsaleh, and PARKMAN. 1994. “The Libyan Great MAN-MADE River Project.” PAPER 1. PROJECT OVERVIEW.(WINNER OF 1995 PARKMAN MEDAL). Proceedings OF the Institution OF Civil Engineers-Water Maritime and Energy 106 (2): 103–122.
- Mu, X, D Whittington, and J Briscoe. 1990. “Modeling Village Water Demand Behavior: A Discrete Choice Approach.” Water Resources Research 26 (4): 521–529. doi:10.1029/WR026i004p00521.
- Nasar, M.N. 2015. “Survey of Sustainable Development to Make Great Man-Made River Producing Energy and Food.” Current World Environment 10 (3): 758–763. doi:10.12944/CWE.10.3.05.
- Nauges, C., and D. Whittington. 2009. “Estimation of Water Demand in Developing Countries: An Overview.” The World Bank Research Observer 25 (2): 263–294. doi:10.1093/wbro/lkp016.
- OFWAT. 1997. International Comparison of the Demand for Water: A Comparison of the Demand for Water in Three European Countries: England and Wales, France and Germany. UK: WRc.
- PCSC, 2003. “Planning Committee of Sirte City Report.”
- Pim, R.H., and A. Binsariti. 1994. “The Libyan Great MAN-MADE River Project. Paper 2. The Water Resource.” Proceedings of the Institution of Civil Engineers-Water Maritime and Energy 106 (2): 123–145. doi:10.1680/iwtme.1994.26389.
- Roberts, P. 2005. Yarra Valley Water: 2004 Residential end-use Measurement Study. Melbourne: Yarra Valley Water.
- Simukonda, K., R. Farmani, and D. Butler. 2018. “Intermittent Water Supply Systems: Causal Factors, Problems and Solution Options.” Urban Water Journal 15 (5): 488–500. doi:10.1080/1573062X.2018.1483522.
- Slavíková, L., V. Malý, M. Rost, L. Petružela, and O. Vojáček. 2013. “Impacts of Climate Variables on Residential Water Consumption in the Czech Republic.” Water Resources Management 27 (2, January 1): 365–379. doi:10.1007/s11269-012-0191-1.
- SMP., (2018) “Sirte Ministry of Planning Report.”
- Syme, G. J., Po. M. ShaoQ, and E. Campbell. 2004. “Predicting and Understanding Home Garden Water Use.” Landscape and Urban Planning 68 (1): 121–128. doi:10.1016/j.landurbplan.2003.08.002.
- Willis, R.M., R.A. Stewart, D.P. Giurco, M.R. Talebpour, and A. Mousavinejad. 2013. “End Use Water Consumption in Households: Impact of socio-demographic Factors and Efficient Devices.” Journal of Cleaner Production 60: 107–115. doi:10.1016/j.jclepro.2011.08.006.
- World Health Organization WHO, UNICEF. (2019) “Water Supply, sanitation and Hygiene Monitoring.” https://www.who.int/water_sanitation_health/monitoring/
- WWCI. (2019). “World Weather and Climate Information.” https://weather-and-climate.com/average-monthly-Rainfall-Temperature-Sunshine,Sirte,Libya
- Yasar, A., M. Bilgili, and E. Simsek. 2012. “Water Demand Forecasting Based on Stepwise Multiple Nonlinear Regression Analysis.” Arabian Journal for Science and Engineering 37 (8): 2333–2341. doi:10.1007/s13369-012-0309-z.
APPENDIX A:
Household Water Consumption Survey Sirte, Libya (winter season)
This survey is carried out as a part of a research project to collect and analyse the information on water use patterns in the residential areas of Sirte.
The information provided by you will be used anonymously and solely for educational and research purposes.
This survey will not take more than Thirty minutes. Please tick the relevant box.
Participant ………………………Area and Street …………………………Date ………………………
Demographic characteristics of household:
Socio–economic characteristics of the household
1) Bath
2) Shower
3) Bathroom sink (Tooth brush, hand and face washing, ablution, ets.)
4) Toilet
5) Dishwashing
6) Laundry
7) Garden watering
8) Drinking and Cooking
.9) House washing
10) Other water consumption
Appendix B:
Summary of survey results
Table B1 Summary of household (hh) characteristics in Sirte, Libya.
Table B2 Summary of water end–uses parameters for surveyed households (380 households).