
ABSTRACT
The need to develop sustainable stormwater management is intensifying due to climate impacts and urban densification. Such complex planning processes require insights into disparate issues, connecting heterogeneous actors. While many decision-support tools are developed to facilitate such planning, research assessing their usefulness is requested. This study introduces and assesses one such ICT-tool; the Visual Water platform, aiming to support sustainable stormwater planning in Swedish municipalities. The study aims to identify critical points to consider for developers of related decision-support tools and to detangle requirements and tradeoffs in making them relevant and user-friendly, building on test-sessions with Swedish practitioners. Results show that the platform responds to challenges within municipal planning as outlined by Swedish practitioners. However, though the platform content is considered relevant, its application in real-world planning is perceived as somewhat unclear. The paper discusses ideas for how sustainability-related decision-support tools better can respond to user demands.
1. Introduction
Climate change, urbanization and land-use changes pose major challenges to building resilient cities. As a response, municipalities around the globe plan for sustainable stormwater management systems to e.g. improve stormwater treatment, reduce flood risks, and create attractive urban environments (Wu, Wu, and Zhang Citation2019). This does not only pose technical challenges, but requires great efforts in e.g. developing new collaborations, improving planning processes, gathering relevant information and carrying out complex analyses (Bohman, Glaas, and Karlson Citation2020; Onori, Lavau, and Fletcher Citation2018), not least for smaller and less resourceful municipalities.
Various decision-support systems/tools and visual representations featuring e.g. trends, risks and possible responses are being developed to facilitate, amongst others, sustainable stormwater planning. These have different focus, forms and target groups, but often aim to support decision-making and learning using various ICT-software solutions (e.g. Metze Citation2020; Goudine, Newell, and Bone Citation2020; Lovett et al. Citation2015). To make such tools relevant, applicable and user friendly, evaluations of how they are perceived by potential end-users can provide valuable inputs for their development, and contribute more generally to understanding the role and potential of climate services and/or decision support systems (Glaas et al. Citation2017; Daniels et al. Citation2020; Findlater et al. Citation2021).
The big proportion of decision-support tools/systems on sustainable stormwater management aim to support analyses of e.g. risks for water pollution and/or urban flooding, feasibility of green, blue or gray infrastructure; and/or capacity of local stormwater systems. Recently presented examples include a methodology using a multi objective optimization technique to incorporate sustainable drainage systems in urban areas (Uribe-Aguado et al. Citation2022); the planning support system Extreme Weather Layer aiming to support e.g. the identification and management of pluvial flood risks (Truu et al. Citation2021); the SSANTO planning-support tool for spatial suitability assessment of green stormwater infrastructure (Kuller et al. Citation2019) and; the integrated decision-support Tool i-DSTss aiming to support the selection and sizing of stormwater best management practices (Shojaeizadeh et al. Citation2019). Such tools fill important roles and has advanced significantly, often targeting experts on stormwater management in e.g. water utilities, technical consultants or certain categories of municipal planners to conduct and present better local analyses.
However, many challenges identified in municipal stormwater planning do not only relate to analytical abilities and lack of sufficient data/analyses. Authors have argued that a proportion of climate services/decision-support systems aim to provide better data which in itself does not necessarily generate better decisions (Findlater et al. Citation2021). As outlined in section 2.1 below, other challenges in municipal stormwater planning involving a wide array of professions and actors are also important to address in decision-support tools/systems, such as: the collaboration across municipal administrations; unclear responsibility divisions; ambiguous legislation on environmental management and urban planning; dialogues with property owners or developers; and sharing of experiences across municipalities. Fewer tools aim to support above challenges in municipal planning and collaboration processes, which the below platform address.
This study introduces and assesses the perceived utility of the co-developed web-platform Visual Water (http://visualwater.se), which aims to support sustainable municipal stormwater planning in Sweden by targeting identified challenges in municipal planning and collaboration processes. The objectives of the study are primarily to: 1) identify critical points to consider for developers of sustainable stormwater-related ICT tools, and 2) detangle requirements and tradeoffs to make such tools relevant, applicable and user friendly for intended users. The assessment departed from criteria for assessing sustainability-related ICT tools, compiled into an applied assessment framework. Empirically, the assessment builds on transcripts from six test-sessions, assembling a heterogeneous mix of Swedish practitioners (n = 27), conducted during the summer and fall 2020.
2. Theoretical departures
2.1. Municipal sustainable stormwater planning challenges and needs
Within the rapidly increasing international literature on sustainable stormwater planning, some challenges and needs are recurrent, and clearly overlap with results from related Swedish studies. Four distilled challenge areas that have informed the Visual Water platform’s main entries are presented in below.
A first identified challenge is switching to a catchment area perspective when analyzing and visualizing the preconditions for sustainable stormwater management. Such analyses require down-scaled data on different factors such as climate change effects, nutrient emissions and the status of waterbodies (National Academies of Sciences, Engineering, and Medicine Citation2017). They should further showcase both direct needs of water management such as flood control and emission mitigation, as well as indirect needs, such as ecosystem services in a way that is easy to grasp also for non-experts (BenDor et al. Citation2018; Sörensen et al. Citation2016). This challenge has informed the platform’s first entry (see section 3.1).
A second challenge is to create a suitable organization as well as internal collaboration between municipal departments and companies in the planning of sustainable stormwater systems. More holistic water planning challenge established responsibility divisions and often demand new organizational structures, more integrated planning processes and new forms of cross-departmental collaborations (Trapp, Kerber, and Schramm Citation2017; Schramm et al. Citation2018). Recommended ways forward include clarifying the importance of stormwater for urban development, to raise stormwater issues earlier in planning, and to allocate resources for joint projects (Cettner et al. Citation2013; Bohman, Glaas, and Karlson Citation2020). This challenge has informed the platform’s second entry (see section 3.2).
A third challenge is to establish cooperation with stakeholders outside the municipal organization. Attempts at involving stakeholders in the planning of sustainable stormwater systems are however sometimes obstructed by e.g. communication barriers, goal conflicts, and lack of incentives (Skrydstrup et al. Citation2020; Bohman, Glaas, and Karlson Citation2020). Identified conditions for fruitful cooperation include well organized processes (Onori, Lavau, and Fletcher Citation2018), less technical ways of discussing stormwater issues (Dean et al. Citation2018), development of incentive structures to motivate participation (Buurman et al. Citation2021), and shared system knowledge (Megdal, Eden, and Shamir Citation2017). This challenge has informed the platform’s third entry (see section 3.3).
A fourth challenge is to support collaborative learning. Previous research (e.g. van Herk et al. Citation2011) shows how municipalities in early transition processes towards collaborative water planning can benefit greatly by new networks and innovative demonstration projects. Though previous experiences of others cannot be copied, these can act as inspiration and ground for collaborative learning (Pahl-Wostl et al. Citation2007), and provide contacts to actors with similar challenges. This challenge has informed the platform’s fourth entry (see section 3.4).
2.2. Assessment framework
The assessment of the Visual Water platform is inspired by the analysis themes presented by Beery (Citation2018), i.e. Rationale, Audience, Content and Format, identified during the development of a tool targeting sustainable stormwater management intended for private homeowners. The themes, in turn, include several sub-themes, which in the analysis have been used as assessment criteria. These criteria were complemented with further criteria from studies on similar topics, compiled into an assessment framework matching the aims and intended end-users of the Visual Water platform. The framework, including explanations of the included assessment criteria, are found in .
Table 1. Assessment framework: criteria for assessing ICT tools. Inspired by Beery (Citation2018).
Rationale deals with the question why, i.e. the extent to which the objectives of the platform are seen to make sense and are clearly stated (Beery Citation2018). To assess the rationale of a tool, assessment criteria should be clearly linked to the tool´s main aims. Three criteria for assessing the rationale – matching the aims of the Visual Water platform (see section 3) – were applied; Assemble information (Babelon, Ståhle, and Balfors Citation2017), Strengthen adaptive capacity (Glaas et al. Citation2020), and create a Forum for dialog (Bohman et al. Citation2015).
Audience deals with the question who, i.e. the extent to which the platform is considered to be adapted to the intended end-users (Beery Citation2018). Three assessment criteria were applied; Accessibility (Goudine, Newell, and Bone Citation2020), Prior knowledge (Harold et al. Citation2016; Barclay and Klotz Citation2019), and Terminology (Beery Citation2018).
Content deals with the question what, i.e. the extent to which the platform is considered to include appropriate information and functions (Beery Citation2018). Four criteria were applied; Relevance (Beery Citation2018), Localization (Barclay and Klotz Citation2019), Interactivity (Lovett et al. Citation2015; Harold et al. Citation2016), and Reliability and trust (Goudine, Newell, and Bone Citation2020).
Format deals with the question how, i.e. the extent to which the platform is considered user friendly (Beery Citation2018). Two criteria were applied; Visual clarity (Harold et al. Citation2016), and Functional clarity (Glaas et al. Citation2020).
3. The Visual Water platform
The Visual Water platform was designed to support Swedish municipalities in the planning for sustainable stormwater management, rather than supporting the development of better data/analyses for planning, as have been the focus of many related decision-support tools (e.g. Uribe-Aguado et al. Citation2022; Truu et al. Citation2021; Kuller et al. Citation2019; Shojaeizadeh et al. Citation2019). The work has resulted in a platform with four main entries. The target group were all Swedish municipalities, but small and medium-sized municipalities were expected to benefit from most parts, while larger municipalities were expected to benefit from only certain parts, as described below. A description of all platform entries is described in sub-section 3.1-3.4.
The first entry aims to support simplified analyses of stormwater-related risks (e.g. for pollution spread and flooding) and needs for ecosystem services (e.g. heat and noise regulation, biodiversity and recreation) on sub-catchment scale. This was intended to target municipalities that have not yet bought tools for or accomplished such analyses, i.e. predominantly small and medium sized municipalities. However, regardless if previously done or completed using the provided guide, results of such analyses can be visualized in the platform. To pedagogically visualise the main features of such analyses for non-experts were expressed as vital for improved planning by municipal representatives during the platform development (see Bohman, Glaas, and Karlson Citation2020; Bohman et al. Citation2021), and are highlighted in previous research (Sörensen et al. Citation2016).
Entrance two to four in the platform is intended to support cross-sectoral and cross-actor planning, dialogues and leraning for sustainable stormwater management. In contrast to the analyses supported by the first entry, the discussions with municipal representatives during the development of the platform (see Bohman, Glaas, and Karlson Citation2020; Bohman et al. Citation2021) indicated that these aspects are problematic regardless of the size and previous experiences of municipalities. The target group for this type of support was thus expected to be broader.
The development work has been carried out by researchers at Linköping University and the Swedish Meteorological and Hydrological Institute (SMHI), informed by e.g. interviews and recurrent workshops with Swedish practitioners (see section 4.1).
3.1. Entry 1: risks and needs analysis
Entry one aims to support local analyses and visualizations of stormwater-related risks and needs on a sub-catchment scale. The results of such analyses are intended to facilitate cross-sectoral planning related to e.g. strategic reservation of land, selection and placement of sustainable stormwater measures, and as a foundation for external collaborations. The entry consists of three main functions, introduced via a slideshow ()).
Figure 1. Overview of entry 1.
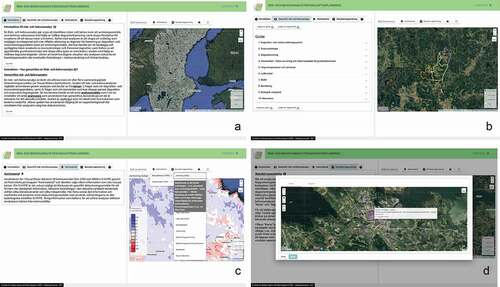
The first function is a guide, leading users through the various steps of a risk and needs analysis in a selected sub-catchment area. The guide takes into account various preconditions, risks and ecosystem services () left). The main inflow and outflow for the selected sub-catchment area is marked in the map interface () right).
The second function provides data supporting above analyses ()). This includes comprehensive assessment of the ecological, quantitative, and chemical status of all Swedish major lakes, rivers, groundwater and coastal waters, streamed from Water Information System Sweden (WISS), as well as climate data developed by SMHI for the Visual Water platform. Specifically, new runs of the S-HYPE model (Olsson et al. Citation2016) present, in greater detail than before, anticipated changes over time in Sweden’s approximately 40,000 sub-catchment areas, including climate effects. The S-HYPE model does not include representations of drainage systems, but instead provides projections of future conditions that needs to be managed, such as surface runoff, waterflow in streams and lakes, groundwater levels and precipitation. The user also has access to basic data on land cover and soil types in the sub-catchments that forms the boundary conditions in the S-HYPE model. The simulations have been done for three different time periods; 1971–2000, 2041–2070, and 2071–2100 and two greenhouse gas emission scenarios. Results are presented as an anticipated change (%) compared to the reference period (1971–2000) for 16 different variables, including several variants of surface runoff, waterflow, soil moisture, precipitation and groundwater levels.
The third function enables compilations of the results from a risk and needs analysis, conducted using above guide or already finished analyses. Results can either be documented in a reporting template or be visualized via a map-interface where objects can be drawn and commented for particularly important analysis results ()).
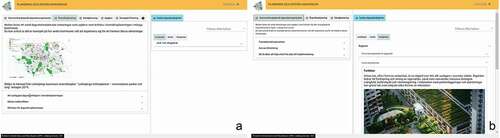
3.2. Entry 2: planning and internal collaboration
Entry two provides guidance and inspiration on how central planning challenges within collaborative stormwater management can be handled. The information on the left ()) is sorted according to key planning challenges related to organizational issues, comprehensive planning, detailed planning, building permits and strategic planning (as described by actors in the field), and includes references to central laws and regulations that affect these planning conditions. Under each planning challenge, the user can explore how other Swedish municipalities and actors handle the selected challenge by describing and linking to e.g. planning documents, principles and checklists. The user can also explore filmed interviews with, and contact information to, innovative forerunning actors. On the right-hand side ()), a large number of sustainable physical stormwater measures are presented and illustrated (see section 3.3 below).
Figure 2. Overview of entry 2.
3.3. Entry 3: dialog and external collaboration
Entry three supports dialog and collaboration between municipal and external actors, including e.g. developers, private landowners and farmers. In a first step the user selects a scale (landscape, city or property) which filter what information is shown ()). The scale regulates e.g. which actors that are listed, depending on where in the landscape stormwater projects are to be implemented. The entry consists of three main functions.
Figure 3. Overview of entry 3.
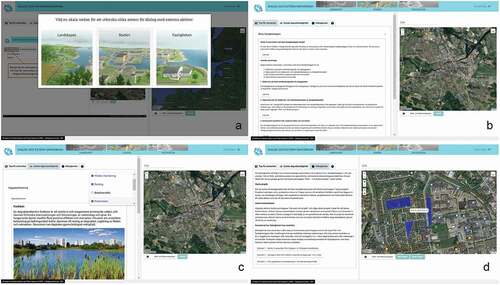
The first function includes recommendations on how municipalities can initiate and carry through collaborations with listed external actor categories. The recommendations are sorted under challenges that have been identified in the project, and include e.g. checklists, information materials and examples from other municipalities on how different situations can be handled ()).
The second function is a compilation of sustainable physical stormwater measures, sorted according to where in the landscape they are suitable to implement (e.g. on upstream agricultural land, at streets or parking lots, in parks, or in buildings). The measures can be filtered according to the needs they meet, including flow management, pollution treatment and various ecosystem services (e.g. biodiversity, recreation, and heat regulation). Measures that do not meet all selected requirements are removed ()).
The third function is the so-called ‘Dialog map’ ()) where projects can be started for e.g. an urban area, a district, or a development area where the initiator wants input from invited stakeholders. Spots can be marked on the map interface and commented by the person who starts the project as well as invited stakeholders. If a risk and needs analysis has been conducted in the selected area, it is shown on the map as a background for the dialog.
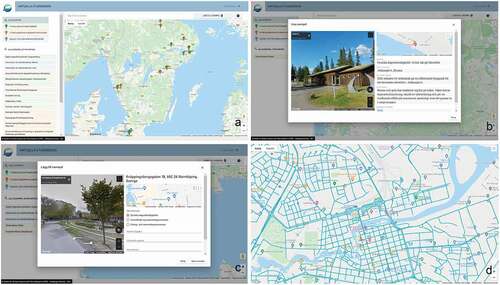
3.4. Entry 4: virtual study visits
The aim of entry four is to gather and disseminate experiences from Swedish actors on sustainable stormwater management. The examples are shown as ‘pins’ on the map view in three categories; Physical measures (green pin), New planning routines (orange pin), or Collaborative projects (blue pin) ()). By clicking on a pin, the user can learn about the aim and experiences, find related information, and get contact details to responsible actors for the provided example ()). Users can also add own examples by marking the location on the map, responding to questions ()) and selecting a Google Street View angle ()).
Figure 4. Overview of entry 4.
4. Methodology
4.1. Development of the Visual Water platform
To outline the four challenge areas for sustainable stormwater planning, which have informed the structure of the platform (section 2.1), scientific and grey literature was reviewed. Moreover, an initial questionnaire study (n = 116) as well as 15 project workshops and a series of individual interviews were conducted with Swedish practitioners representing e.g. municipal planning departments, water utilities, consultant firms, branch organizations, authorities and developers of other decision-support tools. These deliberations aimed to specify the challenges and needs in practical planning, to identify learning examples, checklists and data, and to test different prototypes of the platform. Input from the above has guided the design, content and learning examples in the platform (see Bohman et al. Citation2021, in Swedish).
4.2. Test sessions with potential end-users
To systematically collect feedback from potential end-users on the finalized version of the platform, six test sessions with actors who in different ways work with stormwater issues were conducted (). Twenty participants at the sessions were municipal representatives including planners, environmental and stormwater strategists and water utility representatives, who represent the target audience of the platform. To broaden the understanding of the platform’s possible usability and role in other municipalities, participants from national and regional organisations took part in the test sessions: three representatives from industry organizations and national and regional authorities who in their roles support municipalities in their work with stormwater issues; two representatives from large consulting firms working towards municipalities with stormwater issues; one representative from an insurance company and; one representative from a big construction company who continuously collaborate on stormwater issues with several Swedish municipalities.
Table 2. Conducted test-sessions and participants.
The sessions were held online through Zoom and lasted between 2–3 hours. All sessions had a similar structure. Each test session started with a quick presentation of the platform to ensure that all participants had seen the different entries and functions. After this, the participants were asked about their general impression of the platform and its potential role at their municipality or organization, before each entry was discussed in greater depth. The latter followed the structure of the assessment framework. Finally, questions related to the strengths and weaknesses of the platform were posed before rounding up. The sessions were recorded and transcribed verbatim. The material was coded and analyzed in accordance with the analytical framework.
5. Results and analysis
How a platform such as Visual Water is perceived obviously depends on individual preferences. However, as shown below, it also depends a lot on how the aim and content corresponds to ongoing stormwater planning in society, which many participants described as being in an early phase of transition without clear steering strategies in place. Generally, the platform’s role as an inspiration and knowledge bank was seen as the greatest strength by most participants, where the information presented was seen as having the potential to play an important role in a time when many municipalities struggle to find new ways to organize themselves. Learning from the experiences of others was considered as particularly important as ‘the rules of the game’ (including both formal law and established practices) in Sweden were perceived as unclear and open for negotiation. However, several challenges were also raised, such as reaching a diverse group of municipalities and actors with very different preconditions, needs and prior knowledge of stormwater issues.
Patterns in the perceptions on the assessment themes Rationale, Audience, Content and Format are described separately below. As highlighted by Beery (Citation2018), the assessment themes overlap. The assessment nevertheless provided a fairly vibrant picture of important requirements and tradeoffs that should be considered in the development of this type of tools. Quotes from the test-sessions have been translated to English by the authors and are used to exemplify common reasoning.
5.1. Rationale
5.1.1. Assemble information
Generally, participants agreed on the need to gather information on stormwater-related issues. As argued, significant amounts of information already exists, but are widely spread in various forums. Participants pointed to the platform’s ‘unifying function’ where the experiences of others facing similar challenges was considered of particular importance, yet difficult to overview, as exemplified:
During my whole career I have worked extensively with a lot of information about how other municipalities work, and I see everybody working individually and collecting information. And it would be really good if it can be collected into one common database that everyone has access to. (Test 6)
The above mainly refers to entry 4 ‘virtual study visits’ (section 3.4), which by many was seen as a good forum for sharing experiences.
Other included information that was considered as key to assemble, were overviews of sustainable stormwater measures and spatial data (e.g. water runoff, soil types and water pollution). Generally, such information was seen easy to incorporate into local planning processes. Information related to e.g. laws, regulation and divisions of responsibility was however considered more problematic. Although many participants inquired such information, they would prefer interpretations of e.g. laws and clear models for responsibility divisions among actor groups, rather than references to key legal text, as exemplified:
It´s difficult to ensure who is responsible. It would be good if you could sort out, what is the property owner’s own responsibility, to what extent should water utilities be responsible, and when should the municipality as a whole take responsibility. (Test 6)
Another frequently mentioned issue relates to a perceived lack of municipal-specific documents, such as conducted risk analyses, applictable policy documents and current detail plans that were identified as important to include to gather all relevant information at one place. The above places requirements on tool developers that cannot or perhaps should not be met (i.e. interpret laws or give advice on responsibilities), and also to store the right versions of locally specific documents for all Sweden’s 290 municipalities. This is further discussed in section six.
5.1.2. Strengthen adaptive capacity
Adaptive capacity was brought up foremost in relation to the support provided in the platform’s first entry ‘Risk and needs analysis’ (section 3.1). As argued, a thorough analysis that can create an overall depiction of risks and needs at an early stage is central to e.g. motivate reservation of land for stormwater management. The guide was also considered useful for strengthening customer competence in procurements of, for example, stormwater investigations, as exemplified:
If we can use this [the guide] to become a better purchaser and give a clearer message to the consultants what more precisely they need to look at, then it is of course useful. (Test 5)
Moreover, the platform was described as the embryo of a process management tool, seen as highly desired, due to the complexity of stormwater planning, requiring collaboration between many actors. However, as discussed in all user tests, it was not clear for many participants how the platform could be integrated into local planning processes, as exemplified:
If you already have an established way of working, it´s a little hard for me to understand how this [platform] should fit into that way of working. There are very good things and very good knowledge, but I do not see how this could be integrated. (Test 2)
To make it worth investing time to fully integrate the platform, several requirements for platform development were suggested. A frequently mentioned suggestions was to better match the platform with systems and tools used by municipalities today. In particular, more integration with municipality-specific data management systems was requested, or alternately that municipality-specific data can be uploaded into Visual Water, as exemplified:
I think it would be good if you could add municipality-specific data because it´s dissemination of information within a municipality that can sometimes be a bit problematic. (Test 1)
To meet the first requirement here, i.e. enable integration with specific and often self-developed data management systems in Sweden’s 290 municipalities, must be seen as almost impossible for a general platform such as Visual Water. The second, i.e. enable uploading municipality-specific data in the platform, can, however, be possible, but places great demands on e.g. data security and storage capacity. As discussed in two of the test sessions, it would also require that municipal representatives themselves regularly update the uploaded data, which several participants were skeptical to, as exemplified:
I think it will be very difficult for us to keep the information updated. I know how many documents we have … it´s enough making sure that our own pages are current. (Test 3)
5.1.3. Forum for dialog
As for the above aims, participants were generally positive also towards creating a forum for dialog with external actors, referring foremost to the ‘Dialog map’ in entry 3 (section 3.3). Presented examples of how this interactive function could be used in their municipality include collecting experiences from people affected by floods and gathering ideas from developers on attractive stormwater measures in an exploitation area. As argued, such processes demand collaboration with many actors, as exemplified:
There are extremely many actors who need to collaborate on stormwater issues and then this platform can be very helpful for everyone in order to have access the same system and to be able to discuss or comment on it. (Test 2)
Although many participants were positive towards using the dialog map, the decision who should start a project and invite others appeared problematic. This partly seemed to be due to difficulties in understanding how the function can be used, and partly due to the nature of stormwater issues, described by many as lacking a ‘natural owner’. To showcase how the dialog map can be used, presented hypothetical examples are included. To complement these, participants argued that new real examples continuously should be uploaded.
5.2. Audience
5.2.1. Accessibility
For the theme Audience, accessibility was the most frequently discussed criterion. Although many participants expressed that the tool included a large variety of useful content (section 5.3), many found it difficult to specify what actors are the primary users, while others had quite elaborative ideas about that, as exemplified:
Those who may benefit from the platform are people with a more overall role within the municipality such as a stormwater strategist or similar, to support their way of thinking and the workflow within the entire planning process. (Test 5)
Interpreting similar statements at most test-sessions, the uncertainty surrounding key users seems to be due to several reasons, including foremost; 1) unclear descriptions in the platform, 2) blurred and locally varying responsibility divisions in stormwater planning, and 3) actors unaccustomed to work with details in stormwater planning. Related to the first, participants requested more detailed information on how the platform can be used, e.g. instructional videos or texts. However, both such texts and information slides were implemented, which few users had noticed, indicating that clarity cannot only be solved with instructions, but that the design needs to be more intuitive. For the latter two, it appears as if many participants not working at a water utility, and especially in smaller municipalities, were unaccustomed with the technical and legal aspects of stormwater planning, and that their municipality or organization had not yet introduced any guidance or practice for these planning processes, making it hard to see where the platform fits.
5.2.2. Prior knowledge
The above results evidently refer also to the criterion of prior knowledge, but further aspects were highlighted. An aspect discussed in most test-sessions was that many participants, based on their background, felt that they had insufficient knowledge to understand all parts and functions of the platform. This came up particularly in relation to the geographical data presented in entry 1:
It´s a little difficult for those of us who don’t have the right background or education to interpret, what an increase of these many percentages means? In that case maybe you have to connect to someone with the right expertise. (Test 5)
This and similar reasoning highlight difficulties in developing support for processes involving actors from different professions and departments. The Visual Water development team, including involved practitioners, concluded that such a platform needs to include many aspects in the planning, and contain sufficiently detailed data such as modeled changes in water flow, to be used in practice. This does not mean that all actors involved in a process must understand all details, but that they should e.g. be familiar with the analysis made, understand what lies behind various decisions, and comprehend the requirements for public planning processes to get a better overview of the entire process chain, in order to facilitate collaboration between actors. However, the results of the test sessions indicated that individual users get frustrated when they do not understand all details, which might lead to the rejection of the platform.
5.2.3. Terminology
The simplicity to understand the terminology in the platform also clearly links to the criteria accessibility and previous knowledge. Participants interpreted some terms as somewhat ambiguous, opening up for different interpretations, and suggested changes. An example is the use of the term ‘ecosystem services’ which according to some participants is not understood in the same way within the various professions. Thus, suggestions of using different terms came up, as exemplified:
Instead of ecosystem services, call it nature-based services because then you get the part of biodiversity too. More and more people are discussing nature-based services since there are some more things included in this term. (Test 2)
The tests highlighted the need to discuss and adjust the terminology in a decision-support tool together with targeted user groups in order to make simple adjustments that can be of great importance for how it is understood and received.
5.3. Content
5.3.1. Relevance
Virtually all participants seemed to agree that the content of the platform was relevant for their work with stormwater-related issues, though the ‘packaging’ rendered some discussion. The content that was considered most relevant relates to sustainable stormwater measures, the organization of collaboration processes, management of common planning challenges, and previous examples of others, as exemplified:
We have started to think about financial incentives for property owners, and Malmö has great examples of that. Then it´s very nice that someone has a structured work that we can learn from. (Test 4)
Links to further information was also described as particularly useful, as exemplified:
I just want to comment that I think it was great with all the links around an issue. I actually had practical benefit of it in a project I am currently carrying out with property owners. I was looking for information that I read sometime, and then I found it here. Then I was happy. (Test 1)
However, many participants stated that there was too much text, while others at the same time wanted more information. This was a recurring feedback that highlights the difficulties of reaching many different users without making a tool too complex.
5.3.2. Localization
Input related to localization echoes much of the above. Many participants wanted more municipality-specific content such as e.g. local policy documents and conducted risk analyses. In other respects, the level of detail in the provided data was frequently discussed, where participants seem to have different views on how detailed versus general the tool should be, which in turn depended on who was seen as the primary users, as exemplified:
From a manager point of view, the platform should maybe be a bit more specific. We already have a lot of information and knowledge really, but there may be a need for a higher level of detail since there are large differences between municipalities geographically as well as regarding weather, climate, etc. (Test 3)
Statements as the above most often came from representatives from large municipalities, while representatives from smaller municipalities rather argued for the opposite. Representatives from small municipalities further wanted more learning examples from municipalities more similar to them. For example, a few participants reasoned that since small municipalities do not have the same resources, they are sometimes not able to implement such large-scale measures as frequently showcased. Therefore, they felt that they could learn more from municipalities that have made small-scale solutions, such as a single plant bed.
5.3.3. Interactivity
Discussions relating to interactivity frequently focused on the guide for conducting risk and needs analyses. A reason for this seems to be a general unfamiliarity among e.g. municipal planners to interpret this type of analyses in their profession, as exemplified:
All information here [in the guide] is very, well, descriptive. But if I, as a planner, was to jump into this tool, I would almost be a little bit overwhelmed by all the information that I have to process or handle. You may need more support in how to interpret everything. (Test 2)
However, described by several as positive for the interactivity was the ability to download the guide and the reporting template, seen aiding the analysis since a document can be printed and kept on the side to create a better overview, as exemplified:
I found it very good that you can download the whole chapter [the guide] as a PDF. It’s a good thing because it’s hard to get an overview when you jump in and out of such parts. (Test 4)
For the above, age seems to play a role as this was expressed mainly by older participants, even though the impact of age was not specifically assessed. For participants who were familiar with stormwater analyses, statements suggest that the guide can aid foremost smaller municipalities in conducting analyses that otherwise would have been procured by consultants, as exemplified:
I´m thinking in particular of us slightly smaller municipalities that often order these analyses, which results in large cost for us. To be able to make such an assessment at an early stage without feeling that we need to order it from a consultant every time would be great. (Test 5)
Other participants considered it as problematic that data for all steps of the analysis were not provided in the platform and must be incorporated from other sources.
5.3.4. Reliability and trust
No statements from the test-sessions indicate that any participant distrusts information or data in the platform, which may be due to the fact that it was developed by researchers at a university and a government agency together with practitioners with high confidence in society. However, several participants raised concerns with this type of open and freely available tools as they require constant development to be current and relevant, as exemplified:
My only fear is what happens when the project time is over? Because there is a lot that needs to be updated and kept going. (Test 3)
I think this is the beginning of something really good, but then the question arises; who will own the system? What does it look like in two years? (Test 6)
As discussed in section six, the concerns above are indeed valid and require reflection. Many decision-support tools that are developed will be discontinued when the project period ends, which several participants had experienced.
5.4. Format
5.4.1. Visual clarity
Most of what was considered visually unclear relates to the included climate and waterbody data. Though several participants described the benefit of including such data broken down to sub-catchment scale, they also presented difficulties of interpreting it. For example, many participants seemed confused about the time perspectives in climate modeling, had difficulty interpreting color representations, or did not fully understand the meaning of the parameters, as exemplified:
Just some input here, when I was looking around I thought that it was difficult to know what the colors mean. (Test 2)
I don´t really understand the time perspectives. A change between different time periods in the modelled data, what does that mean? (Test 3)
Based on the feedback as the above, e.g. new explanatory texts have been implemented. This can potentially solve some of the problems for users who are unaccustomed to work with this type of data, but who at the same time spend a lot of time to understand the content. Based on feedback from users, more pervading changes are needed to make the platform more user-friendly.
5.4.2. Functional clarity
As argued in all test-sessions, the overall structure of the platform with its four main entries was perceived as easy to grasp and made sense for the general way of working with stormwater issues. The various functions within these entries, on the other hand, were seen as more or less user-friendly. The function in the platform considered as most difficult to comprehend and use is the ‘dialog map’, even though the function was considered as relevant for the current challenges at hand. After discussing it, however, most participants expressed an understanding for how the function can be used, indicating that slightly better descriptions or instructional videos (as suggested) should make it more available to many. Nevertheless, the built-in interaction between the ‘risk and needs analysis’ and the ‘dialog map’ (i.e. that a completed and stored risk and needs analysis can be used as an information layer in the dialog map), does not appear to have been made clear for many participants. On the other hand, the participants who had observed this interaction saw it as highly relevant, as exemplified:
I think it was very good that if you have done your risk analysis, it follows and can also be presented in the map for dialogs. And that is important. Should an area become denser, we cannot accept that there will be an addition of stormwater to pipes, and then we can discuss solutions to avoid that. (Test 6)
Clarification of the connection and interaction between functions in the platform seems to require greater development efforts.
6. Discussion and conclusions
This study set out to introduce and assess the Visual Water platform, which aims to support sustainable stormwater planning in Swedish municipalities, to identify critical points to consider for developers of sustainability-related ICT tools, and to detangle requirements and tradeoffs in making such tools appear relevant and user friendly. Some general conclusions from the six conducted test-sessions with potential end-users can be drawn based on the four applied assessment themes and criteria.
6.1. Rationale
On a general level, the platform are in line with most participants’ expressed needs related to their work with sustainable stormwater planning. This was somehow expected as the platform has been developed in close collaboration with relevant stakeholder categories. However, several challenges, tradeoffs, and requirements were identified. In relation to gathering subject-relevant information and experiences, most notably, participants were positive towards the collection of experiences by others, but required that local information such as municipal policy documents, detail plans and already conducted risk analyses should be included in the platform. Keeping such information updated for all Sweden´s 290 municipalities would however be next to impossible in a nation-wide platform such as Visual Water. A related tradeoff is whether more general information still should be included or whether it risks creating frustration among users. An interpretation of the discussions suggests that general information that, in some way, is linked to practical management (although examples of how others have done or how they have interpreted e.g. laws) was considered valuable and could be one approach to ‘localizing information’ (c.f. Beery Citation2018), while other general information often takes up space and makes a tool unnecessarily complex.
In relation to empowerment, several opportunities with the platform were raised including e.g. its ability to strengthen individuals’ capacity to order relevant analyses from consultants, provide access to relevant information and increase the knowledge of stormwater planning. However, there was a demand for more integration with municipality-specific systems for handling data, or that such data can be uploaded in the platform, to better support collaborative processes. Here, a clear direction needs to be determined for the Visual Water platform (and likely for similar tools), namely whether to aim to strengthen individual users’ capacities and inspire joint process development, to support the management of joint processes (i.e. an integral tool for process management), or possibly strife to achieve both. Although these aims may well be possible to combine (which Visual Water was designed to do), the results of the test-sessions suggest that the latter would demand significant time investments in developments and communication to fully meet presented user demands, which has also been found in previous studies (e.g. Bohman et al. Citation2015), and would likely require a commercialization of the platform, which is often not within the remit of public authorities or universities.
Related to supporting dialogs with external actors, participants were generally positive to the function for map-based virtual dialogs (the ‘dialog map’), but saw it as unclear how and by whom it should be used, which makes the threshold high for new users. This highlights another tradeoff; namely how delimited a dialog forum should be to different applications. This challenge of creating a forum that is as open as possible, while at the same time clear about its possible use, has been a struggle for the development team behind Visual Water. Showcasing hypothetical examples of how the function could be used (as now tested) is a way forward, but should, as requested by the participants, be supplemented with real examples and instructional videos.
6.2. Audience
For the audience theme, accessibility was the most discussed criterion. The platform was perceived to include much relevant content, but many participants expressed uncertainty about its key users, referring to e.g., unclear platform descriptions, blurred responsibilities in municipal stormwater planning, and an unfamiliarity among several participants to work within all steps in stormwater planning processes. The above highlights difficulties to develop platforms for heterogeneous actor groups with such a mixed pre-understanding and local conditions. A question arising during the development is whether it would be favorable to create different entries to the platform for different actor categories. While this potentially could make it easier to adapt information and functions to different users’ roles and pre-understanding, it would imply a barrier to other functionalities, such as sharing information across actor categories. This strikes a discordant note with the challenges highlighted in previous research, which showcase a lack of collaboration on stormwater planning rather than a lack of knowledge per se (e.g. Schramm et al. Citation2018). Although clarifications to facilitate the understanding of which parts of the platform different actors can use can be implemented, this does not solve problems linked to unclear roles and responsibilities in municipal stormwater planning, which appears to be a key barrier for actors in using the platform. An assumption based on the results of the user test, however, is that the platform was launched at an early stage of the transition towards sustainable urban stormwater management in Sweden, and that the understanding and applicability of the platform may increase over time. This is supported by several participants from larger municipalities that already work actively with sustainable stormwater planning who seemed to recognize themselves and the tasks of their organization in the platform’s structure to a greater extent.
6.3. Content
Related to contents, a large share of participants agreed that the included information and functions are relevant, but that the platform is already overloaded with information and functions and probably would need to contain even more to be fully applicable, which makes the platform difficult to overview. This points to another challenge in the development of decision-support, namely to implement a fair amount of information, which preferably should also be easy to grasp, a balance that has been addressed in previous studies (e.g. Neset et al. Citation2019). This challenge becomes even more difficult if the target group is broad and issues are complex, as for Visual Water. The development team has continuously worked to simplify and reduce the amount of text, but more such work is required to increase its accessibility.
Related to reliability and trust, the participants did not express any doubts regarding the accuracy of the data or the presented planning challenges. Several participants, on the other hand, expressed concern about the platform’s survival after the project period. Some participants had themselves experienced that research-developed tools in similar areas rapidly becomes outdated as research funding often supports development but not maintenance. The development of Visual Water includes funding to keep the platform updated and functional for some years. However, the future is uncertain, and probably will require another actor to take over operations to ensure that the resources spent on the development of the platform will continue to provide societal benefits. Hence, this study support results by Findlater (et al. 2021) in that decision-support tools need to be institutionalized and supported by long-term operational funding. This also raises the question of whether a more overarching policy is needed to obtain and operationalize this type of decision-support tools.
6.4. Format
Related to the perceived user-friendliness, many participants that are unaccustomed to interpret climate data expressed that they were struggling with understanding some of the more complex contents and vocabulary in entry 1. Though clarifications, help-texts and a well thought out vocabulary can aid this understanding to some extent (c.f. Dean et al. Citation2018), it appears impossible to get all potential users among the large number of actors involved in municipal stormwater planning to fully understand all necessary details for such a complex area. This has raised questions among the development team if it would be possible to include two ways for presenting e.g. stormwater-related data. For example, one that in a simplified way describes trends that municipalities need to relate to, and one containing a more complete dataset for users who carry out analyses. This would require further analysis and development, but could be a way forward to make practitioners more familiar with all planning steps, which hopefully could aid collaboration through increased insights into the different areas of responsibility and practice in sustainable urban stormwater management.
Another barrier to fully comprehend the extensive content of the platform is the difficulty of getting an overview of how different functions are connected, i.e. the connection between risks and needs analyses visualized on the map interface in entry 1, and the possibility of using these as a basis for map-based virtual dialogs in entry 3. Here, schematic process descriptions showing connections between platform entries and functions were suggested for clarification.
6.5. Concluding remarks
The development and testing of the Visual Water platform has highlighted ways forward, but also challenges, to support municipal stormwater planning via ICT-based decision-support tools. The fact that the platform was developed to support experienced problems in current municipal planning processes, rather than the development of better analyses for planning, was appreciated by many test-session participants. This was arguably because many advanced tools for making analyses of e.g. urban flood risks already exist (SCALGO Live was mentioned as a good example by several participants) or are under development (e.g. Truu et al. Citation2021). The main problems raised were thus often not related to the platform’s aim or content, but rather to its complexity, which appear rooted in; 1) a continued unfamiliarity to collaborate with many actors across professions on complex stormwater issues, and 2) difficulties to overview all content and functions in the platform, which is a result of the fact that broad planning processes require a balancing of many different knowledge foundations, experiences and data. This showcase difficulties in developing a tool which, according to participating practitioners, should contain everything that is relevant to the planning (i.e. ‘a one stop shop’ tool), while at the same time being transparent. This supports results from other studies stating the need to develop several interconnected tools rather than a single one to support so-called knowledge-action systems (Weichselgartner and Arheimer Citation2019). Dividing the Visual Water platform into several interconnected tools might thus be an alternative to increase its transparency, but would however also risk not supporting collaborations and learning among heterogeneous actors as intended. This is a key challenge in the continued development of decision support tools for sustainable stormwater management, requiring further reflection.
Moreover, the development process and testing itself was found effective for gaining a better understanding of challenges and needs in municipal stormwater planning, which is consistent with findings in contemporary literature arguing that the development of visual outputs is a constructive way of conducting research with actors such as municipalities (c.f. Metze Citation2020). The study also echo calls for co-produced decision-support as effective for identifying how such tools could be designed to become useful and usable (Daniels et al. Citation2020; Vincent et al. Citation2018), but at the same time shows the difficulties with this as actors within the same organization may have very different views on their needs for support and how these should be designed. What further came out is the need to elaborate more on how tools such as the Visual Water platform can be taken over by other societal actors when the project period is over. This appears to be a key to making better use of the research and development funding that many countries invest in sustainability-related decision-support.
Disclosure statement
No potential conflict of interest was reported by the author(s).
Additional information
Funding
References
- Babelon, I., A. Ståhle, and B. Balfors. 2017. “Toward Cyborg PPGIS: Exploring socio-technical Requirements for the Use of web-based PPGIS in Two Municipal Planning Cases, Stockholm Region, Sweden.” Journal of Environmental Planning and Management 60 (8): 1366–1390. doi:10.1080/09640568.2016.1221798.
- Barclay, N., and L. Klotz. 2019. “Role of Community Participation for Green Stormwater Infrastructure Development.” Journal of Environmental Management 251 (1): 109620. doi:10.1016/j.jenvman.2019.109620.
- Beery, T. 2018. “Engaging the Private Homeowner: Linking Climate Change and Green Stormwater Infrastructure.” Sustainability 10 (12): 4791. doi:10.3390/su10124791.
- BenDor, T. K., V. Shandas, B. Miles, K. Belt, and L. Olander. 2018. “Ecosystem Services and U.S. Stormwater Planning: An Approach for Improving Urban Stormwater Decisions.” Environmental Science & Policy 88: 92–103. doi:10.1016/j.envsci.2018.06.006.
- Bohman, A., T-S. Neset, T. Opach, and J. K. Rød. 2015. “Decision Support for Adaptive Action: Assessing the Potential of Geographic Visualization.” Journal of Environmental Planning and Management 58 (12): 2193–2211. doi:10.1080/09640568.2014.973937.
- Bohman, A., E. Glaas, and M. Karlson. 2020. “Integrating Sustainable Stormwater Management in Urban Planning: Ways Forward Towards Institutional Change and Collaborative Action.” Water 12 (1): 203. doi:10.3390/w12010203.
- Bohman, A., E. Glaas, M. Karlsson, C. Navarra, J. Olsson, Y. Hundecha, T. Opach, et al. 2021. Visual Water: En visualiseringsplattform för dagvatten- och skyfallsplanering i ett klimat under förändring. Stockholm, Swedish: Svenskt Vatten. SVU-rapport 2021-4.
- Buurman, J. J. G., T. K. Lee, M. S. Iftekhar, and S. M. Yu. 2021. “Strategies to Promote the Adoption of Sustainable Drainage by Private Developers: A Case Study from Singapore.” Urban Water Journal 18 (1): 61–67. doi:10.1080/1573062X.2020.1850804.
- Cettner, A., A. Richard, M. Viklander, and K. Nilsson. 2013. “Stormwater Management and Urban Planning: Lessons from 40 Years of Innovation.” Journal of Environmental Planning and Management 56 (6): 786–801. doi:10.1080/09640568.2012.706216.
- Daniels, E., S. Bharwani, Å. Gerger Swartling, G. Vulturius, and K. Brandon. 2020. “Refocusing the Climate Services Lens: Introducing a Framework for co-designing “Transdisciplinary Knowledge Integration Processes” to Build Climate Resilience.” Climate Services 19: 100181. doi:10.1016/j.cliser.2020.100181.
- Dean, A. J., K. S. Fielding, E. Jamalludin, F. J. Newton, and H. Ross. 2018. “Communicating about Sustainable Urban Water Management: Community and Professional Perspectives on water-related Terminology.” Urban Water Journal 15 (4): 371–380. doi:10.1080/1573062X.2018.1483523.
- Findlater, K., S. Webber, M. Kandlikar, and S. Donner. 2021. “Climate Services Promise Better Decisions but Mainly Focus on Better Data.” Nature Climate Change 11 (9): 731–737. doi:10.1038/s41558-021-01125-3.
- Glaas, E., A. Gammelgaard Ballantyne, T-S. Neset, and B-O. Linnér. 2017. “Visualization for Supporting Individual Climate Change Adaptation Planning: Assessment of a web-based Tool.” Landscape and Urban Planning 158: 1–11. doi:10.1016/j.landurbplan.2016.09.018.
- Glaas, E., M. Hjerpe, M. Karlson, and T-S. Neset. 2020. “Visualization for Citizen Participation: User Perceptions on a Mainstreamed Online Participatory Tool and Its Usefulness for Climate Change Planning.” Sustainability 12 (2): 705. doi:10.3390/su1202070.
- Goudine, A., R. Newell, and C. Bone. 2020. “Seeing Climate Change: A Framework for Understanding Visualizations for Climate Adaptation.” ISPRS International Journal of Geo-Information 9 (11): 644. doi:10.3390/ijgi9110644.
- Harold, J., I. Lorenzoni, T. F. Shipley, and K. R. Coventry. 2016. “Cognitive and Psychological Science Insights to Improve Climate Change Data Visualization.” Nature Climate Change 6 (12): 1080–1089. doi:10.1038/NCLIMATE3162.
- Kuller, M., P. M. Bach, S. Roberts, D. Browne, and A. Deletic. 2019. “A planning-support Tool for Spatial Suitability Assessment of Green Urban Stormwater Infrastructure.” Science of the Total Environment 686: 856–868. doi:10.1016/j.scitotenv.2019.06.051.
- Lovett, A., A. K. Appleton, B. Warren-Kretzschmar, and C. Von Haaren. 2015. “Using 3D Visualization Methods in Landscape Planning: An Evaluation of Options and Practical Issues.” Landscape and Urban Planning 142: 85–94. doi:10.1016/J.LANDURBPLAN.2015.02.021.
- Megdal, S., S. Eden, and E. Shamir. 2017. “Water Governance, Stakeholder Engagement, and Sustainable Water Resources Management.” Water 9 (3): 190. doi:10.3390/w9030190.
- Metze, T. 2020. “Visualization in Environmental Policy and Planning: S Systematic Review and Research Agenda.” Journal of Environmental Policy and Planning 22 (5): 745–760. doi:10.1080/1523908X.2020.1798751.
- National Academies of Sciences, Engineering, and Medicine. 2017. A Watershed Approach to Mitigating Stormwater Impacts. Washington, DC: National Academies Press. doi:10.17226/24753.
- Neset, T-S., J. Wilk, C. Navarra, R. Capell, and A. Bartosova. 2019. “Visualization-supported Dialogues in the Baltic Sea Region.” Ambio 48 (11): 1314–1324. doi:10.1007/s13280-019-01250-6.
- Olsson, J., B. Arheimer, M. Borris, C. Donnelly, K. Foster, G. Nikulin, M. Persson, et al. 2016. “Hydrological Climate Change Impact Assessment at Small and Large Scales: Key Messages from Recent Progress in Sweden.” Climate 4 (3): 39. doi:10.3390/cli4030039.
- Onori, A., S. Lavau, and T. Fletcher. 2018. “Implementation as More than Installation: A Case Study of the Challenges in Implementing Green Infrastructure Projects in Two Australian Primary Schools.” Urban Water Journal 15 (9): 911–917. doi:10.1080/1573062X.2019.1574842.
- Pahl-Wostl, C., M. Craps, A. Dewulf, E. Mostert, D. Tabara, and T. Taillieu. 2007. “Social Learning and Water Resources Management.” Ecology and Society 12 (2): 5. doi:10.5751/ES-02037-120205.
- Schramm, E., H. Kerber, J. H. Trapp, M. Zimmermann, and M. Winker. 2018. “Novel Urban Water Systems in Germany: Governance Structures to Encourage Transformation.” Urban Water Journal 15 (6): 534–543. doi:10.1080/1573062X.2017.1293694.
- Shojaeizadeh, A., M. Geza, J. McCray, and T. S. Hogue. 2019. “Site-Scale Integrated Decision Support Tool (i-DSTss) for Stormwater Management.” Water 11 (10): 2022. doi:10.3390/w11102022.
- Skrydstrup, J., H. M. Madsen, R. Löwe, I. Bülow Gregersen, A. Nedergaard Pedersen, and K. Arnbjerg-Nielsen. 2020. “Incorporating Objectives of Stakeholders in Strategic Planning of Urban Water Management.” Urban Water Journal 17 (2): 87–99. doi:10.1080/1573062X.2020.1748204.
- Sörensen, J., A. Persson, C. Sternudd, H. Aspegren, J. Nilsson, J. Nordström, K Jönsson, et al. 2016. “Re-thinking Urban Flood Management: Time for a Regime Shift.” Water 8 (8): 332. doi:10.3390/w8080332.
- Trapp, J. H., H. Kerber, and E. Schramm. 2017. “Implementation and Diffusion of Innovative Water Infrastructures: Obstacles, Stakeholder Networks and Strategic Opportunities for Utilities.” Environmental Earth Sciences 76 (4): 154. doi:10.1007/s12665-017-6461-8.
- Truu, M., I. Annus, J. Roosimägi, N. Kändler, A. Vassiljev, and K. Kaur. 2021. “Integrated Decision Support System for Pluvial Flood-Resilient Spatial Planning in Urban Areas.” Water 13 (23): 3340. doi:10.3390/w13233340.
- Uribe-Aguado, J., S.L. Jiménez-Ariza, M.N. Torres, N.A. Bernal, M.M. Giraldo-González, and J.P. Rodríguez. 2022. “A SUDS Planning Decision Support Tool to Maximize Ecosystem Services.” Sustainability 14 (8): 4560. doi:10.3390/su14084560.
- van Herk, S., C. Zevenbergen, R. Ashley, and J. Rijke. 2011. “Learning and Action Alliances for the Integration of Flood Risk Management into Urban Planning: A New Framework from Empirical Evidence from the Netherlands.” Environmental Science and Policy 14 (5): 543–554. doi:10.1016/j.envsci.2011.04.006.
- Vincent, K., M. Daly, C. Scannell, and B. Leathes. 2018. “What Can Climate Services Learn from Theory and Practice of co-production?” Climate Services 12: 48–58. doi:10.1016/j.cliser.2018.11.001.
- Weichselgartner, J., and B. Arheimer. 2019. “Evolving Climate Services into Knowledge–Action Systems.” Weather, Climate, and Society 11 (2): 385–399. doi:10.1175/WCAS-D-18-0087.1.
- Wu, J., X. Wu, and J. Zhang. 2019. “Development Trend and Frontier of Stormwater Management (1980–2019): A Bibliometric Overview Based on CiteSpace.” Water 11 (9): 1908. doi:10.3390/w11091908.