
 ?Mathematical formulae have been encoded as MathML and are displayed in this HTML version using MathJax in order to improve their display. Uncheck the box to turn MathJax off. This feature requires Javascript. Click on a formula to zoom.
ABSTRACT
This paper presents a novel decision support framework for water utilities to automatically create yearly pipeline rehabilitation plans while considering multiple parameters, including pipeline physical properties and other factors like transportation and urban space. The average age of urban water pipelines is growing, and the annual rehabilitation volumes are often lower than needed to improve or even preserve the level of service quality. The existing rehabilitation strategies range from simple pipe-age-based approaches to complex multiparameter strategies. The needed input of specific and detailed data, which are usually not available for water utilities, impedes a straightforward implementation of the latter strategies. Therefore, this study presents a two-step pipe rehabilitation strategy that enables the utility to automatically prioritise the pipes and related street areas/sections based on condition ranking. The strategy was validated on an operational water network in Tallinn, Estonia.
Introduction
Many urban areas have entered an era where the average life span of pipelines laid down in the late 1800s to the 1950s is running out (e.g. AWWA Citation2001; Barton et al. Citation2019; Lee and Meehan Citation2017). Therefore, prioritising pipe rehabilitation actions, i.e. measures for restoring or upgrading the performance of existing pipeline systems, including renovation and replacement (EVS Citation2018), is paramount. Studies on optimal pipeline rehabilitation volumes (e.g. Folkman Citation2018; Malm et al. Citation2012; Scholten et al. Citation2014; Tscheikner-Gratl et al. Citation2016) indicate that to maintain or improve the service quality, the annual average reconstruction rate should be between 0.8 and 2.0% of the total length of the pipeline. In some cases (e.g. Folkman Citation2018), this is up to two times more than the utilities have invested in pipeline renewal in the last decades. The relative low investment level, combined with the evident urgency of the deteriorating infrastructure, clearly demonstrates that utilities need a comprehensive instrument for achieving optimal cost-effectiveness in assuring target service level with a well-founded risk estimate. Therefore, pipeline rehabilitation decisions need to be data-supported to increase their reliability and effectiveness and processes automated to facilitate the simple generation of alternative investment scenarios.
The most straightforward approach to estimate the need for pipe rehabilitation is based on its age. Similar to Tallinn, Estonia, in many urban areas in Europe, most of the pipelines were constructed after World War Two in a short period. Therefore, age-based rehabilitation strategies fail, as the fluctuations in the rehabilitation need over the years are very large. Earlier studies have indicated that pipe age should not be considered the only priority criterion (USEPA Citation2002), as pipe material, location, in terms of depth and soil properties, and installation practices are more important factors for predicting and preventing pipe bursts (O’Day Citation1987; Wengström Citation1993). This is supported by a study conducted in Athens, Greece, during 1995–2000, concluding that 92% of the pipe bursts could be prevented if the pipe structural strength was sufficient and, therefore, the most efficient way to ensure service quality is to use corrosion-free pipe materials and collect and analyse data about the system’s functioning to support data-based decision-making (Kanakoudis Citation2004).
In recent decades, several pipe rehabilitation strategies have been proposed that consider the water system functionality and service quality. In the early strategies, the focus has primarily been on the pipe’s physical characteristics and operational parameters (e.g. Wengström Citation1993). USEPA (Citation2002) included 24 single parameters and combined these into three groups to assess the rehabilitation need: pipe physical, water system functioning and service quality parameters. The study concluded that the pipe’s physical parameters can be excluded from the initial analysis, as these can artificially increase the rehabilitation need of older pipes that operate according to design conditions without any deviations or faults. Pipe physical parameters can be used in further assessment while single pipes or groups of pipes have the same priority level for the rehabilitation need.
The latest studies in the field propose including policy considerations and social aspects to the strategy (Minaei et al. Citation2023; Ramos-Salgado et al. Citation2021; Salehi et al. Citation2021; Salehi, Jalili Ghazizadeh, and Tabesh Citation2018). This includes the assessment of how a pipe burst will affect service quality, human behaviour and well-being (e.g. while there is water on the street), traffic disruption, and utility reputation, among others. This approach facilitates the synchronisation of pipe rehabilitation activities with the strategic objectives of other service providers (e.g. electricity, gas and roads, Minaei et al. Citation2023). Ndah (Citation2016) developed a multi-level pipe rehabilitation strategy that considers the specific needs and data availability of the Santa Clara Valley water utility. The assessment deals with 22 different parameters grouped as the consequences and probability of a pipe burst, water system demands and limits, and the overall condition of the pipeline. The parameter groups are given different weights to derive the pipe rehabilitation ranking. Salehi, Jalili Ghazizadeh, and Tabesh (Citation2018) included 30 technical parameters and 12 additional selection criteria, considering climate, impact on consumers, health risks, pipe location and ease of access, among others, to assess in which areas the pipe conditions are worse and in what order the pipe rehabilitation should take place. Salehi et al. (Citation2021) updated the methodology by introducing 6 additional parameters and dividing the total of 48 parameters into 11 criteria groups. These approaches are very comprehensive but require specific and detailed data that are not typically available for water utilities, hindering the straightforward implementation of the methodology.
Combined approaches have been developed for pipe rehabilitation strategies to overcome data deficiencies. These approaches typically include a limited number of parameters combined with an expert assessment of their potential impact on the need for pipe replacement and renovation. Tlili and Nafi (Citation2012) compiled a list of 8 main parameters that water utilities need to consider when selecting pipes for rehabilitation. They prioritised the parameters based on the expert judgement, considering their importance and impact. Kilinc et al. (Citation2018) implemented an analytical hierarchy process (AHP) to evaluate the technical performance of water system pipes. The assessment included 11 parameters grouped into three categories (physical, environmental and operative) that were ranked based on expert judgement. This approach enabled the generation of alternative pipe rehabilitation strategies based on the political and/or strategic goals of the utility. The analytical hierarchy process can be successfully linked with GIS databases (Rahmati, Zeinivand, and Besharat Citation2016) to for example automate the pipe selection for the rehabilitation strategies.
While developing an automated rehabilitation solution on the basis of an existing utility database (e.g. GIS), it is important to note that the available data may describe fragmented pipe segments instead of single pipes due to previous interventions. Furthermore, the available pipe rehabilitation strategies allow one to analyse the rehabilitation need of a single pipe or group of pipes with similar physical characteristics. On the contrary, water utilities create annual investment plans for complete and logically linked pipe sections, not single pipe segments. Therefore, in this paper, a comprehensive methodology is proposed that compiles the reconstruction assessment of a single pipe and group of pipes based on their location, enabling the automated generation of investment plans. Furthermore, the developed methodology for the pipe rehabilitation strategy enables the utility to automatically prioritise the pipes and related street areas/sections according to the condition ranking. The developed strategy is flexible and adaptable, considering the available information from utilities’ pipe databases and national open databases. The strategy is universal to be used for all water systems and easily adjustable based on the changes in political, strategic and environmental levels. The developed strategy was piloted in Tallinn, Estonia, to exemplify the methodology implementation in an operational network of Tallinn’s water utility, where the fluctuations in pipe age are significant, similar to many urban areas in Europe.
Materials and methods
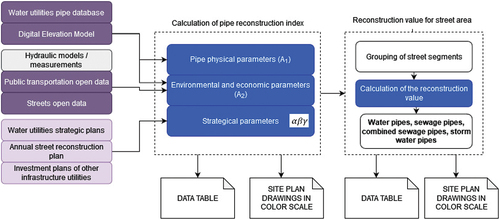
The developed pipe rehabilitation strategy consists of two stages (). In the first stage, the reconstruction index is calculated for each pipe segment, i.e. the section between two manholes, in case of a drainage pipelines or two junctions in the water supply system. The methodology excludes other components, such as valves and pumps. In the second stage, the pipe segments are grouped based on their location, and a combined reconstruction value is calculated for the predefined street section.
Figure 1. Schematic of the pipe rehabilitation strategy.
Calculation of the pipe reconstruction index
The parameters used in the first stage of the analysis were selected based on the literature review and the potential data availability in the water utilities. The preliminary list of parameters was assessed by the water utility experts and amended according to their input. In addition, the data gaps and data renewal practices were investigated in cooperation with the utility to ensure that the strategy implementation can be automated as much as possible and the results of the first stage assessment are reliable. The parameters were divided into three groups: physical, environmental, economic and strategic ().
Table 1. Input parameters for the calculation of pipe reconstruction index.
All of the pipe physical properties (type, diameter, material, bursts, condition, age) are water utility database main entries characterising the network, with the type determining which properties are available (namely, the condition assessment is only available for sewage and stormwater pipes). Most of the environmental and economic properties selected for the algorithm (e.g. water quality and pipe depth) are also directly linked with the utility’s database as these are the most crucial parameters for the utility to assess the level of service. Therefore, the parameters can be valued based on the expert judgement and local conditions, and thereafter automatically analysed. Setting of the parameter values may also be done such that it artificially adjusts the reconstruction index calculation to exclude some of the pipes with specific properties to be able to focus on others. For instance, the utility can focus solely on main and service lines with a diameter larger than 500 mm and assign a parameter value of 0 to other pipe types and diameters.
The remaining environmental and economic properties (hydraulic performance, critical pipes, functionality of urban space, and load of public transport) require pre-analysis to value the parameters and calculate the reconstruction index for each pipe. This also applies to the condition analysis, which indicates the pipe’s physical state and relies on CCTV monitoring, requiring manual or automated examination of the video footage. It is necessary to link the condition rankings with single pipe segments in the utilities database. Hydraulic performance of the network can be assessed based on monitoring and/or modelling results. For example, in the case of stormwater pipes, the hydraulic performance is acceptable when the filling ratio of main lines is less than or equal to the requirements specified in the design standards. For drinking water pipes the performance assessment can be related to pressures at critical points. Critical pipes have to be defined by the water utility prior the calculation of the reconstruction index and parameter values for the condition have to be set in the pipeline database. The functionality of urban space and the load of public transport parameter values are relative and depend on local conditions. In this study, the parameter value for the functionality of urban space was related to the importance class of the street (classified by the City of Tallinn) in the vicinity of the pipe segment. This enabled to analyse the impact of a potential pipe burst to the urban environment and functionality. The load of public transport considers the type (viz. rail vs non-rail), the number of lines, and frequency of service of public transport close to the pipe segment, and allows for a similar analysis of pipe burst impact.
Assigning parameter values for properties like material, age, and water quality can be straightforward or rather complex depending on the available data, the variation of network conditions, and the specific priority of the strategy. On the one hand, the pipeline rehabilitation strategy enables the utility to execute straightforward strategic plans, such as considering specific pipe materials and age (e.g. replacing all steel pipes with an age of 50+ years, or replacing of all lead pipes). On the other hand, since the strategy does not have a specific priority and the goal is to rank pipes based solely on their relative properties, the valuation of some of the parameters may require a multi-parameter optimisation approach. The durability of pipes depends on the climatic conditions (e.g. Barton et al. Citation2019; Fuchs-Hanusch et al. Citation2013; Gould et al. Citation2011), chemical composition of water and overall water quality (e.g. Li et al. Citation2020) and several other aspects like pipe construction methodology, pipe storage and installation conditions. If sufficient data is available, the pipe material and age parameters can be determined using pipe failure prediction models (e.g. Dawood et al. Citation2019; El-Abbasy et al. Citation2019).
The parameters were used to calculate the reconstruction index for each pipe segment in the utility’s database, regardless of their length or other properties. The calculation equation is as follows (EquationEq. (1)(1)
(1) ):
where α, β and γ represent weights derived from the utility’s and city’s strategical and investment plans, such as the short-term strategic goals of the utility, annual road reconstruction plan of the municipality, and the annual infrastructure rehabilitation plans of other service providers. This approach enables increasing the reconstruction index of a certain type of pipe or pipes in a specific location. Weights are defined for a single pipe or group of pipes based on expert judgement in a range from 1–2. A1 and A2 are weights that modify the impact of pipe physical parameters, and environmental and economic parameters. The weights are defined by experts, and the default values are 0.7 and 0.3, respectively. The description of other parameters is provided in . The expert judgements consider both the strategic guidelines from the utility’s management as well as the informed consensus from the engineering perspective. The flexibility of the strategy enables predefining multiple input parameters to analyse the sensitivity of different estimations.
The proposed reconstruction index equation includes the maximum number of parameters suggested for the assessment. The equation is flexible and enables redefining scales for each parameter and weights of different parameter groups. If some of the data is missing or unreliable, then the parameter can be excluded by setting the parameter value equal to zero. At the same time, the equation is universal and can be used for all urban water systems. However, not all parameters are applicable to all pipe types (e.g. condition assessment or depth are not applicable to drinking water pipes). The concept was tested and validated in a real database and network (c.f. Results and discussion) indicating that it can be used to estimate the reconstruction index for all pipeline types, i.e. drinking water, sewage water, stormwater and combined sewage systems. Specific guidelines on the parameters and their exploitation in the case of different water systems can be provided to the end user to endorse the implementation of the concept.
The flexibility of the proposed method enables the water utilities to react quickly to changes in the allocated budget, legislation, climate policy or strategy of the company. Inclusion of the strategic parameters makes it possible to set the focus on the rehabilitation of certain pipes (e.g. replacement of all lead pipes in 5 years, etc.) while ensuring that at the same time the pipes in the worst condition are replaced or reconstructed as well. If the utility has established a relevant database for the pipelines, the process of the calculation of the pipe reconstruction index can be automated, enabling the preparation of several rehabilitation scenarios to analyse the benefits and barriers for the implementation (including spatial, temporal and financial factors). The calculation outcome can be included in the water utility’s pipeline database as an additional value and used for visualisation in GIS. This is further elaborated on and presented in the results and discussion section.
Combined reconstruction values for street sections
The first stage of the assessment provides the reconstruction index (EquationEq. (1))(1)
(1) for every pipe segment, regardless of its length. This gives an understanding of the variety of pipe conditions in the system and locations where the pipe segments with the lowest ranking are situated. However, this is not sufficient to automatically generate the rehabilitation plans for the utility, as the segments are scattered over the network, and it is not feasible to perform construction works in such short segments (considering all the construction permits, closing the street for the work, etc.). Therefore, pipeline rehabilitation activities are usually conducted in longer sections, e.g. covering the whole street from one crossroad to another. For that reason, an algorithm was created in this work to aggregate single pipe segments with their replacement indices into street section groups. Thus, index data with pipeline information stored in the polyline feature class was transferred to polygons representing one potential undivided construction site.
Some conditions were set for the algorithm to create street sections that will eventually hold the combined reconstruction values of pipeline indices.
Streets are typically represented in GIS as polyline elements covering the entire length of the object, i.e. a street with the same name is one polyline shape. To perform the grouping, the polyline elements of the streets were split into segments from one crossroad to another, i.e. using an intersection with another street polyline (, left).
Figure 2. An example of the street polygons (left) and sewer pipelines situated outside the street polygons (right).
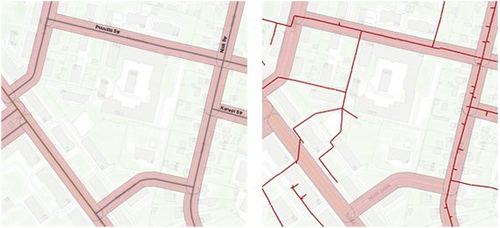
A buffer zone with a width of 20 m was created around the polylines to form dedicated street section areas. This distance can be adjusted by the user, depending on the layout of the network.
Typically, there are also pipelines outside the streets, for example, household connections or courtyards having no defined street object nearby (, right). For these cases, the polygon objects were created using pipeline polylines as a base shape marking the central line of the polygon. All pipe segments were aggregated into polygons with a width of 20 m, following two rules (the user can adjust the distance, depending on the layout of the network):
distance between two pipeline segments is less than 20m;
the type of the pipeline segments is the same, i.e. the pipeline could be either collector (main pipeline) or household connection (service pipe).
The created outside areas were merged with street sections to create a base map for the calculation of the combined reconstruction values.
After grouping the street segments, a link was established between the areas and each pipeline segment situated in the area to import pipe replacement index and pipeline data to the street sections layer. During this step, it was checked that all pipelines have linkages to the areas, and two exceptions were managed. Firstly, not all street areas have pipelines – these polygons can be removed from the database to reduce the computational burden. Secondly, as the street areas and side connections overlap, some shorter pipe segments are therefore linked to more than one area, which distorts the calculation of the combined reconstruction values. To manage these cases, an algorithm was created to check that each pipe segment is present only in one area, and other connections were removed based on the following criteria.
If a pipe segment is present in the street area polygon and polygon(s) outside the street area, only the street area is kept.
If a pipe segment is present in two or more street areas, keep only a higher-priority street. The priority data is imported from the street database.
If all areas have equal properties, keep one randomly.
After these procedures, each pipe element has only one connection with a street area polygon, and these polygons represent logical construction stages. Rehabilitation indices calculated for the single pipe segments and the lengths of the segments were used to find the combined reconstruction values for street sections:
where Rec is the reconstruction index of a single pipe segment calculated in the first phase (EquationEq. (1))(1)
(1) and L is the length of the pipe segment. It is important to note that the grouping and calculation of the combined reconstruction value must be done separately for all pipeline types, i.e. drinking water, sewage water, stormwater and combined sewage systems.
Any type of urban pipeline typically consists of main service lines and household connections. The above-described methodology aggregates both pipe types when calculating the combined reconstruction values. During the initial analysis, it was noticed that in areas where the number of short and small-diameter household connections is relatively high compared to the number of pipe sections in the main service line, the reconstruction values for the predefined area were not consistent with the single pipe reconstruction values calculated in the first stage. Therefore, the high replacement need of the main service line is diluted if household connections are aggregated into the same equation (EquationEq.2(2)
(2) ), leaving the pipeline that needs urgent replacement out from the work list. To remedy that risk, two additional conditions were set for the algorithm when calculating the combined reconstruction values for the street areas.
If the section under investigation includes only household connection pipes, then the Trec value, i.e. combined reconstruction values, are calculated using the reconstruction index and length values of these connections.
In all other circumstances, the Trec value is calculated separately for the main pipeline and household connections, but only the first number is used in final reconstruction values. This approach allows for compiling a separate replacement plan for the household connections if needed by the water utility.
Open-source database utilisation
In addition to the utility’s GIS, three open-source databases were used in the study to calculate urban space parameter F, transport parameter Pr and pipe depth DP. The procedures to find the parameters were as follows.
In this study, the urban space parameter F was calculated based on the street importance classes predefined by the local municipality, the City of Tallinn. According to that system, all streets are divided into 11 different classes, including for example main roads (class 1), side roads (class 6) and walking paths (class 11). Based on engineering judgement, the pipelines situated up to 15 m from both sides of the centre line of the street were selected by the developed algorithm, and the street coefficient was calculated based on the class value. The user can adjust the search distance based on the local conditions. If the pipeline is situated at the crossing of streets with different importance classes, the highest class is selected for the calculation. The urban space parameter F is a ranking between one and zero, where 1 denotes the highest importance class, and 0 means that the pipe segment is outside a street area. Calculated parameters were used in EquationEq (1)(1)
(1) .
A similar procedure was conducted to calculate the load of public transport parameter Pr. The public transportation database (City of Tallinn Geoportal Citation2022) includes real-time data about the train, bus, tram and trolley lines and frequencies in GTFS format. The database was converted to GIS shapefile with the public transportation divided into 5 importance groups: trains, trams, trolleys, bus lines with a frequency above 5 operating days per week and bus lines operating less than 5 days a week. The transportation groups were defined by the authors considering the interruption of transportation and the complex of pipeline reconstruction in case of pipe failure. The pipelines, up to 15 m from both sides of the centre line of the public transport routes, were selected by the algorithm. This distance can be adjusted by the user. The parameter Pr varies between 1 and 0 and is calculated based on the following rules, considering the type of transportation, number of lines on the same street and frequency of the transportation:
if there are any tram or train lines nearby, the pipeline Pr index is set to 1;
if there are no transport lines nearby, the index is 0;
for other cases, i.e. there are only bus and trolley lines nearby, the index is calculated using the following formula:
(3)
where BUS means the number of bus lines near the pipeline, and TRL denotes the number of trolley lines. The comparison of the public transportation database and pipe database enabled the automatic link of each pipe segment with the transportation group.
The utility’s database contained only absolute elevation data of the pipe inverts. For the replacement index DP in the calculations (EquationEq. (1)(1)
(1) ), it was necessary to find the depth of the pipelines. An open-access digital elevation model (DEM) provided by the Estonian Land Board was used for that purpose. DEM was used to calculate the relative pipe depth to consider the complexity of pipe reconstruction in case of a pipe failure. The parameter DP was set to 1 when the pipes were laid deeper than 5 metres and 0 when the depth was less than 2.99 m. These threshold limits are based on the utility’s experience and can be changed by the user, considering the site and country-specific factors. DP was defined based on the deepest end of the pipe segment.
Results and discussion
The methodology was implemented in a test area of a real pipe network in the northern district of Tallinn, Estonia (). Tallinn is the capital of Estonia, with a population of more than 456 000 inhabitants in 2021. The case study area covers a territory of ~20 km2, an area which consists of mostly residential, but also partially commercial and industrial areas. The analysis included 20 636 pipes with diameters ranging from 20 to 2000 mm. Eleven different pipe materials are used in the area, as the pipe build year varies from 1884 to 2021. The pipe types are divided in the utility’s database into four groups: drinking water, sewage water, stormwater and combined systems. In addition, the utility’s GIS database includes information on whether the pipe is a household connection or a service pipe. The parameters derived from the utility’s GIS and included in the pilot site analysis are presented in .
Figure 3. Map of the pilot area in Tallinn.
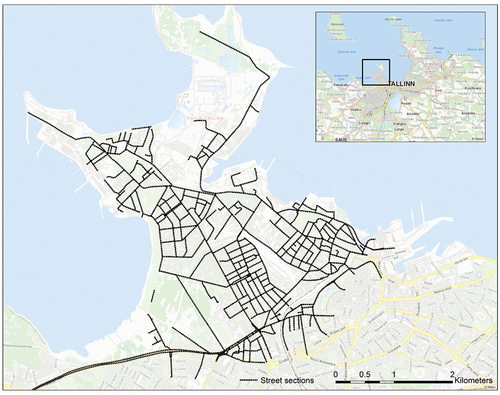
Table 2. Parameters used to calculate the pipe reconstruction indices in the test area.
The parameter specifications presented in were selected based on the availability and quality of the data. The parameter values were estimated based on the engineering judgement and initial sensitivity study conducted in the pilot area. The list is not complete in the interest of brevity, but it indicates how the parameter ranges could be defined for estimating the pipe replacement need.
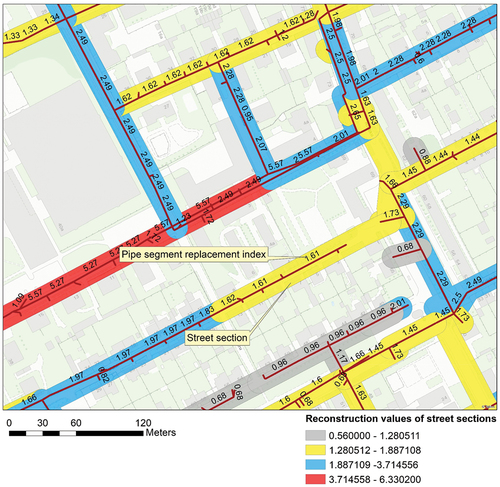
The pipe segment replacement indices were calculated by a script written in MatLab. As the GIS database was provided for the research in ArcMap format, Python programming language with ArcPy module was used to perform the spatial analysis, migrate data from the base for the calculations, calculate values and import the results for the graphical representation. A separate feature class (layer) was created for the combined reconstruction values of street sections, which enables the use of the results in any GIS system or a database with a tabular structure ().
Figure 4. Grouping the single pipe indices into a pipe (street) section group values (combined sewer system).
The replacement assessment algorithm was tested in both the water supply and combined sewage system in the pilot area to demonstrate the universal nature of the proposed methodology. The number of street areas and the range of the calculated combined reconstruction values are presented in the table below ().
Table 3. The ranges of the replacement value points in the case of water supply and sewerage in the pilot area.
shows that aggregating pipe segments into street areas significantly reduces the complexity of the database and therefore substantially simplifies the compilation of the yearly rehabilitation workplan for the utility. In the case of combined reconstruction values, the higher score also shows a higher need to perform a replacement in a particular street area. The frequency distribution of the combined reconstruction values for the water supply and sewerage network in the test area is presented in the graphs below ().
Figure 5. Frequency distribution of pipeline replacement value points for water supply (left) and sewerage (right); the Y-axis represents the number of street sections, and the range of the replacement value points is presented in the X-axis.
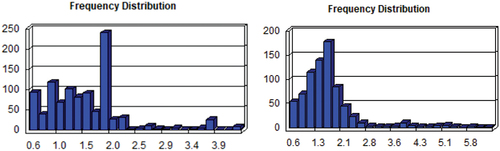
shows that most of the water supply and sewerage pipelines aggregated into the street sections are in relatively good condition and need no urgent replacement. However, the street sections with higher combined reconstruction values distribute relatively evenly on the right side of the graph. This means that the replacement of pipelines should be done yearly, starting from the sections situated on the right side of the graphs. According to the utility’s and city’s initial assumptions, the maximum yearly length of the pipeline replacement in Tallinn can be up to 50 km. This is determined based on the project management load, financial aspects and disruption of traffic. Considering the size of the pilot area (), the theoretical yearly replacement length in this district is up to 4.9 km.
Deciding the pipeline replacement need based on the installation age is a commonly used methodology for establishing replacement workplans. Therefore, this methodology was taken as a reference to analyse the advantages of the developed combined rehabilitation strategy. As the yearly construction length varies in a high range, also the second parameter, diameter, was considered to facilitate the automatic selection of the pipelines to be replaced in one year. The comparison between the age and combined methodology for the sewer network for the first year replacement, i.e. the rightmost section in is presented in .
Figure 6. First-year replacement works based on age and diameter (left) and combined reconstruction values (right).
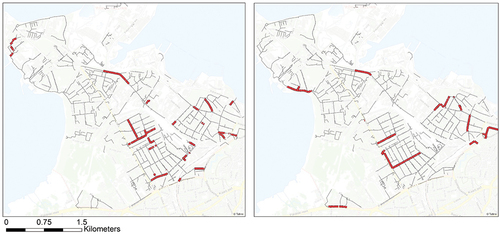
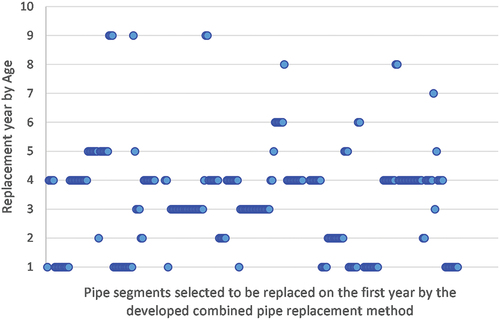
indicates that the age and diameter-based method (left) selects pipes that do not consider the logical reconstruction workload, resulting in short and intermittent worksites scattered over the area. Following that plan in practice would result in higher costs, while the marked sections are short and situated between the pipelines to be preserved. On the other hand, combined reconstruction values (right) aggregate the needed works into a continuous workload, aiding thus the automatic creation of the yearly workplan. As age is only one parameter in the algorithm, only 20% of the selected pipelines match in the case of both methods. Thus, considering only age would leave pipelines that need urgent replacement out of the scope, which might increase the risk of failure in the network. The overview of the replacement years based on age for the first-year scope selected by the combined methodology is presented in . It can be seen from the figure that there are pipelines that are suggested by the age-based method to be replaced by nine years, however also considering other parameters, the developed combined methodology has ranked these to be managed in the first year.
Figure 7. Pipeline replacement years based on age; these are the sewer pipelines selected to be replaced by the combined methodology in the first year.
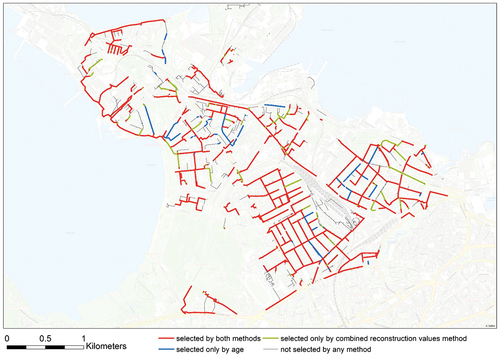
Planning the replacement of the pipelines is not only a yearly effort but should have also a longer vision of investment needs, spanning at least over a decade. Therefore, the developed combined method was also tested for 10 years and compared with the above-described age-based traditional approach. The results are presented in . It can be seen from the figure that the majority of the pipelines are selected in 10 years by both methods. However, analysing the overlapping selection reveals that only 15% of the pipes had the same replacement year. This means that the logic presented in continues over the whole decade of the selection. Analyses also showed that 10% of the pipelines were selected into the 10-year scope only by age method, and the same ratio applies to the pipes selected only by the combined one.
Figure 8. Comparison of developed combined methodology and age-based approach over 10 years in sewer network at the test area.
Reconstruction methods based on the pipeline installation year, which are typically utilised, cannot cover the whole scope. Our calculation in the pilot area showed that, for example, in the case of combined sewer systems, 90% of the pipeline sections did not have a unique value for installation year and diameter, which makes it impossible to automate the selection for rehabilitation. Moreover, for some years, when the construction of the pipelines was more intense, the number of pipeline segments with the same year and diameter exceeded even 100 objects. Thus, despite the partial automation, water utility personnel must make the final selection of which pipelines to replace among that pool of objects with the same properties manually. This process is first time-consuming, second is not repeatable in case any of the input data changes, and third, it does not give full confidence that the manual selection has picked the most critical pipelines for replacement. As the yearly replacement plans are typically dynamic, depending on multiple impacts like the municipality’s plans to renovate streets, the utility’s financial priorities and other adjacent infrastructure to be replaced by other utilities (like district heating, etc.), adjusting the age-based plan needs substantial person-hours. This may also lead to faults and errors resulting in incorrect replacement lists and situations when some of the most critical pipes will not be addressed.
Although there are several commercial software programs available to generate replacement plans for the utility’s pipelines, the main obstacles to wider implementation of the automated analysis are data gaps in the pipeline database and inconsistent quality of the data (Tscheikner-Gratl et al. Citation2019). In many cases, companies are also reluctant to introduce some additional software to perform the analyses and create replacement plans. It is related both to the financial burden and additional person-hours to spend to familiarise yourself with the new software. For that reason, the ongoing development is focused on creating software plugins that work on the existing GIS databases. These developments can be broadly divided into two groups: firstly, stand-alone solutions (e.g. VBA MS Excel-based application developed by Rogers and Grigg (Citation2007)) and secondly GIS-integrated software that utilises, for example, Q-GIS (e.g. Poyato and Montesinos Citation2021). The variety of algorithms used in these solutions is wide, starting from simple weighted average methods to multi-objective optimisation (Ramos-Salgado et al. Citation2021; Tscheikner-Gratl et al. Citation2019). The work presented in the current paper contributes to the field of GIS-integrated solutions and intentionally seeks a balance between computational complexity and immunity to data deficiencies. It differs from previous works by its flexibility, which means that in case of missing data, the parameters can be easily omitted. Furthermore, it is computationally inexpensive, which allows the generation of numerous scenarios for comparison in a time-efficient manner. Taking pipeline database, digital elevation model and long-term strategic plans as immutable inputs, adjusting the weights listed in EquationEq. (1)(1)
(1) and generating new rehabilitation plan for street sections as described in took ca 7.6 minutes of total computation time (computer specifications: 64-bit OS, Intel Core i5 -10,210 U processor and 16GB RAM). The developed approach utilises all GIS capabilities to present results and find relationships with other infrastructure data available in open-access databases concerning the urban space. Moreover, it is not limited to any particular GIS software, and fine-tuning of the algorithm can be done by utility personnel without outsourcing expensive consultancy.
A comparison of selected pipe rehabilitation strategy approaches is presented in . The chosen strategies are flexible, with different levels of complexity and extent of input parameters, and similarly to the approach presented in this paper, consider the availability of data and expert judgement to emphasize the local needs and conditions.
Table 4. Comparison of selected pipe rehabilitation strategies.
In terms of groups of parameters and their respective weights, Kilinc et al. (Citation2018) arrived at values comparable to the current study. The calculated weights for physical and operational factors resulted in 0.86 and environmental factors 0.14. Similar results were gained in the current study as the proposed weight for the pipe physical parameters is 0.7 and environmental and economic parameters 0.3. It must be noted that in the proposed approach some of the parameters defined by Kilinc et al. (Citation2018) as operational were included in this study as environmental and economic parameters.
Applicability of the approaches to different network types, and the pipe grouping functionality affect the implementation potential of the strategies for water companies. Some of the strategies consider only one network or enable the analysis of rehabilitation need of single pipes (). The pipe grouping approach presented in this study takes a step forward including urban space and transport parameters previously partially included only in single pipe rehabilitation analyses (e.g. Kilinc et al. Citation2018). The developed pipe grouping methodology can include all pipe types (e.g. main service lines and household connections) in the analysis, therefore creating comprehensive reconstruction plans for each network type (as opposed to network and pipe type separately).
Ramos-Salgado et al. (Citation2021) used Voronoi cells to aggregate individual pipe sections into rehabilitation groups covering the whole utility’s service area. In this study a different approach was proposed to speed the process and reduce redundancy of empty cells by creating 30 m wide polygons along the pipelines and grouping elements located at the street between two crossroads (logical work length). This approach allows faster computation and simplify analyzing the impact and importance of adjacent infrastructure at the street e.g. public transportation lines. Moreover, it also makes possible for the utility to share the plans in a form of spatial data with other infrastructure owners to facilitate simultaneous construction works at specific streets.
One of the main advantages of the combined pipeline rehabilitation strategy developed in this work is the fully automated generation of the yearly pipe replacement priority lists. This means that if some internal or external factor changes, for example, the municipality changes their list of streets to be renovated or the utility’s budget for pipeline replacement is changed, the process of creating a yearly replacement plan is easily repeatable in a very short time (in the order of minutes). The second advantage of the developed method is that the combined reconstruction values for street sections are mostly unique. In the pilot area, only 8% of the wastewater pipe street sections had duplicate values, and only 1% had more than 5 equal values determined for the areas. This means that it is possible to automatically rank the importance of the replacement, which is a clear advantage compared to the traditional age-based method, where the decision-maker or engineer must decide between hundreds of seemingly identical pipeline sections with the same installation year and diameter.
It must be acknowledged that the results presented in this paper are an outcome of one potential scenario and do not reflect the real investment need of Tallinn’s water utility. In addition, some of the parameters (e.g. water utilities strategic plans) were artificially generated to analyse the impact of these parameters on the comparable scenarios. The results provided in this study prove the feasibility of the methodology grouping the single pipe reconstruction indices to reconstruction values of pipe sections and linking these with street and non-street areas to provide graphical and tabular information to the utility as an input to the investment plans.
Conclusions
A pipeline combined rehabilitation strategy was developed and tested in a pilot area in Tallinn. The methodology enables the calculation of pipe reconstruction indices for all pipes in the water utility database, considering up to 15 different parameters. The reconstruction indices of single pipes were used to calculate the pipe section reconstruction values for street areas and non-street areas. The reconstruction values were calculated for four different pipe types: drinking water, sewage water, stormwater and combined systems. The implementation of the strategy enables the water utility to automatically visualise the reconstruction indices and values for single and grouped pipes in GIS and to export the data as input for the annual and mid-/long-term investment plan.
The advantages of the developed solution are firstly its automation and rapid analysis that allows adapting yearly replacement plans to new boundary conditions, such as budget limitations or changes in internal and external factors like street renovation plans. Secondly, contrary to only using pipe physical properties, such as the installation age, the combined methodology enables us to emphasise the importance of critical pipelines while creating the replacement priority list. Thirdly, the developed algorithms are universal and therefore applicable to any GIS system or pipeline type, i.e. water supply, sewerage and stormwater.
One limitation of the herein-developed strategy to be highlighted is that it still requires a comprehensive and reliable GIS database and the availability of open-access information about the streets, public transportation, and digital elevation models. However, the effect of this limitation is mitigated by the inbuilt flexibility of the approach in using different sets of data or existing models for data reconstruction (e.g. Tscheikner-Gratl et al. Citation2016). Furthermore, the authors believe that, in a broader view, this limitation serves as a strong motivator that should encourage utilities and municipalities to prioritise digitalisation, thus facilitating cross-cutting data-based decision-making.
Acknowledgements
This work was supported by the Estonian Research Council under Grant PRG667 at Tallinn University of Technology. The authors are grateful to AS Tallinna Vesi for sharing the data and validating the concept.
Disclosure statement
No potential conflict of interest was reported by the author(s).
Data availability statement
Some of the data that support the findings of this study were derived from the following resources available in the public domain: https://www.tallinn.ee/est/geoportaal/Andmed
The authors confirm that the data supporting the findings of this study are available within the article. Due to the nature of the research, further supporting data is not available.
Additional information
Funding
References
- AWWA (American Water Works Association). 2001. Dawn of the Replacement Era: Reinvesting in Drinking Water Infrastructure. Denver, USA: United States of America Water Works Association.
- Barton, N. A., T. S. Farewell, S. H. Hallett, and T. F. Acland. 2019. “Improving Pipe Failure Predictions: Factors Affecting Pipe Failure in Drinking Water Networks.” Water Research 164 (1): 114926. https://doi.org/10.1016/j.watres.2019.114926.
- City of Tallinn Geoportal. accessed August 14, 2022 https://www.tallinn.ee/en/geoportal/spatial-data.
- Dawood, T., E. Elwakil, H. M. Novoa, and J. F. Garate Delgado. 2019. “Water Pipe Failure Prediction and Risk Models: State-Of-The-Art Review.” Canadian Journal of Civil Engineering 47 (10): 1117–1127. https://doi.org/10.1139/cjce-2019-0481.
- El-Abbasy, M. S., T. Zayed, H. El Chanati, F. Mosleh, A. Senouci, and H. Al-Derham. 2019. “Simulation-Based Deterioration Patterns of Water Pipelines.” Structure and Infrastructure Engineering 15 (7): 965–982. https://doi.org/10.1080/15732479.2019.1599965.
- EVS (Estonian Centre for Standardisation and Accreditation). 2018. Classification and Characteristics of Techniques for Renovation, Repair and Replacement of Drains and Sewers. EVS-EN 15885:2018. Tallinn, Estonia: Estonian Centre for Standardisation and Accreditation.
- Folkman, S. 2018. Water Main Break Rates in the USA and Canada: A Comprehensive Study. Logan, USA: Utah State University Buried Structures Laboratory.
- Fuchs-Hanusch, D., F. Friedl, R. Scheucher, B. Kogseder, and D. Muschalla. 2013. “Effect of Seasonal Climatic Variance on Water Main Failure Frequencies in Moderate Climate Regions.” Water Supply 13 (2): 435–446. https://doi.org/10.2166/ws.2013.033.
- Gould, S. J. F., F. A. Boulaire, S. Burn, X. L. Zhao, and J. K. Kodikara. 2011. “Seasonal Factors Influencing the Failure of Buried Water Reticulation Pipes.” Water Science and Technology 63 (11): 2692–2699. https://doi.org/10.2166/wst.2011.507.
- Kanakoudis, K. 2004. “A Troubleshooting Manual for Handling Operational Problems in Water Pipe Networks.” Journal of Water Supply: Research and Technology-Aqua 53 (2): 109–124. https://doi.org/10.2166/aqua.2004.0010.
- Kilinc, Y., Ö. Özdemir, C. Orhan, and M. Firat. 2018. “Evaluation of Technical Performance of Pipes in Water Distribution Systems by Analytic Hierarchy Process.” Sustainable Cities and Society 42:12–21. https://doi.org/10.1016/j.scs.2018.06.035.
- Lee, J., and M. Meehan. 2017. “Survival Analysis of US Water Service Lines Utilizing a Nationwide Failure Data Set.” Journal AWWA 109 (9): 13–21. https://doi.org/10.5942/jawwa.2017.109.0098.
- Li, X., L. O’Moore, S. Wilkie, Y. Song, J. Wei, P. L. Bond, Z. Yuan, L. Hanzic, and G. Jiang. 2020. “Nitrite Admixed Concrete for Wastewater Structures: Mechanical Properties, Leaching Behavior and Biofilm Development.” Construction and Building Materials 233:117341. https://doi.org/10.1016/j.conbuildmat.2019.117341.
- Malm, A., O. Ljunggren, O. Bergstedt, T. J. R. Pettersson, and G. M. Morrison. 2012. “Replacement Predictions for Drinking Water Networks Through Historical Data.” Water Research 46 (7): 2149–2158. https://doi.org/10.1016/j.watres.2012.01.036.
- Minaei, A., M. Hajibabaei, A. M. Sabzkouhi, S. Hesarkazzazi, S. Abusamra, E. Creaco, and R. Sitzenfrei. 2023. “Asset Management Perspective in Long-Term Rehabilitation of Aged Water Distribution Networks.” World Environmental and Water Resources Congress 2023:842–857. https://doi.org/10.1061/9780784484852.079.
- Muñuzuri, J., C. Ramos, A. Vázquez, and L. Onieva. 2020. “Use of Discrete Choice to Calibrate a Combined Distribution and Sewer Pipe Replacement Model.” Urban Water Journal 17 (2): 100–108. https://doi.org/10.1080/1573062X.2020.1748205.
- Ndah, T. 2016. “The Buried Pipeline Replacement Era: A Cost-Effectiveness Analysis of Pipeline Replacement Strategies for the Santa Clara Valley Water District.” MSc thesis, San Jose State University.
- O’Day, D. K. 1987. “Water Distribution Record Keeping and Planning Approaches; Current Utility Practices.” Journal of New England Water Works Association 101 (2): 145–168.
- Poyato, E. C., and P. Montesinos. 2021. “Open-Source Application for Water Supply System Management: Implementation in a Water Transmission System.” Water 13 (24): 3652. https://doi.org/10.3390/w13243652.
- Rahmati, O., H. Zeinivand, and M. Besharat. 2016. “Flood Hazard Zoning in Yasooj Region, Iran, Using GIS and Multi-Criteria Decision Analysis.” Geomatics, Natural Hazards and Risk 7 (3): 1000–1017. https://doi.org/10.1080/19475705.2015.1045043.
- Ramos-Salgado, C., J. Munuzuri, P. Aparicio-Ruiz, and L. Onieva. 2021. “A Decision Support System to Design Water Supply and Sewer Pipes Replacement Intervention Programs.” Reliability Engineering and System Safety 216:107967. https://doi.org/10.1016/j.ress.2021.107967.
- Rogers, P. D., and N. S. Grigg. 2007. “Failure Assessment Model to Prioritize Pipe Replacement in Water Utility Asset Management.” In 8th Annual Water Distribution Systems Analysis Symposium 2006, edited by S. G. Buchberger, R. M. Clark, W. M. Grayman, and J. G. Uber. https://doi.org/10.1061/40941(247)19.
- Salehi, S., M. Jalil Ghazizadeh, M. Tabesh, S. Valadi, and S. P. Salamati Nia. 2021. “A Risk Component-Based Model to Determine Pipes Renewal Strategies in Water Distribution Networks.” Structure and Infrastructure Engineering 17 (10): 1338–1359. https://doi.org/10.1080/15732479.2020.1842466.
- Salehi, S., M. Jalili Ghazizadeh, and M. Tabesh. 2018. “A Comprehensive Criteria-Based Multi-Attribute Decision-Making Model for Rehabilitation of Water Distribution Systems.” Structure and Infrastructure Engineering 14 (7): 43–65. https://doi.org/10.1080/15732479.2017.1359633.
- Scholten, L., A. Scheidegger, P. Reichert, M. Mauer, and J. Lienert. 2014. “Strategic Rehabilitation Planning of Piped Water Networks Using Multi-Criteria Decision Analysis.” Water Research 49:124–143. https://doi.org/10.1016/j.watres.2013.11.017.
- Tlili, Y., and A. Nafi. 2012. “A Practical Decision Scheme for the Prioritization of Water Pipe Replacement.” Water Supply 12 (6): 895–917. https://doi.org/10.2166/ws.2012.068.
- Tscheikner-Gratl, F., N. Caradot, F. Cherqui, J. P. Leitão, M. Ahmadi, J. G. Langeveld, Y. Le Gat, et al. 2019. “Sewer Asset Management – State of the Art and Research Needs.” Urban Water Journal 16 (9): 662–675. https://doi.org/10.1080/1573062X.2020.1713382.
- Tscheikner-Gratl, F., R. Sitzenfrei, W. Rauch, and M. Kleidorfer. 2016. “Enhancement of Limited Water Supply Network Data for Deterioration Modelling and Determination of Rehabilitation Rate.” Structure and Infrastructure Engineering 12 (3): 366–380. https://doi.org/10.1080/15732479.2015.1017730.
- USEPA (U.S. Environmental Protection Agency). 2002. Deteriorating Buried Infrastructure Management Challenges and Strategies. Washington DC: U.S. Enivornmental Protection Agency.
- Wengström, T. R. 1993. Comparative Analysis of Pipe Break Rates. A Literature Review, p. 93. Vol. 2. Göteborg, Sweden: Chalmers University of Technology.