Abstract
First-level inspections could be provided by skilled volunteers or technicians to pre-screen the functional status of check dams. This paper discusses the design and testing of a support method in collaboration with the responsible technicians in evaluating inspection reports. Reports are based on linguistic rating scales that are systematically aggregated into indices by means of a multi-criteria TOPSIS method with fuzzy terms. The aggregation procedure is carried out for three parameters representing the structure’s status while highlighting any lack of completeness of inspection reports. The method was evaluated using inspection reports collected during a workshop in the Fella basin in the Italian Alps. The method allows the responsible technicians to set rules to categorise the aggregated indices in one of three levels, each corresponding with a course of action. Rules were useful to categorise the aggregated indices according to the structure’s status. Disagreements on rating defects suggest that a weighted aggregation procedure to calculate the indices might lead to overestimating or underestimating defects. Complementary data from historical inspections or remote sensing are required to initiate specific actions. The method can be applied to pre-screen different types of hydraulic structures after adaptation to the local conditions and functional requirements.
1. Introduction
Check dams and other stabilisation structures aim to reduce the risks of debris flows (Holub & Hubl, Citation2008). Without appropriate inspection and maintenance, the functional condition of structures often declines (Jakob & Hungr, Citation2005). For planned maintenance, pre-screening inspections are fundamental (Van Riel, Langeveld, Herder, & Clemens, Citation2014). The frequency and type of inspections depend on local circumstances and available financial resources (Holub & Hubl, Citation2008; Mazzorana, Trenkwalder-Platzer, Fuchs, & Hübl, Citation2014).
Collaboration between relevant authorities and community organisations (Failing, Gregory, & Harstone, Citation2007) can take the form of visual inspection campaigns with volunteers in support of technicians (Cortes Arevalo et al., Citation2014). To evaluate inspections performed by skilled volunteers or technicians, a method is proposed that combines a well-established approach for multi-criteria evaluation with linguistic inputs and expert-based rules. This method aggregates ratings into indices and indicates reports’ completeness. Indices fall in one of three levels, each corresponding with follow-up advice. This paper discusses the design and testing of the support method in collaboration with the intended users.
2. Overview of criteria for inspection and maintenance planning of check dams
Proactive maintenance strategies are based on the assessment of the vulnerability of check dams (Suda, Strauss, Rudolf-Miklau, & Hübl, Citation2009), which results from the hazard intensity and the susceptibility of the structure itself due to, for example, the state of maintenance (Uzielli, Nadim, Lacasse, & Kaynia, Citation2008). No straightforward relationship exists between the susceptibility of a single check dam and other components of the protection system (Dell’Agnese, Mazzorana, Comiti, Von Maravic, & D’Agostino, Citation2013). In addition, inspection and maintenance planning should address the different functions that structures have and the value of what is being protected (Mazzorana et al., Citation2014). Table lists the system criteria for sustainable maintenance planning (Sahely, Kennedy, & Adams, Citation2005).
Table 1. Review of system criteria for the inspection and maintenance planning of check dams.
In decision support methods, actions can be modelled as a set of alternatives for the decision-makers that are evaluated against a set of criteria. According to Serre, Peyras, Maurel, Tourment and Diab (Citation2009), decisions about maintenance planning imply sorting the set of structures by applying pre-established rules. Support methods for the management of infrastructure are often based on multi-criteria methods such as the weighted sum approach (Kabir, Sadiq, & Tesfamariam, Citation2014). A variety of examples exist for structures such as bridges (e.g. Dabous & Alkass, Citation2010; Rashidi & Lemass, Citation2011), dams (e.g. Curt & Gervais, Citation2014) and sewage systems (e.g. Tagherouit, Bennis, & Bengassem, Citation2011).
The analytical hierarchy process method (AHP) (Saaty, Citation1987) facilitates pairwise comparisons in order to set the relative importance (weight) of criteria or actions (e.g. Najafi & Bhattachar, Citation2011; Sun & Wenjun, Citation2011). In addition, indicator schemes are often required to aggregate knowledge and information about the performance of a given set of criteria. Curt, Talon and Mauris (Citation2011) used such a scheme to represent and aggregate measurements, sensory evaluations and expert knowledge on dam conditions. The uncertainty embedded in the indicators is generally handled with fuzzy logic theory and expert-based rules (Janssen, Krol, Schielen, Hoekstra, & de Kok, Citation2010).
To improve the use of decision support methods, active involvement of potential users helps refine the initial requirements for designing and testing decision support methods (McIntosh et al., Citation2011). Rhee and Raghav Rao (Citation2008, Chapter 51) also suggest involving persons external to the design process to supply fresh perspectives. A combination of ease of use, perceived usefulness and validity of decision support methods contribute to actually being used (Díez & McIntosh, Citation2009; Junier & Mostert, Citation2014).
3. The design process of the decision support method
Our method was developed in collaboration with decision-makers working in the Fella basin, in the Friuli Venezia Giulia (FVG) region, located in the north-eastern Italian Alps (Figure (a)). The Fella basin (Figure (b)) is a mountainous basin prone to landslides, flash floods and debris flows, where the management of inspection and maintenance is a priority due to the increased number of protection works. After the debris flow event in 2003, the Regional Civil Protection suggested involving their volunteers to support the technicians in pre-screening visual inspections.
Figure 1. (a) FVG and neighbouring regions; (b) the study area and location of the check dams (CD) inspected during the workshop; and (c) summary of the method design process.
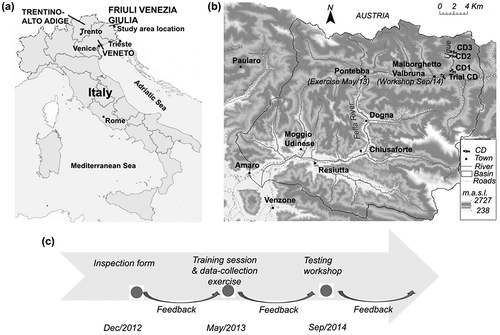
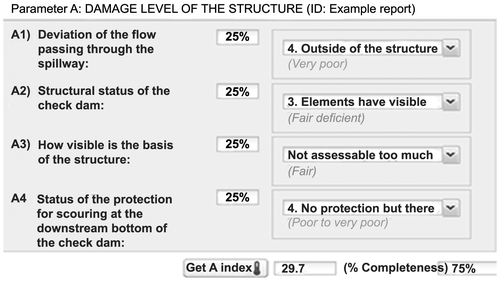
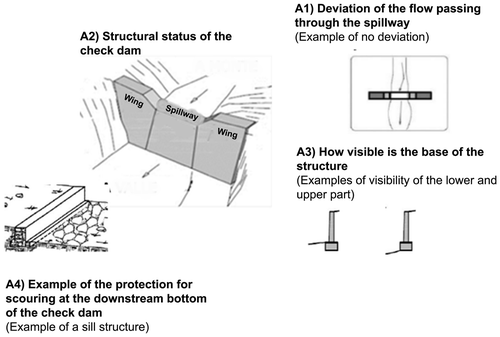
Cortes Arevalo et al. (Citation2014) describe the collaborative design and testing of inspections forms with support of technicians and volunteers, followed by a data collection exercise (Figure (c) in Dec and May/2013). The form’s content and layout were developed in collaboration with decision-makers from the relevant management organisations in the FVG region. Questions, rating options and visual schemes to guide the inspection (see example in Figure ) were based on existing procedures in FVG (Servizio Forestale FVG, Citation2002) and neighbouring regions (Provincia Autonoma di Bolzano – Alto Adige, Citation2006; as referred to in Von Maravic, Citation2010). During the data collection exercise, inspections were carried out both by technicians and volunteers. The results from that exercise showed that volunteers’ reports had higher variance than technicians’ reports. To cope with the differences in precision, we generalised rating scales to calculate the mode according to the questions and rating options provided in the form. For a five-option rating scale, we simply generalised into three options, namely: very low-to-low concerns, medium and high-to-very-high concerns. However, the reports of both groups were comparable in their limited reproducibility. Therefore, a method was required to support the decision-making of technicians by systematically evaluating the inspection reports.
Figure 2. Example of questions and visual schemes to guide the inspection for parameter A, Damage level of the structure. Adapted from existing procedures in (Servizio Forestale FVG, Citation2002, p. 27) and neighbouring regions (Dell’Agnese et al., Citation2013, p. 13: Provincia Autonoma di Bolzano – Alto Adige, Citation2006.).The latter is referred to in Von Maravic (Citation2010, Annex 2) as EF30-Vulnerability evaluation form)
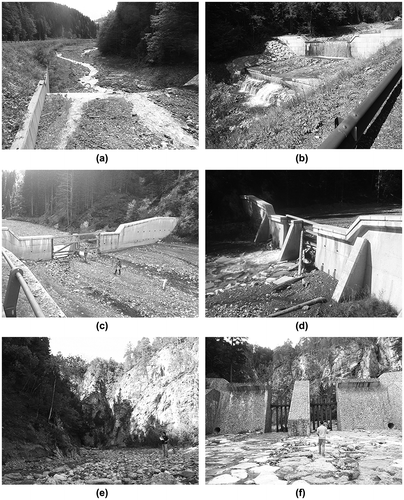
In order to test the proposed decision support method, a workshop was organised in September 2014 (Figure (c) in Sep/2014). The method was evaluated by comparing the participants’ inspection reports of each of the three check dams that were selected by the technicians of Civil Protection (Figure (b)). Check dam 1 (Figure (a) and (b)) is a consolidation check dam with a secondary dam for downstream scouring protection. Its function as part of a series of structures along the stream channel is to reduce flow and sediment processes, and to control channel erosion. Check dam 2 (Figure (c) and (d)) is located downstream along the same channel and is meant mainly for the retention of wood and debris. Check dam 3 is located downstream in the alluvial fan near the Ugovizza town. Check dam 3 (Figure (e) and (f)) is a key check dam as it retains large amounts of wood and debris.
Figure 3. Photos of the structures inspected: (a) downstream view of check dam 1; (b) check dam 1 and sill structures located in series; (c) downstream view of check dam 2; (d) level of obstruction in check dam 2; (e) upstream deposit in check dam 3; and (f) level of obstruction in check dam 3.
Fourteen participants attended the workshop. They formed two equal groups: users and new-users. The users consisted of six decision-makers of the FVG region who had participated in the design stages and a scientist. The new-users were a mixed group of two technicians of FVG, one from the intra-basin authority, two from neighbouring regions and two final-year students of geo-sciences. The workshop consisted of outdoor and indoor activities in a one and a half-day programme. During the first day, a trial check dam inspection (trial CD in Figure (b)) introduced the inspection procedures to all participants. Subsequently, all participants inspected the three check dams of Figure . Next, the prototype – web-based – decision support method was introduced to the participants. During the second day, 10 participants applied the decision support method using their field data, and provided feedback afterwards.
The effect of data quality on the final condition of the check dams was assessed as follows: no defects, unclear conditions and defect(s). The most frequent rating was assumed the ‘true condition’ (modal rating). The agreement on the modal rating was the accuracy indicator for each question at parameter level. For each question, the following accuracy levels were used: equal to or larger than 90%, 70–90%, 50–70% and smaller than 50%. The precision was evaluated through the maximum and minimum rating that participants reported, while a completeness ratio accounted for unanswered questions. False positives (FP) are reported defects or unclear conditions that were not present. False negatives (FN) are defects or unclear conditions that were not reported. The consistency of the outputs was analysed through comparing the aggregated indices calculated using the decision support method with the expert advice after the field inspection.
4. The decision support method to systematically screen structures’ status
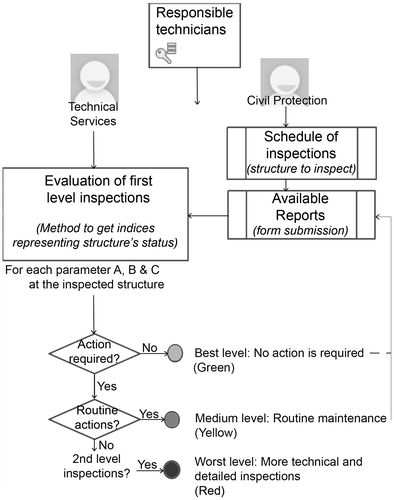
After the visual inspection (Figure ), the reported ratings were aggregated and indices were calculated using the multi-criteria TOPSIS method, representing the functional status for three parameters:
| (1) | damage level of the structure, | ||||
| (2) | obstruction level at the structure and | ||||
| (3) | erosion level in the stream banks. | ||||
The technicians set rules to assess the three indicators determining the functional status of the structure and, with that, an advised action. The best functional level requires no action, the medium level signifies routine maintenance and the worst level requires a second level or more detailed inspection to determine the type of maintenance or repairing.
4.1. Conversion of rating options into scores
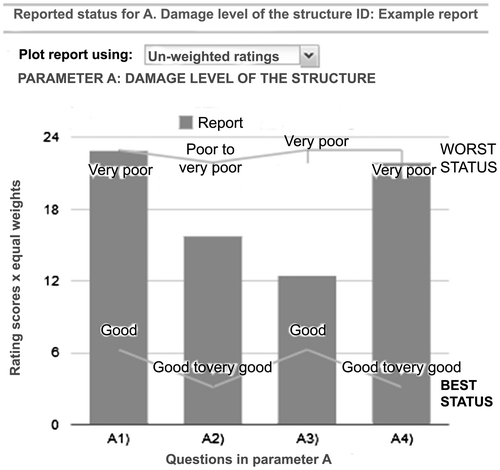
To convert the ratings into scores, fuzzy terms were assigned to the rating options for each question and subsequently systematically converted into scores. The membership functions of Chen and Hwang (Citation1992) were chosen (Figure ) because they include fuzzy terms (e.g. poor to very poor) that account for the differences in precision between the rating options provided in the form. Table presents the conversion scores assigned to all rating options. For example, for parameter A and question A3, the option ‘The base of the structure is covered with sediment’ was qualified as ‘Good’. Decision-makers can use the report plot (Figure ) to compare the reported conditions with the best and worst possible ratings for each question.
Figure 5. Nine fuzzy terms scale for the systematic conversion of rating options based on Chen and Hwang (Citation1992) and adapted from Jonoski (Citation2002).
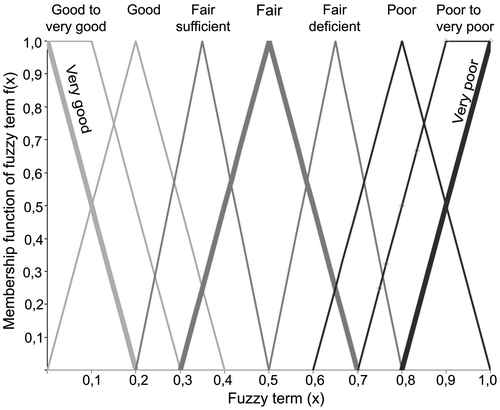
Table 2. Scores assigned to all rating options for each question per parameter on the inspection form.
4.2. Aggregation into indices at parameter level
The scores were aggregated into indices at parameter level using the multi-criteria method TOPSIS with fuzzy inputs (Hwang & Yoon, Citation1981). The TOPSIS method has been originally applied for the ranking of management alternatives (e.g. Almoradie, Cortes, & Jonoski, Citation2015). As adopted here, an index is derived from Equation (1), according to the relative distances to the best and worst conditions. The best functional status is defined as close to 100 and the worst as close to 0.
For each question , the difference was calculated between the reported conditions (
) and the best
and worst
reference conditions. Equation (2) was used to calculate the distance
to the best rating score
and Equation (3) for the distance
to the worst one
The term
accounts for the relative importance of each question
. Setting weights can change the outcomes considerably; therefore, decision-makers should set these weights with great care. To support the weights elicitation, we suggested the pairwise comparisons of the AHP method (Saaty, Citation1987). Thereby, decision-makers can assess the relative importance between questions at parameter level, based, for instance, on the structure’s design criteria or their expert knowledge of check dams (e.g. Dell’Agnese et al., Citation2013). In this study, equal weights (un-weighted ratings) were used to specifically evaluate the effect of the quality of the input data on the output of the method. By including the weights, we would have clouded the effect of the input data quality by introducing additional factors in the evaluation of inspection reports.
The reported ratings (Figure ) were aggregated into two values at parameter level, the functional status and the completeness ratio of Equation (4). Where conditions were reported as unspecified, or questions were unanswered, the index was calculated assuming a ‘fair’ condition. An alternative option for the analysis of incomplete reports may have been by neglecting unanswered questions, assigning them a zero weight in Equations (2) and (3) for the index calculation. However, this will also alter the weights for other questions and therefore it would increase the complexity for decision-makers and limit the comparability of reports. Overestimations may be introduced, for example, by assuming a poor condition to remain on the safe side. Thus, we opted for maintaining the same weights and assuming a ‘fair’ condition to limit the effect on the calculated index. Furthermore, the completeness ratio calculated by Equation (4) draws the decision-maker’s attention to unanswered questions. Lastly, decision-makers can modify the rating condition and corresponding score for unspecified or unanswered questions according to their assessment of the functional requirements of the structure itself (see Table ). The aforementioned equations are defined as follows:(1)
(2)
(3)
(4)
4.3. Rules to identify levels of functional status per parameter
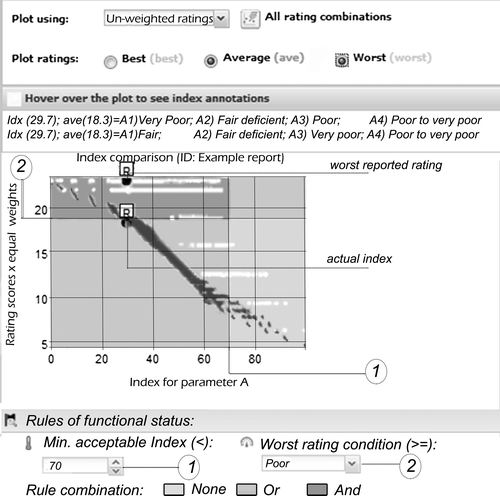
To arrive at an advised action, decision-makers define a status that is acceptable, by setting two rules at the parameter level: the lowest acceptable aggregated index and the worst acceptable rating
. To be assigned the worst level, the aggregated index has to be smaller than
and the worst rating score has to be larger or equal to the given
.
can range from 0 to 100. A
can be selected from fair deficient (FD), fair (F), poor (P), poor to very poor (PVP) and very poor (VP). The combination of the two rules leads to the assigned functional status at parameter level (Table ).
Table 3. Levels of functional status at parameter level.
In this study, was set to 70 and
to Poor. This leads to an outcome space with four areas according to their functional levels. A report results in the worst functional level when the combination of the two rules is true (Table ). In the example of the index comparison plot (Figure ), the dark grey dots are the aggregated indices for all possible rating combinations (horizontal axis) against the average scores (vertical axis). The white dots indicate the aggregated indices (horizontal axis) against the worst rating of every possible combination (vertical axis). As an example, in Figure , the report (R) is given by the combination of ratings of ‘very poor’ for question A1, ‘fair deficient’ for A2, ‘fair’ for A3 and ‘poor to very poor’ for A4 that leads to an index of 29.7. In Figure , (R) is indicated as a dark grey dot with the index (29.7) and the average score of reported ratings (18.3). The index of the report (R) is also plotted as a white dot against the worst reported rating (22.9). In addition, other possible rating combinations leading to the same index are indicated within the index annotations.
To further assist decision-makers in defining the acceptable minimum index and the worst acceptable rating, the cumulative frequency of the occurrence of a given index was analysed for all possible rating combinations. For example, indices were calculated for all 1728 possible rating combinations according to the rating options listed in Table for parameter A. In this frequency analysis,
shows the cumulative frequency of calculated indices and the position of a given index in the outcome space of the method,
range. Table presents as an example the frequency analysis regarding parameter A.
Table 4. Cumulative frequencies of aggregated indices for each possible rating combination according to the index range and worst rating condition for Parameter A.
As all questions are weighted equally, all possible rating combinations (Table ) have a normal cumulative frequency distribution (). In addition, the column
indicates the cumulative frequency of rating combinations provided, given that at least one question was reported worse or equal to the
selected for the worst rating. For column
, the
was set as fair (F), fair deficient (FD), poor (P), poor to very poor (PVP) and very poor (VP).
presents the cumulative percentage of occurrences below the index range (
) for each possible condition. In this study, the acceptable index and the worst rating were set at 70 and at poor. Thus, this example shows that from all 1728 possible rating combinations, 91% have a cumulative frequency of indices lower than 70 (see column <
and
range 60–70 in Table ). From that 91%, 93% have at least one rating worst or equal to poor
. If the decision-maker sets the worst acceptable condition at very poor (VP), then 53% of that 91% will be in very poor condition for at least one question
). Moreover, Table illustrates the cumulative frequencies below the index range when varying the worst rating condition (see columns
,
,
,
and
).
5. Results of using the decision support method
This section presents the results of applying this method in the September 2014 workshop. To see whether there is a positive effect of being involved in the design process, users that were and those that were not involved before the workshop were compared. First, the results of the method will be assessed in terms of differences in the decision outcomes within groups and between groups. Next, the perceived usefulness of the inspection form and the proposed method according to participants will be discussed. The reported ratings and the aggregated indices for the three check dams inspected are available in Appendix 1 (Tables A1–A3) together with an overview of the feedback provided by participants (Tables A4 and A5).
5.1. Differences in the decision outcomes due to differences in individual reports
The individual reports consisted of ratings for questions at the parameter level together with a synthesis advice for further action that inspectors gave in the field by selecting one of the following management actions: (1) no action required; (2) routine maintenance with support of volunteers; (3) routine maintenance using equipment; and (4) second-level inspection. After a comparison of inputs (ratings) and outputs (advice) per individual inspections and structures, the following issues were addressed:
| • | Differences in the reported ratings for each question depending on the accuracy, precision and completeness of inspection reports. | ||||
| • | Differences in the aggregated indices and comparison of the inspectors’ advice with the functional levels that were assigned in the decision support method. | ||||
5.1.1. Differences in the reported ratings for each question
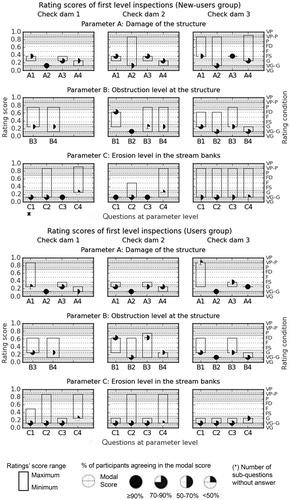
Figure summarises the reported ratings for each question by participants’ group and check dam. The scores in the upper area represent a reported defect and correspond to ratings between very poor (VP) and poor (P). The middle area stands for ratings in which a defect is not clearly recognisable or information is limited. Those are ratings between fair deficient (FD) and fair sufficient (FS). The lower area stands for no defects with ratings between to very good (VG) and good (G).
The modal score of users and new-users were the same in most cases (Figure ), despite the differences in precision (maximum and minimums reported ratings). By aggregating the results of all participants, only the modal score of one question resulted in assigning a ‘poor’ status (A1 for check dam 3). The mode for five questions resulted in an ‘unclear’ status (A1 for check dam 1 and 2, A3 for check dam 2 and 3 and B1 for check dam 2). The other questions resulted in a ‘good’ status, for example, the modal scores for parameter C. In addition, regarding the probability of errors, Table summarises the frequency of false positives (FP) and false negatives (FN) at parameter level. For parameter A, for all participants, the frequency of FN is somewhat higher than the FP. In contrast, for parameters B and C, the error frequencies of FP are higher.
Table 5. Frequency of errors for all inspected check dams at parameter level.
5.1.2. Differences in the aggregated indices and comparison of the inspectors’ advice with the calculated functional levels
To compare the outcomes of the users and new-users groups, the individual inspection reports were aggregated at parameter level. Figure shows the differences in the calculated indices at parameter level for each check dam. The relative frequencies of resultant indices (bars) are plotted for each group, whereas the cumulative frequencies (line) are plotted for all participants.
Figure 10. Frequency analysis for the calculated indices at parameter level per inspected check dam. The percentages are calculated referring to the total number of participants. (*) indicates indices calculated for incomplete reports.
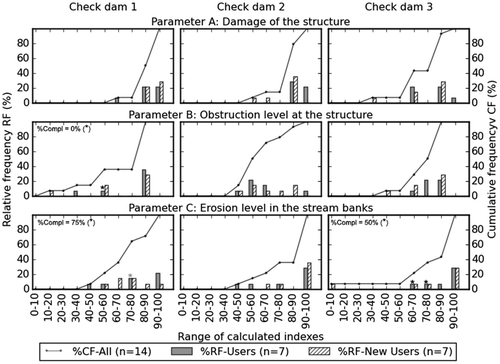
Regarding check dams 1 and 2, the range of calculated indices for parameter A is mostly above 70. Regarding check dam 3, the most frequent indices are in a wider range between 60 and 70 and 80 and 90. It turned out to be unclear whether the sectional barriers in the open check dams were to be reported in question A2 (condition of the structure). Some technicians only reported the damage of the bars in the comments and did not include them in answering question A2.
Regarding check dams 2 and 3, calculated indices for parameter B had a larger variability (between 40 and 70). Parameter C comprised most unanswered questions of all parameters. However, the indices were calculated by assuming ‘Fair’ conditions and indicating the completeness ratio, Equation (4) in Section 4.2. Despite the lack of completeness, the range of calculated indices for parameter C was mostly above 70 with some outliers for both check dams 1 and 2.
To analyse the consistency of the outputs, the inspectors’ advice was compared with the outcome of the decision support method (Figure ). The inspectors’ advice varied, but the majority considered check dam 1 in good condition, requiring no action. The majority of inspectors considered check dam 2 in need of cleaning of sediments using equipment. Regarding check dam 3, the majority was divided between the need of a routine cleaning and one with support of equipment.
Figure 11. Comparison of the assigned advice in the synthesis from the field inspection and the calculated functional levels.
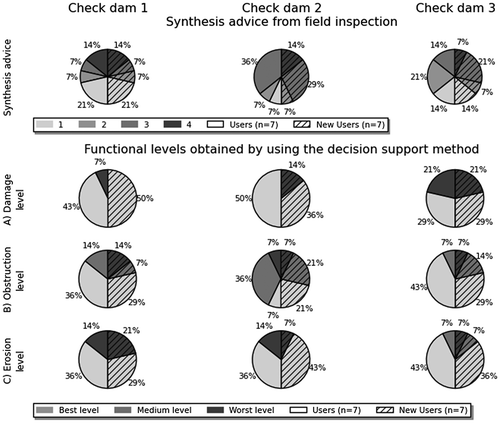
As a result of the calculations by the decision support method, check dam 1 was assigned the best level for parameters A, B and C, although the results were divided for parameters B and C. Check dam 2, was assigned the best level for parameters A and C. The result for parameter B shows a medium level, which implies cleaning of obstructions. In comparison, for check dam 3, parameters B and C were mostly rated the best level and parameter A shows a divided opinion between best and worst levels. The results of the inspector’s advice and the output of the decision support method correspond fairly well. In both cases, some ratings resulted in assigning low functional levels, slightly more so for the new-users group.
5.2. Participants’ perception of the usefulness of the method
Figure depicts the views of both groups on: (a) rating options and conditions in the design of the inspection form and (b) perceived clarity, reliability and usefulness of first-level inspections. Participants rated their level of agreement from -3 (full disagreement) to +3 (full agreement) and provided comments to explain their judgement. Feedback from new-users on the inspection form was particularly relevant as they had a fresh perspective.
Figure 12. Overview of participants’ level of agreement (Table A4 in Appendix 1). The difference in the participants’ number was because not all users group attended the second-day programme.
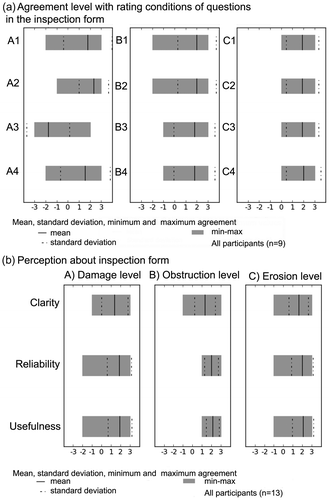
Figure (a) shows the level of agreement regarding the fuzzy terms assigned to the rating options (Table ). To that end, participants checked the fuzzy terms assigned for each question for all parameters. Although the mean agreement level was positive for both groups, the users group was more positive, which may be due to their previous involvement. All participants provided suggestions for improvements of the inspection form as summarised in Table A5 (see Appendix 1).
Figure (b) depicts the results regarding the perceived clarity, reliability and usefulness of first-level inspection reports. The participants specifically judged the following statements:
| • | The questions and options to report are clear enough. | ||||
| • | Reliable information can be collected with these questions. | ||||
| • | The information collected this way is useful to set priorities for the maintenance of hydraulic structures. | ||||
Figure reflects the need for improvements (Table A5 in the Appendix 1). Concerning the reliability, participants remarked upon the need for training and instructions with photo examples that can be taken to the field. The inspectors, whether volunteers or technicians, should always supplement their ratings with the photo record of the inspection and compare these with available previous inspections. The users group suggested carrying out first-level inspections after an important rainfall event to establish the check dams’ status.
6. Discussion on the use of first-level inspection reports for decision-making
The usefulness of methods proposed depends on how well the limitations of rating systems are understood and handled by decision-makers (Swets, Citation1988). In our study, an undisputed ‘True condition’ cannot be established, but the modal result was defined as true and the disagreement can be seen as a lack of precision or an error. Thus, the differences in outcomes, resulting from the disagreements in the reports, were analysed (Figure ) and explored to improve the inspection form. Based on the categories distinguished by Van der Steen, Dirksen and Clemens (Citation2014), the following causes for disagreement can be distinguished:
| (1) | Questions or support schemes did not clearly specify the condition to observe. For example, question A1 asks about the deviation of the flow in the spillway. Although there was no deviation in the spillway of check dam 1, a deviation was reported (Figure (a)), mainly by the new-users group, because there was a deviation of the stream flow downstream of the check dam. To avoid misunderstandings, participants suggested transferring this question to parameter B. | ||||
| (2) | Observed conditions could not be reported through the options provided. This is illustrated by parameter B for check dams 2 and 3 (Figure (c) and (e)). The accumulated debris was deposited in the retention basin after recent rainfall events. Some participants did not report them because sediments may be washed away in future rainfall event. | ||||
| (3) | The difference between the rating options was unclear. This is derived from the accuracy levels and range in precision presented in Figure . A larger range in precision indicates a difficulty to distinguish differences between the rating options, but a smaller range increases the accuracy error. Regardless of who performs the inspection, technician or volunteer, a supporting manual regarding how to fill out the form is useful to clarify differences between rating options. Overall, the precision of the users group was slightly better than new-users. The lack of completeness was mainly the result of unanswered questions by users. The completeness ratio was slightly better for the new-users than the users group. | ||||
As shown in Table , disagreements can be due to an inspector failing to recognise a defect (FN) and a defect being reported, although there is none (FP). Dirksen et al. (Citation2013) indicated for visual inspections in sewage infrastructure that the probability of FN is significantly larger that the probability of FP. In our case, FN was somewhat higher only for parameter A (Damage level). Inspectors may have erred on the side of caution when it was not possible to distinguish between rating options. Such could be the case for parameters B (obstruction level) and C (erosion level). The rated defects are higher than reality demands (see also Curt et al., Citation2011) and the probability of FP increases. Training and longer experience of participants using the form may reduce the number of FP.
By facilitating the definition of expert-based rules to categorise the indices, some flexibility in the application of the method is introduced. In this study, we used equal weights at parameter level to evaluate the effect of the input data quality on the output of the method. By applying the same relative importance for all questions, errors within the data equally affected all calculated indices. The findings regarding the probability of errors (Table ) suggest that using different weights for the aggregation of ratings lead to underestimating or overestimating defects. Weights may still be relevant for the damage level (parameter A) to distinguish the effect of damages in different parts of the structure, but perhaps not for erosion and obstruction levels (B and C parameters). In either case, we suggest that assumptions for setting up the method (i.e. weights and treatment of unanswered questions) are made only once for every structure inspected. Changing assumptions will affect the comparability of all future reports of the same structure. A statistical analysis of the weights for different types of structures would be required to understand their effect in the evaluation of reports and priorities of interventions.
The effect of errors on the output of the method also depends on the pre-established rules to classify the indices into functional levels. The analysis of the cumulative occurrence of a given index (Table ) suggests that combined rules become necessary to choose between the worst and medium functional levels. In this study, worst functional levels were assigned by
< 70 and condition ≥ Poor. Using
< 70, (too) many combinations were considered in the worst level (Table ). Decision-makers can decrease the acceptable index or increase the limiting worst condition.
Regarding the differences between inspection advice and outputs of the decision support method, most parameters were categorised as having the best or medium status requiring only cleaning. However, both users and new-users show a bias to the lower functional levels (Figure ). Advice from new-users (mainly technicians from other regions and students) were generally lower than the users. New-users had less knowledge of the inspected structures and the study area, which probably led to (overly) cautious ratings.
To validate the inspections and set expert-based rules, additional information is required that can come from the photo taken to support the reports or from previous inspections reports. It is important to maintain and update the database of hydraulic structures of first-level inspections carried out at different periods. The imperfections and limitations of visual inspections can be countered using remote sensing techniques and vice versa. Some studies are already using multi-temporal data-sets for the impact analysis of check dams and hydrogeological mapping at sub-basin level (Raghu & Reddy, Citation2011). The morphometric analysis of remote sensing data can support the susceptibility analysis of the system of protection works at sub-basin level rather than limiting it to the individual structures (e.g. D’Agostino & Bertoldi, Citation2014; Patel, Gajjar, & Srivastava, Citation2013).
The decision support method provides options to set rules distinguishing the functional status at parameter level. According to Vuillet, Peyras, Serre and Diab (Citation2012), multi-criteria methods may be useful for intermediate aggregations about the performance of relevant criteria, but expert-based rules are more suitable to get an overall judgement about the functional status. By indicating the functional status at parameter level instead of aggregating the parameters score in a global index, compensation of extremes or errors in one parameter by the other two parameters is avoided. A sorting of inspected structures is required for prioritising management actions. The sorting (see Figure ) could be based on the assessment of each of the three parameters. Alternatively, sorting could consider the completeness ratio of inspection reports.
The focus was on the functional status because it is a preliminary, but essential, criterion towards a proactive management approach (Mazzorana et al., Citation2014). Other important criteria that should be further investigated to set priorities for maintenance planning are (Table in Section 2): for example, changes in the functional status at different periods; dominant water–sediment processes in the system; functional type of the check dam within the system; and type and relevance of exposed elements that are being protected by the check dam. Moreover, the outputs of this method could be further evaluated with alternative approaches such as Bayesian inference (Schweckendiek, Vrouwenvelder, & Calle, Citation2014) and fault tree analysis (Ten Veldhuis, Harder, & Loog, Citation2013) to analyse changes of the functional status over time.
Finally, the collaboration with the responsible technicians was key to addressing the user requirements for decision support from the early stages. A group of 14 participants attended the organised workshop; half of them were involved in the design process. Involvement of users and new participants in the process was valuable to analyse differences in decision outcomes and to identify the need for improvements or further research.
A combination of usefulness and validity is particularly important (Junier & Mostert, Citation2014). Balancing those aspects required less complex scientific methods in favour of the users’ understanding of underlying assumptions behind the support applications (Rao, Citation2007). In our application, the use of fuzzy terms was limited to systematically converting inputs to the support method. The conversion of scores could perhaps be improved by modelling the membership functions for the fuzzy terms with experts and by carrying out a sensitivity analysis on the effect of the gradient and shifting of membership functions (Chou & Yuan, Citation1992). To enable the assessment of the effect of choosing certain rules, the decision-makers need to be provided with easy to interpret information. Weighing of individual questions may introduce more complexity. Another possibility to give some flexibility for setting the rules without necessarily introducing more factors (weights) would be, for example, instead of using the worst condition from at least one question to two or more reported questions.
7. Conclusions
The presented decision support method used the multi-criteria TOPSIS method to provide an indication of the functional status of check dams by aggregating the reported scores into indices. Check dams can have different functions in the system of protection works due to their influence on flow and sediment processes. Management organisations can optimise their use of human resources by, for example, having skilled volunteers inspect complementary check dam structures, while regular technicians teamed up with volunteers inspect more critical check dams. Regardless of these management choices, an important advantage of the decision support method is that it allows inspections by either skilled volunteers or technicians, while ensuring that responsible decision-makers can systematically evaluate the reports.
Participants in the workshop considered it fundamental for all volunteers to be well-trained. We suggest that quality control campaigns should be regularly carried out to evaluate the data that are being collected; for example, by asking at least three inspectors to inspect the same structure. In addition, technicians can carry out inspections campaigns teamed up with volunteers. In that way, technicians can benefit from understanding the local stream patterns from volunteers’ knowledge and volunteers can get additional training and experience on carrying out the inspections themselves.
By indicating the functional status at parameter level instead of a global index that aggregates the result of A, B and C parameters, compensation of extreme conditions or errors into an overall judgement for all parameters is avoided. Moreover, a sorting of structures is required to prioritise management actions. For such sorting, additional consideration should be given to combine outputs of preliminary inspections with other available knowledge about the relevant criteria at pre-screening level (Table ). Thereby, decision-makers can assess the results of the individual parameters from a broader perspective and then choose what action is to be taken. However, a balance between complexity and user-friendliness should be maintained for further development stages in the decision support method.
It is expected that the steps of the method as described in the design section can easily be adapted to other situations where an evaluation of qualitative data is required. Certainly, for other structures or in other regions, other questions will become relevant and it is suggested to develop the inspection form together with the users. However, the translation of the answers to indexes and the combination with expert-based rules can be applied in many situations. Future research should evaluate the use of this method for other types of hydraulic structures that may be relevant within a system of protection works. That is, for example, the case for culverts and box culverts in mountain basins, where blocking materials such as debris, large wood and other residues can aggravate flood hazard. An integrated monitoring approach based on the combination of visual inspections with available information from high-resolution images and sensors can be useful to handle limitations of the different methods.
Funding
This research was funded by the European Commission within the Marie Curie Research and Training Network ‘CHANGES: Changing Hydro-meteorological Risks as Analyzed by a New Generation of European Scientists’ [2011–2014, grant number 263953] under the 7th framework programme.
Disclosure statement
No potential conflict of interest was reported by the authors.
Acknowledgements
The authors would like to thank Civil Protection, technical services and local authorities of FVG, Forestry Service of the Autonomous Province of Trento, Basin Authority of the High Adriatic River and the students of the Università degli Studi di Trieste who participated in the research, for their collaboration. We also thank Dr Bruno Mazzorana and Dr Ronald van Nooyen for their comments. We finally acknowledge the support of the RiverCare Programme, which is part of the Netherlands Organization for Scientific Research under grant number P12-14 (Perspective Programme), to write this contribution.
References
- Almoradie, A., Cortes, V.J., & Jonoski, A. (2015). Web-based stakeholder collaboration in flood risk management. Journal of Flood Risk Management, 8, 19–38. doi:10.1111/jfr3.12076
- Cavalli, M., Trevisani, S., Comiti, F., & Marchi, L. (2013). Geomorphometric assessment of spatial sediment connectivity in small Alpine catchments. Geomorphology, 188, 31–41. doi:10.1016/j.geomorph.2012.05.007
- Chen, S.J., & Hwang, C.L. (1992). Fuzzy multiple attribute decision making: Methods and applications. New York, NY: Springer-Verlag. Retrieved from http://link.springer.com/book/10.1007%2F978-3-642-46768-4
- Chou, K.C., & Yuan, J. (1992). Safety assessment of existing structures using a filtered fuzzy relation. Structural Safety, 11, 173–189.
- Cortes Arevalo, V.J., Charrière, M., Bossi, G., Frigerio, S., Schenato, L., Bogaard, T., Bianchizza, C., Pasuto, A., & Sterlacchini, S. (2014). Evaluating data quality collected by volunteers for first-level inspection of hydraulic structures in mountain catchments. Natural Hazards and Earth System Science, 14, 2681–2698. doi:10.5194/nhess-14-2681-2014
- Curt, C., & Gervais, R. (2014). Approach to improving the quality of data used to analyse dams – Illustrations by two methods. European Journal of Environmental and Civil Engineering, 18, 87–105. doi:10.1080/19648189.2013.850188
- Curt, C., Talon, A., & Mauris, G. (2011). A dam assessment support system based on physical measurements, sensory evaluations and expert judgements. Measurement, 44, 192–201. doi:10.1016/j.measurement.2010.09.042
- Dabous, S.A., & Alkass, S. (2010). A multi-attribute ranking method for bridge management. Engineering, Construction and Architectural Management, 17, 282–291. doi:10.1108/09699981011038079
- D’Agostino, V., & Bertoldi, G. (2014). On the assessment of the management priority of sediment source areas in a debris-flow catchment. Earth Surface Processes and Landforms, 39, 656–658. doi:10.1002/esp.3518
- Dell’Agnese, A., Mazzorana, B., Comiti, F., Von Maravic, P., & D’Agostino, V. (2013). Assessing the physical vulnerability of check dams through an empirical damage index. Journal of Agricultural Engineering, 44, 9–16.
- Díez, E., & McIntosh, B.S. (2009). A review of the factors which influence the use and usefulness of information systems. Environmental Modelling & Software, 24, 588–602. doi:10.1016/j.envsoft.2008.10.009
- Dirksen, J., Clemens, F.H.L.R., Korving, H., Cherqui, F., Le Gauffre, P., Ertl, T., Plihal, H., Muller, K., & Snaterse, C.T.M. (2013). The consistency of visual sewer inspection data. Structure and Infrastructure Engineering, 9, 214–228. doi:10.1080/15732479.2010.541265
- Failing, L., Gregory, R., & Harstone, M. (2007). Integrating science and local knowledge in environmental risk management: A decision-focused approach. Ecological Economics, 64, 47–60. doi:10.1016/j.ecolecon.2007.03.010
- Holub, M., & Hubl, J. (2008). Local protection against mountain hazards – State of the art and future needs. Natural Hazards and Earth System Sciences, 8, 81–99. doi:10.5194/nhess-8-81-2008
- Holub, M., & Fuchs, S. (2009). Mitigating mountain hazards in Austria – legislation, risk transfer, and awareness building. Natural Hazards and Earth System Sciences, 9, 523–537. doi:10.5194/nhess-9-523-2009
- Hwang, C.L., & Yoon, K. (1981). Multiple attribute decision making-methods and applications. Berlin: Springer Verlag.
- Jakob, M., & Hungr, O. (2005). Debris flow phenomena. Berlin: Praxis.
- Janssen, J.A.E.B., Krol, M.S., Schielen, R.M.J., Hoekstra, A.Y., & de Kok, J.-L. (2010). Assessment of uncertainties in expert knowledge, illustrated in fuzzy rule-based models. Ecological Modelling, 221, 1245–1251. doi:10.1016/j.ecolmodel.2010.01.011
- Jonoski, A. (2002). Hydroinformatics as socioetchnology: Promoting individual stakeholder participation by using network distributed decision support systems. Lisse: UNESCO-IHE, Delft and Sweets and Zeitlinger.
- Junier, S., & Mostert, E. (2014). A decision support system for the implementation of the Water Framework Directive in the Netherlands: Process, validity and useful information. Environmental Science & Policy, 40, 49–56. doi:10.1016/j.envsci.2014.04.004
- Kabir, G., Sadiq, R., & Tesfamariam, S. (2014). A review of multi-criteria decision-making methods for infrastructure management. Structure and Infrastructure Engineering, 10, 1176–1210. doi:10.1080/15732479.2013.795978
- Mazzorana, B., Comiti, F., Scherer, C., & Fuchs, S. (2012). Developing consistent scenarios to assess flood hazards in mountain streams. Journal of Environmental Management, 94, 112–124. doi:10.1016/j.jenvman.2011.06.030
- Mazzorana, B., Simoni, S., Kobald, J., Formaggioni, O., & Lanni, C. (2015). Material intrusion as a key factor for the physical vulnerability of the built environment to debris flows. In Engineering Geology for Society and Territory (Vol. 5, pp. 747–751). Springer International Publishing. Retrieved from http://link.springer.com/chapter/10.1007/978-3-319-09048-1_145#page-1
- Mazzorana, B., Trenkwalder-Platzer, H.J., Fuchs, S., & Hübl, J. (2014). The susceptibility of consolidation check dams as a key factor for maintenance planning. Österreichische Wasser- Und Abfallwirtschaft, 2014, 214–216.
- McIntosh, B.S., Ascough, J.C., II, Twery, M., Chew, J., Elmahdi, A., Haase, D., Harou, J.J., Hepting, D., Cuddy, S., Jakeman, A.J., Chen, S., Kassahun, A., Lautenbach, S., Matthews, K., Merritt, W., Quinn, N.W.T., Rodriguez-Roda, I., Sieber, S., Stavenga, M., Sulis, A., Ticehurst, J., Volk, M., Wrobel, M., van Delden, H., El-Sawah, S., Rizzoli, A., & Voinov, A. (2011). Environmental decision support systems (EDSS) development – Challenges and best practices. Environmental Modelling & Software, 26, 1389–1402.
- Najafi, M., & Bhattachar, D.V. (2011). Development of a culvert inventory and inspection framework for asset management of road structures. Journal of King Saud University – Science, 23, 243–254. doi:10.1016/j.jksus.2010.11.001
- Pardo-Bosch, F., & Aguado, A. (2015). Investment priorities for the management of hydraulic structures. Structure and Infrastructure Engineering, 11, 1338–1351. doi:10.1080/15732479.2014.964267
- Patel, D.P., Gajjar, C.A., & Srivastava, P.K. (2013). Prioritization of Malesari mini-watersheds through morphometric analysis: A remote sensing and GIS perspective. Environmental Earth Sciences, 69, 2643–2656. doi:10.1007/s12665-012-2086-0
- Provincia Autonoma di Bolzano – Alto Adige. (2006). Bestandsaufnahme von wasserbauwerken der wildbachverbauung. EF 30 – EF30 Sperrenevaluierung Quick Version [Evaluation of check dam vulnerability EF 30 - quick & full version]. Ripartizione 30. Opere idrauliche. Azienda speziale per la regolazione dei corsi d’acqua e la difesa del suolo.
- Raghu, V., & Reddy, M.K. (2011). Hydrogeomorphological mapping at village level using high resolution satellite data and impact analysis of check dams in part of Akuledu Vanka Watershed, Anantapur District, Andhra Pradesh. Journal of Indian Geophysical Union, 15(1), 1–8.
- Rao, R.V. (2007). Decision making in the manufacturing environment: Using graph theory and fuzzy multiple attribute decision making methods. London: Springer Science & Business Media.
- Rashidi, M., & Lemass, B. (2011). A Decision support methodology for remediation planning of concrete bridges. Journal of Construction Engineering and Project Management, 1(2), 1–10. doi:10.6106/JCEPM.2011.1.2.001
- Rhee, C., & Raghav Rao, H. (2008). Evaluation of decision support systems. In F. Burstein, C. Holsapple (Eds), Handbook on decision support systems 2 (pp. 313–328). Berlin Heidelberg: Springer.
- Saaty, R.W. (1987). The Analytic hierarchy process – What it is and how it is used. Mathematical Modelling, 9, 161–176.
- Sahely, H.R., Kennedy, C.A., & Adams, B.J. (2005). Developing sustainability criteria for urban infrastructure systems. Canadian Journal of Civil Engineering, 32, 72–85. doi:10.1139/l04-072
- Schweckendiek, T., Vrouwenvelder, A.C.W.M., & Calle, E.O.F. (2014). Updating piping reliability with field performance observations. Structural Safety, 47, 13–23. doi:10.1016/j.strusafe.2013.10.002
- Serre, D., Peyras, L., Maurel, P., Tourment, R., & Diab, Y. (2009). A spatial decision support system aiding levee managers in their repair and maintenance planning. Journal of Decision Systems, 18, 347–373. doi:10.3166/jds.18.347-373
- Servizio Forestale FVG. (2002). Catasto Opere Idraulico Forestali. Manuale Tecnico. Allegato A. Schede di Rilevo [Cadastral of forestry service’s hydraulic structures. Technical manual. Annex A. Inspection forms]. Direzione Regionalle delle Foreste. Servizio della Tutella del Suolo Montano.
- Suda, J., Strauss, A., Rudolf-Miklau, F., & Hübl, J. (2009). Safety assessment of barrier structures. Structure and Infrastructure Engineering, 5, 311–324. doi:10.1080/15732470701189498
- Sun, L., & Wenjun, G. (2011). Pavement condition assessment using fuzzy logic theory and analytic hierarchy process. Journal of Transportation Engineering, 137, 648–655. doi:10.1061/(ASCE)TE.1943-5436.0000239
- Swets, J.A. (1988). Measuring the accuracy of diagnostic systems. Science, 240, 1285–1293. doi:10.1126/science.3287615
- Tagherouit, W.B., Bennis, S., & Bengassem, J. (2011). A fuzzy expert system for prioritizing rehabilitation of sewer networks. Computer-Aided Civil and Infrastructure Engineering, 26, 146–152. doi:10.1111/j.1467-8667.2010.00673.x
- Ten Veldhuis, J.A.E., Harder, R.C., & Loog, M. (2013). Automatic classification of municipal call data to support quantitative risk analysis of urban drainage systems. Structure and Infrastructure Engineering, 9, 141–150. doi:10.1080/15732479.2010.535543
- Uzielli, M., Nadim, F., Lacasse, S., & Kaynia, A.M. (2008). A conceptual framework for quantitative estimation of physical vulnerability to landslides. Engineering Geology, 102, 251–256. doi:10.1016/j.enggeo.2008.03.011
- Valentinotti, R. (2012). A spatial decision support system to assess debris-flow hazard and risk. Paper presented at the 12th Congress INTERPRAEVENT 2012, Grenoble, France.
- Van der Steen, A.J., Dirksen, J., & Clemens, F.H.L.R. (2014). Visual sewer inspection: Detail of coding system versus data quality? Structure and Infrastructure Engineering, 10, 1385–1393. doi:10.1080/15732479.2013.816974
- Van Riel, W., Langeveld, J.G., Herder, P.M., & Clemens, F.H.L.R. (2014). Intuition and information in decision-making for sewer asset management. Urban Water Journal, 11, 506–518. doi:10.1080/1573062X.2014.904903
- Von Maravic, P. (2010). Evaluation of the physical vulnerability of check dams exposed to the impact of torrential processes through experimental analysis ( Msc thesis). Faculty of Agriculture. Departments of Land and Agro-forestry Systems University of Padova, Italy.
- Vuillet, M., Peyras, L., Serre, D., & Diab, Y. (2012). Decision-making method for assessing performance of large levee alignment. Journal of Decision Systems, 21, 137–160. doi:10.1080/12460125.2012.680354
Appendix 1
Table A1. Reported ratings and aggregated indices for check dam 1.
Notes: Table provides details about the questions and rating code
VG: Very good; G-VG: Good to very good, FS: Fair sufficient; F: Fair; FD: Fair deficient; P: Poor; P-VP: Poor to very poor; and VP: Very poor.
*For a consolidation dam (Check dam 1), questions B1 and B2 do not apply.
Table A2. Reported ratings and aggregated indices for check dam 2.
Notes: Table provides details about the questions and rating code.
VG: Very good; G-VG: Good to very good, FS: Fair sufficient; F: Fair; FD: Fair deficient; P: Poor; P-VP: Poor to very poor; and VP: Very poor.
Table A3. Reported ratings and aggregated indices for check dam 3.
Note: Table provides details about the questions and rating code.
VG: Very good; G-VG: Good to very good, FS: Fair sufficient; F: Fair; FD: Fair deficient; P: Poor; P-VP: Poor to very poor; and VP: Very poor
Table A4. Participants’ agreement about the usefulness of the method
Notes: Figure provides an overview of participants’ agreement
Participants rated their level of agreement from −3 (full disagreement) to +3 (full agreement)
The difference in participants’ number was because not all participants attended the second-day programme and one participant did not fill in the second-day feedback.
Table A5. Overview of participants’ suggestions for improvements in the inspection form.
Notes: *The decision support methodology considers only the responses to the questions about the functional status (see Table ). Other sections were only used as background information for the inspection.

