
 ?Mathematical formulae have been encoded as MathML and are displayed in this HTML version using MathJax in order to improve their display. Uncheck the box to turn MathJax off. This feature requires Javascript. Click on a formula to zoom.
Abstract
Unmanned Aerial Vehicles (UAV) technology has found its way into several civilian applications in the last 20 years, predominantly due to lower cost and tangible scientific improvements. In its application to structural bridge inspection, UAVs provide two main functions. The first, being the most common, detect damage through visual sensors. The 2 D image data can be used to quickly establish a basic knowledge of the structure's condition and is usually the first port of call. The second reconstructs 3D models to provide a permanent record of geometry for each bridge asset, which could be used for navigation and control purposes. However, there are various types of hazards and risks associated with the use of UAVs for bridge inspection, in particular, in a cold operating environment. In this study, a systematic methodology, which is an integration of hazard identification, expert judgment, and risk assessment for preliminary hazard analysis (PHA) in the UAV-assisted bridge inspection system is proposed. The proposed methodology is developed and exemplified via UAV-assisted inspection of Grimsøy bridge, a 71.3 m concrete bridge, located in the Viken county in eastern Norway.
1. Introduction
Bridge inspections are conducted to identify potential changes from historical structural reports, as well as to assess the current conditioning of bridge elements to ensure the asset is safe and meets service requirements. Regular inspection also detects structural damage early, when it can be repaired at the lowest possible cost (NCHRP, Citation2017). However, different types of bridges require diverse inspection procedures and, pose different challenges. Further, the inability to effectively and systematically identify and measure damage in bridges can lead to acceleration and dangerous deterioration of the health state of these structures. In general, the issue can be categorised into two: the difficulty to visually identify damage; and, the late response and care of severe or irreparable damage (Ayele & Droguett, Citation2019; Jung, Lee, & Kim, Citation2018; Maldonado, Casas, & Canas, Citation2019). Several studies emphasize the need to contemplate advanced inspection and monitoring technologies to implement systematic inspection and permanent monitoring of the state of the bridge structures; see e.g. Yonas Zewdu Ayele (Citation2019), Maldonado et al. (Citation2019), Phares, Rolander, Graybeal, and Washer (Citation2001), and Liu, Frangopol, and Kim (Citation2009).
Unmanned Aerial Vehicles (UAV), commonly known as a drone, has found its way into several civilian applications in the last 20 years, predominantly due to lower cost and tangible scientific improvements. In its application to structural bridge inspection, UAVs provide two main functions. The first, being the most common, detect damage through visual sensors. The 2D image data can be used to quickly establish a basic knowledge of the structure's condition and is usually the first port of call. The second reconstructs 3D models to provide a permanent record of geometry for each bridge asset, which could be used for navigation and control purposes. The addition of 3D capabilities to bridge management allows navigation through a complex structure, providing visual identification of the area of concern rather than solely relying on reference names or numbers. Models can either be constructed through photogrammetry or by assembling a spatial point cloud using laser scanners. However, previous problems included low-quality image and video capabilities, are notably sensitive under poor lighting conditions and high wind speeds; see e.g. Jung et al. (Citation2018) and Foreman, Favaró, Saleh, and Johnson (Citation2015).
UAV–assisted bridge inspection will increasingly require interactions with an array of existing users of that airspace, such as general aviation aircraft, helicopters, etc. (Belcastro et al., Citation2017). However, the safety of these existing operations cannot be reduced by the introduction of the new UAV–assisted operations. Furthermore, humans are “designed” to operate in very narrow temperature range; and, thus, wind, icing, and darkness reduce the operational effectiveness considerably, and the possibility of mistakes or being inaccurate increases during UAV-flights (Ayele, Barabadi, & Barabady, Citation2016; Barabadi & Markeset, Citation2011; Gudmestad et al., Citation2007; Kumar, Barabady, Markeset, & Kumar, Citation2009; Markeset, Citation2008). In other words, the cold operational environments that are common for instance, in northern Europe, such as Norway, have a significant effect on the performance of the UAVs and UAV-pilots, and this magnifies the hazards associated with UAV–assisted bridge inspections.
The identification of potential hazards and associated risks for the emerging UAV operations have been the subject of several publications; see e.g. Belcastro et al. (Citation2017), Maldonado et al. (Citation2019), Burdett, Stoker, and Simpson (Citation2009), Wackwitz and Boedecker (Citation2015), Hayhurst, Maddalon, Miner, DeWalt, and McCormick (Citation2006), Clothier and Walker (Citation2015). For instance, Belcastro et al. (Citation2017) addressed the identification of current and future hazards associated with small unmanned aircraft systems (sUAS) operations within a UTM (UAS traffic management) system. Hayhurst et al. (Citation2006) have discussed hazards associated with UAV operations, by categorizing the hazards into three domains – the UAV Design Domain, the UAV Flight Crew Domain, and the UAV Operational Domain. Moreover, Hashem Izadi, et al (Moud et al., Citation2018) have proposed a qualitative risk assessment for UAV flights by combining the Federal Aviation Administration (FAA) rules, regulations, and guidelines concerning UAV flights, with the safety needs and specifications of UAV flights on a construction job site. Furthermore, there are recent efforts to employ high-level AI techniques such as deep learning for hazard identifications, see e.g. (Cha, Choi, & Büyüköztürk, Citation2017; Cha, Choi, Suh, Mahmoudkhani, & Büyüköztürk, Citation2018; Kang & Cha, Citation2018).
However, in most of the available hazard and risk assessment literature discussed above, the operational hazard is the predominant factor considered; and there is a lack of consideration of the impact of the operating environment on the hazard and overall risk profile. This is considered a significant drawback, especially in a complex operational environment such as a cold operating environment. Further, there is a lack of detailed PHA for UAV-assisted bridge inspection, by considering operational, technical, and environmental-related potential hazards that affect the performance of UAVs and UAV-pilots directly. Moreover, those potential hazards that effects the performance of UAVs and UAV-pilots indirectly such as regulation are not highlighted enough. In addition, using UAVs for bridge inspection still considered being at an early stage from a practical point of view and more systematic and reliable hazard identification and risk assessment methods are needed, see e.g. (Ciampa, De Vito, & Pecce, Citation2019; Rakha & Gorodetsky, Citation2018; Seo, Wacker, & Duque, Citation2018).
Based on the above discussion, it is an important requirement to consider the impact of the operating environment when identifying hazards associated with UAV-assisted bridge inspection. In this paper, a new PHA methodology is proposed, which considers the complex nature of the cold operating environment. The proposed methodology is an integration of the analytical hierarchy process, expert judgment, and risk assessment for ranking the operational, technical, and environmental hazards associated with UAV-assisted bridge inspection. Moreover, the likelihood of the potential hazards and their consequence is estimated and presented in a structured format. Furthermore, the consistency index (CI), which is the index of the consistency, quality, and validity of expert judgments is presented, and discussed.
The rest of the paper is organized as follows: Section 2 discusses key stages in the proposed PHA methodology for UAV-assisted bridge inspection. Section 3 exemplifies the proposed PHA methodology via UAV-assisted inspection of Grimsøy bridge, a 71.3 m concrete bridge, located in the Viken county in eastern Norway. Lastly, Section 4 provides some concluding remarks.
2. Methodology for holistic preliminary hazard analysis of UAV-assisted bridge inspection
As such, a core requirement in Preliminary Hazard Analysis (PHA) is the identification of the hazards, which the UAV might encounter during its life cycle. In order to formulate combined hazard set, each of the potential hazards that have impact on the UAV systems and UAV pilots need to be determined. The term “hazard”, in the context of this paper, is: “any real or potential condition that can cause: injury, illness, or death to people; damage to or loss of a system, equipment, or property; or damage to the environment (Belcastro et al., Citation2017)”. illustrates the proposed PHA methodology; and, specific stages that help the hazard and risk analyst to: (i) identify all potential hazards and undesirable events that may lead to an accident, (ii) rank the identified undesirable events according to their probability and severity, (iii) identify required hazard controls and follow-up actions.
Figure 1. Methodology for preliminary hazard analysis for UAV-assisted bridge inspection based on the analytical hierarchy process.
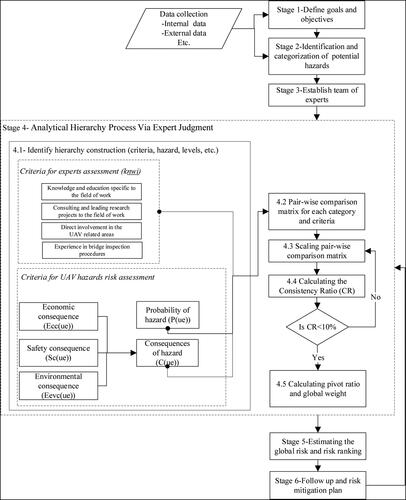
2.1. Stage 1: defining the goals and objectives
As mentioned above, in this study, the goal is to conduct a PHA for UAV-assisted bridge inspection. To achieve this goal, firstly the potential hazards need to be identified and then ranked based on their importance. Thereafter, focus would be on the most important hazard to find the most suitable plan of action and risk mitigation. Further, the PHA is mainly aiming the UAV operations in the cold operating environment. However, there is a lack of historical data in this particular operating environment. Henceforth, to conduct a PHA for UAV-assisted bridge inspection the concept of the Analytical Hierarchy Process (AHP) is used, and a team of experts is selected and their expert judgment and knowledge is aggregated. Also, the AHP is supported by available field data from past UAV bridge inspection.
2.2. Stage 2: identification and categorization of potential hazards
When identifying and categorizing hazards, a reasonable effort has been made to identify those that will have the most significant implications on the strategic decision. Identifying hazards in the UAV-assisted bridge inspection involves finding things and situations that could potentially cause harm to people involved in the UAV system, etc. Hazards, during the UAV-assisted bridge inspection generally arise from the following aspects of work and their interaction: operators, physical work environment; equipment and materials used; inspection tasks and how they are performed; and bridge inspection design and management of UAVs. Further, when assessing hazards associated with the UAV-assisted bridge inspection in cold regions, including Norway, the effect of the operating environment needs to be analysed thoroughly. This is because the cold operating environment is one of the dominant factors, which influences the performance of the inspectors, the function of UAVs, and then consequently increases the hazards.
2.3. Stage 3: establishing the team of experts
The core for the AHP is to set up a team of experts to identify the potential hazards and conduct risk assessment by estimating the probabilities and consequences of the potential hazards, etc.
2.3.1. Selecting the experts
One can use the criteria suggested by Ortiz et al. (Citation1991) regarding how to select experts. Based on Ortiz et al. (Citation1991) experts should be sellected collectively to represent a wide variety of backgrounds and knowledge. Based on this, here the experts have been chosen by referring to their: (i) knowledge and education specific to the field of work, (ii) consulting and leading research projects to the field of work, (iii) direct involvement in the UAV related areas and, (iv) experience in bridge inspection procedures.
2.3.2. Posing questions to the experts
At this stage, the questionnaires should be stetted by describing the potential hazards and undesirable events. Some of the factors that need to be taking into account while preparing the questionnaires are detailed.
2.3.3. The quality of the expert judgements
Hora (Citation2009) has pointed out that degree-of-belief probabilities are personal. In addtion, these probabilities differ from expert to expert and from time to time. This leads us that there is no “true” probability that one might use as a measure of the accurateness of a single elicited probability. Thus, for crosschecking the goodness of the probabilities from experts, one can employ the Consistency Ratio (CR), see Section 2.4.4.
2.3.4. Aggregating the expert judgements
There are several methods to aggregate individual opinions exist based on specific usage and specific goal, see e.g. (Benamara, Kaci, & Pigozzi, Citation2010; Lu, Lan, & Wang, Citation2006; Ramanathan & Ganesh, Citation1994). For example, one of the most used methods is Aggregation of Individual Judgments (AIJ), where once the individual comparison matrices of every agent in a concrete node are known, it is possible to calculate an aggregated comparison matrix for the group at this node.
2.4. Stage 4: analytical hierarchy process (AHP) via expert judgment
AHP refers to the decomposing of elements related to decision making into goals, criteria, and hazards. The AHP is more suitable for the target system with hierarchical interlaced evaluation indicators, and the target value is difficult to quantitatively describe the problem. The overall hierarchy process is explained in the following key steps.
2.4.1. Identify hierarchy construction and defining criteria
In this step, one should specify the criteria that are important to reach the stated goal. To construct the hierarchy of AHP in this stage, the criteria for risk assessment of identified potential hazards as probability and consequences of potential hazards (see ) are identified. Also, for consequences of potential hazards are categorized into three sub-criteria: (i) safety consequences, (ii) economic consequences and (iii) environmental consequences. Each criterion is pairwise compared to gets an average overall score (total weight of criteria k, see Section 2.4.5). On the other hand, four criteria for expert assessment are used: (i) knowledge and education specific to the field of work, (ii) consulting and leading research projects to the field of work, (iii) direct involvement in the UAV related areas and, (iv) experience in bridge inspection procedures. Each expert is pairwise compared to each of these criteria and gets an average overall score (see section 3.3.1). In this way, one can construct the hierarchy of analytical process based on identified goals and criteria. Thereafter, based on the overall hierarchy of AHP, one can quantify the importance of each criterion and rank them accordingly.
2.4.2. Pair-wise comparison matrix for each category
As mentioned above, the main idea of the analytic hierarchy process is to compare the importance degree between the two factors to establish a judgment matrix where the dimensions of the matrix depend on the number of criteria. In this paper, it is suggested to establish two matrices; one for expert assessment and one for risk assessment criteria. In general, a comparison judgment matrix, A, can be expressed as:(1)
(1) where:
is the comparison weight between criteria i and j.
2.4.3. Scaling pairwise comparison matrix
To derive the priorities matrix, verbal statements (comparisons) need to be converted into integers. Different scales for pairwise comparison in AHP can be used such as standard AHP linear scale, logarithmic scale, root square scale, power scale, geometric scale, and fuzzy scales. There is no theoretical reason to be restricted to these fundamental AHP scales and verbal gradations, one can have its scales based on some specific logic. Moreover, in this study for defining the scale criteria, there is a need to define the system's mission. The system's mission can be defined as the ability of a given UAV to carry on visual inspection of any bridge within a certain time and a certain standard. The success and failure of the mission can be defined as follows:
Mission success: UAV completes the mission and gathers the required data within the acceptable standards and return to base intact.
Mission failure: UAV cannot fulfil the minimum data required for the inspection process or the UAV is destroyed during the mission.
2.4.4. Calculating the consistency ratio (CR)
Unfortunately, decision-makers do not normally make “perfect” judgements, and therefore it is necessary to check if judgements are logically consistent. In the AHP, consistency index (CI), which is the index of the consistency of judgements across all pairwise comparisons measures the quality of expert judgments (Lootsma, Citation1991). To explain consistency in a simple word, consider a person who likes banana twice apple and orange twice banana, in logical way he would like orange four times higher than apple, if he ranks apple higher than orange in second comparison he is inconsistent in his judgment. Many researches have shown that when CR < 0.1 it is considered that the judgment matrix is consistent, otherwise pairwise comparison matrix need to be appropriately corrected (Tummala & Ling, Citation1996, Citation1998; Tummala & Wan, Citation1994; Tung & Tang, Citation1998). CR can be estimated as follows:(2)
(2) where:
CI is the consistency indicator,
RI is random index (see in Supplementary Material Appendix I).
In the same approach, one can estimate the CI as follows:(3)
(3) where:
n is the number of criteria.
For instance, if any given expert is consistent in his/her evaluation, then the matrix A will be equal to which is an eigenvector. In addition, the eigenvector corresponding to the largest eigenvalue of the matrix (
) as the importance degree of different criteria can be estimated as follows:
(4)
(4) where:
Having the CR can be calculated and check if it is less than 10% then, the normalized average weight of each criterion can be used as its importance weight.
2.4.5. Calculating pivot ratio and global weight
Since experts are scaling each category separately to unify the results from different experts, in this step, a pivot ratio should be estimated. Pivot ratio () is calculated by putting one representative hazard from one category to another category and compare it pairwise by all the hazards in that category. By dividing the average weight of the same representative hazard into two different categories. The pivot ratio that connects the importance of both categories related to each other can be estimated as follows:
(5)
(5) where:
Thereafter, one can estimate the total weight of criteria k, as follows:
(6)
(6) where:
Subsequently, the global weight () which is the total importance weight of criteria k can be estimated as follows:
(7)
(7) where:
2.5. Stage 5: risk assessment
In this stage, one can describe the risk as a function of undesirable events, subjective probability of the undesirable events, consequences of the undesirable events, etc. Such description of the risk is beneficial, in particular in the cold operating environment, since there is lack of data and information. The risk function can then be estimated as follows, based on Aven, Renn, and Rosa (Citation2011):(8)
(8) where:
A represents the potential hazard,
C the consequences of A,
U refers to uncertainty factors not covered by
K is the background knowledge that the estimate and uncertainty description is based on.
2.6. Stage 6: follow up and risk mitigation plan
Once the global risk has been estimated, in this stage, the risk mitigations or safeguards need to be in place. Safeguards could be a course of action that needs to be implemented for reducing the impact of potential hazards. For instance, in the case of low temperature, one can put safeguards measures such as preheating the battery of the drone to prevent the battery from dying while flying. In the same aspect, the drone operator can use personal protective equipment for reducing the negative impact of low temperature.
3. An illustrative case study - Grimsøy bridge, Norway
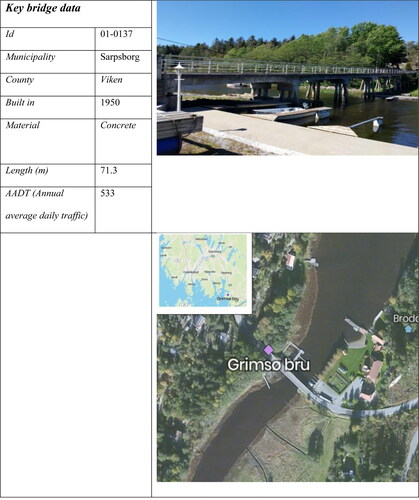
The proposed methodology is exemplified via UAV–assisted bridge inspection of Grimsøy bridge, which is located in the Viken county, in the eastern part of Norway. Grimsøy bridge ensures road connection out to Grimsøy, which is a peninsula in Skjeberg, Viken county. It is situated at Latitude: 59.1355° or 59° 8′ 7.7" north and Longitude: 11.2011° or 11° 12′ 3.9" east, and with Elevation: 15 meters above sea level. The bridge is a concrete slab bridge supported by concrete pillars in the relatively shallow water. The bridge is constructed in a typical coastal landscape but lies in a wedge without exposure to the sea. illustrates an overall view and location and structure description of Grimsøy Bridge.
Figure 2. Overall view and location and structure description of Grimsøy bridge.
3.1. Stage 1: defining the goals and objectives
The basic assumptions in this study are a year-round UAV operational window and, the fact that the UAV-assisted inspection is carried out in Norway. Since employing UAV for bridge inspection is relatively new, there is a lack of historical failure rate data for the UAV system. Hence, judgments provided by those people with expertise in identifying potential hazards and risks of undesirable events are utilized at various stages of this hazard analysis to perform effective hazard identification and quantification. Their expertise is used to analyses historical information, define and analyses potential hazards, and evaluate the probability, consequence, and risk of undesirable events.
3.1.1. Data collection – UAV flights
The DJI Matrice 100 drone with Zenmuse Z3 aerial zoom camera with 7X zoom capacity is used, for carrying out the drone-assisted inspection. This particular drone was chosen based upon distinctive features such as flight time, camera resolution, video resolution, and others. Trailed autonomous control is tested by using Z3 cameras and sensors, which can help the drone to autonomously avoid obstacles or simply hold altitude in a GPS-denied environment. Other equipment used are DJI Phantom 4 Pro V2.0, DJI remote controllers, landing platform, GPS antenna & handheld, total stations, tripods, spare batteries, blades; I-pad & connection wires to drone remotes; safety helmets, safety boots & reflective jackets, and tapes & markers. depicts tools and equipment used during the drone-assisted inspection. illustrates the level of details obtained from the drone-based imaging for Grimsøy bridge.
Figure 3. Tools and equipment used during drone-assisted inspection.
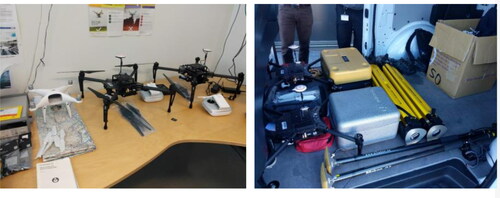
Figure 4. (a) Grimsøy Bridge top view; (b) UAV image of Grimsøy Bridge near top deck; (c) UAV image of Grimsøy Bridge near foundation; (d) UAV image of Grimsøy bridge showing bridge columns and supports.

3.2. Stage 2: identification and categorization of potential hazards
Based on the data collection stage from different sources as well as data from the field identified potential hazards were categorized into two categories, direct group and indirect group. Direct groups include those potential hazards that have a direct physical connection with the UAV-assisted bridge inspection system. The indirect group includes those potential hazards that do not have a direct physical connection with the UAV-assisted bridge inspection system but their decisions and actions will affect the UAV-assisted bridge inspection system. The indirect group category includes: (i) regulatory agencies, (ii) insurance companies and (iii) third parties which are anyone who is interested and using the bridges in the indirect group (see ).
Table 1. The predominant direct and indirect actors and categorization of potential hazards.
3.3. Stage 3: establishing the team of experts
3.3.1. Selecting the experts
As mentioned in the Section 2.4.1 four criteria for expert assessment are used including; i) knowledge and education specific to the field of work, ii) consulting and leading research projects to the field of work, iii) direct involvement in the UAV related areas and, iv) experience in bridge inspection procedures. Therefore, to calculate the global weight for each expert can be done by adding each criteria weight for an expert i using the following equation:(9)
(9) where:
Adding the average weights of each criterion for expert assessment, which is coming from a consistent normalized matrix, total weight for each expert can be estimated.
3.3.2. Posing questions to the experts
To facilitate the AHP the surveys are set by reciting the likely hazards and unwanted events. An excel file with all identified potential hazards matrices in different categories based on identified criteria for example environmental and operator-related hazards was prepared to get the data from each expert. The hazards risk assessment criteria are used as guidance, in the term of probability and consequences (safety, economic, and environmental consequences). Then after, a step by step guideline was established for experts to understand how correctly fill the excel file was distributed. In addition experts would be guided when there was ambiguity for them.
3.3.3. The quality of the expert judgements
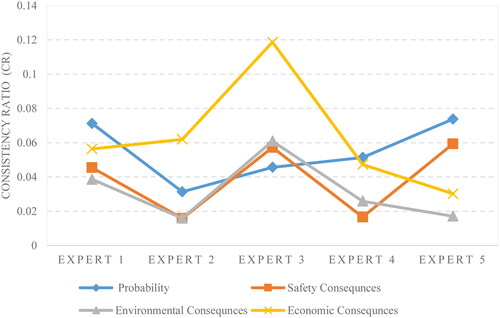
As mentioned above, for crosschecking the goodness of expert judgments, one can estimate the Consistency Ratio (CR). The CR which is an indicator for the consistency of the experts while assigning the probabilities for each potential hazard is used to approve the judgment of experts (see ).
Figure 5. CR values of the five experts related to the risk criteria.
3.3.4. Aggregating the expert judgements
In this study, the criteria for risk assessment are probability and consequences (safety, economic, and environmental consequences). In this study, weights of sub-criteria are used to infer the total consequences of each potential hazard. Therefore, the global weights for probability, and consequences criteria,
are estimated, respectively, as:
(10)
(10)
(11)
(11) where:
3.4. Stage 4: analytical hierarchy process via expert judgment
Based on methodology proposed in previous section, those steps will be followed to conduct a PHA for UAV-assisted bridge inspection system.
3.4.1. Identify hierarchy construction and defining criteria
The objectives already in the first step is identified which is conducting a PHA for UAV-assisted bridge inspection systems and also the hierarchy and criteria in proposed methodology are already constructed.
3.4.2. Pair-wise comparison matrix for each category
After all criteria identified and categorized pairwise comparison matrix can be established by putting them in row and columns. is the pairwise comparison matrix of environmental related hazrards which is scaled by an expert.
Table 2. Pairwise comparison matrix and its scales for probability citeria.
Table 3. Normalized pairwise comparison matrix.
3.4.3. Scaling pairwise comparison matrix
In this study, fundamental AHP comparison scales from 1 to 9 for all criteria is used (see Supplementary Material Appendix II, Appendix III and Appendix IV). is an example of pairwise comparison matrix and its scales for potential hazards in environmental related category for the probability criteria. In general, comparison matrix is a symmetric matrix, which means that having scale of one pairwise compared criteria the other one is reverse of the given scale.
Based on the results from for one expert low temperature is 3 times more probable to affect the UAV operation than ice and snow. Further, for the same expert, low temperature is however 5 times more probable to affect the UAV operation than darkness as well as 9 times more probable to affect the UAV operation than disruptions of vision due to direct sun exposure.
3.4.4. Calculating the consistency ratio (CR)
In this study, for calculating consistency ratio, firstly pairwise comparison matrix is normalized, thereafter its eigenvalue () is calculated as follows:
(12)
(12) where:
Based on EquationEquation (12)(12)
(12) eigenvalue (
) for the normalized pairwise comparison matrix is estimated as 7.3999. In the same principle, based on EquationEquation (3)
(3)
(3) , the CI is estimated equal to 0.0666, and, the CR based on EquationEquation (2)
(2)
(2) is estimated to be 0.0505. From these analyses, it can be deduced that the CR is less than 10% henceforth, the judgments from this particular expert are accepted for the probability criteria (see the Supplementary Material for a detailed analysis). Furthermore, to compare the quality and consistency of experts, the CR values are estimated for the five experts that are involved in this study and the result is depicted in .
From the CR results () it can be deduced that Expert 3 is less consistent in his judgments since its consistency ratio is higher than 10% in economic consequence criteria and has overall higher inconsistency. Interestingly, based on expert assessment criteria, Expert 3 is assigned a lower overall weight () compared to other experts.
3.4.5. Calculating pivot ratio and global weight
As mentioned in Section 2.4.5 the pivot ratio is used to link different categories weight together and estimate the global weights for each potential hazard. presented the estimated global normalized weights as accumulating value of both the probabilities and consequences. The consequences, in the accumulated values, include the safety, economic and environmental consequences of the identified potential hazards for UAV-assisted bridge inspection. As discussed above, for estimating the probability and consequences of potential hazards, EquationEquations (10)(10)
(10) and Equation(11)
(11)
(11) are employed, respectively. Further, for estimating the risk EquationEquation (13)
(13)
(13) is employed.
Figure 6. Global weights of probability and consequences of potential hazards.
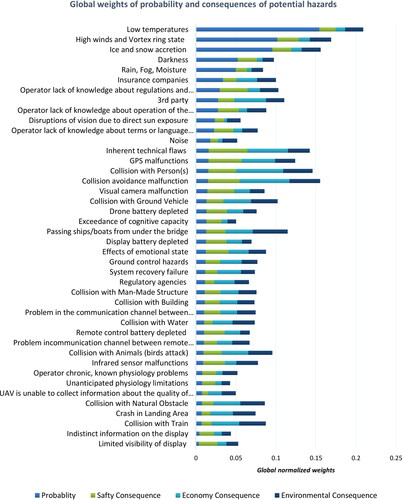
Based on the results () it can be inferred that low temperature has significantly higher global weights for the probability. To be more specific, for the low temperature its:
Global probability weight is estimated to be 0.15434;
Global safety consequence weight estimated to be 0.02024;
Global economy consequence weight estimated to be 0.01192;
Global environmental consequence weight estimated to be 0.02256.
To estimate the overall normalized weight of the low temperature, each of the above weights will be multiplied and the resulted weight estimated to be 0.20906. It means that the global normalized weight of the low temperature is more than 4.2 times higher than the global normalized weight of limited visibility hazard, for instance. Furthermore, based on the result, , it can be concluded that among the most probable potential hazards for UAV-assisted bridge inspection in cold environment operating systems, the following environmental-related hazards possess a high normalized probability weight i.e. they possess a high rate of occurrence and may lead to issues for UAV-operations:
Rank 1: Low temperature with an estimated normalized probability weight of 0.15434,
Rank 2: High wind with an estimated normalized probability weight of 0.10184,
Rank 3: Ice and snow with an estimated normalized probability weight of 0.09554, and
Rank 4: darkness with an estimated normalized probability weight of with 0.05225
3.5. Stage 5: risk assessment
Due to the lack of information in UAVs operation in a cold operating environment, in this study, the subjective (knowledge-based, judgmental) probability perspective for risk description is used. Once the probability and consequences
of potential hazards are estimated then the risk profile can be described as:
(13)
(13) where:
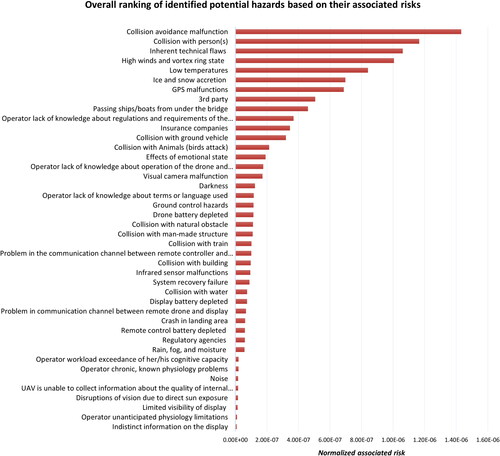
illustrates the overall ranking of the identified potential hazards based on their associated risk which is estimated based on EquationEquation (13)(13)
(13) . From the result, it can be deduced that the cold operating related hazards such as low temperature and ice and snow are listed on the top of the risk rank i.e. hazards with high risks. For instance, the estimated risk of low temperature is about 10 times more comparing to risk due to a lack of knowledge about terms or language. The highest estimated risk is the risk due to collision avoidance malfunction, with a risk value of 1.43157E-06, see Supplementary Material Appendix V for more details.
Figure 7. Overall ranking of identified potential hazards for UAV-assisted bridge inspection system in cold environment based on their associated risk.
3.6. Stage 6: follow up and risk mitigation plan
presenting the various plan of actions for safeguarding and mitigating the risk, based on the identified potential hazards for UAV-assisted bridge inspection.
Table 4. Plan of actions for safeguarding and mitigating the risk for UAV-assisted bridge inspection.
4. Conclusions
UAV deployment in bridge inspection could potentially save time and money. However, it also has various shortcomings. In this study, a practical methodology for preliminary hazard analysis for UAV-assisted bridge inspection is proposed. The proposed PHA identifies and quantifies the risk of the hazards related to operational, technical, and environmental aspects, which are due to the effects of cold and harsh environments. The proposed PHA recognizes the impact of potential hazards on the performance of UAVs and UAV-pilots and creative quantitative interpretation of the hazard factors of identifiable problems.
The findings from the case study are as follows:
The proposed PHA is beneficial as it provides a simple proof of concept that assist the decision-makers to be able to recognize, how cold weather affects the UAV systems and human performance and consequently adjusts management and operational tools and approaches while planning UAV-assisted bridge inspection.
From the case study results, it inferred that UAV-assisted bridge inspections are significantly affected by several environmental-related hazards such as high winds and vortex ring state with 1.00501E-06 associated risk, low temperature with 8.40E-07 associated risk, and ice and snow with 6.97352E-07 associated risk.
The risk of high winds and vortex ring state is about 10 times more comparing to the problem in the communication channel between remote controller and drone; however, the risk is about 20 times more comparing to the risk of depleted remote-control battery.
Further, the case study demonstrates that the risk of collision avoidance malfunction is one of the predominant risks for UAV-assisted bridge inspection; and it is about 8 times more compared with the risk of visual camera malfunction.
Indistinct information on the display of remote-control maintains the lowest associated risk, which is due to the lowest probability weight, with 0.0043 probability, and lowest total consequences weight, with 2.04E-06.
Authors’ intent is not to provide generalized advice on whether UAV-assisted bridge inspection should replace the conventional inspection or not, since these prescriptions will be particular to and heterogeneous to types of bridges and accompanied UAVs rules and regulations. Rather, the intent is to highlight the fact that even if UAV-assisted bridge inspection has a huge potential in the years to come, the associated hazard has to be investigated thoroughly. This will assist the decision-maker to identify the most cost-effective and efficient bridge inspection procedures with a minimum level of HSE-C (health, safety, and environment, and cost) risk. A lack of data, for different risk of events, was an issue during the illustrative case study analysis, due to the lack of experience in the cold operating environment.
Thus, the results should not be taken at face value; they should be interpreted in light of the current state of knowledge about operating experience in the cold operating environment. Moreover, the resulting risk values from the illustrative case study analysis should be updated as new data/evidence becomes available, preferably in the form of field (hard) data reflecting the actual operational experience in the cold operating environment and therefore gradually supplanting the opinions elicited from experts. All these elements, however, do not invalidate the results from the illustrative case study analysis.
| Nomenclature | ||
| UAS | = | Unmanned aircraft system |
| UAV | = | Unmanned aerial vehicles |
| NCAA | = | Norwegian Civil Aviation Authority |
| RPAS | = | Remotely Piloted Aircraft System |
| RO | = | Remotely piloted aircraft system organization |
| MTOW | = | Maximum take of weight |
| VLOS | = | Visual line of sight |
| UBIT | = | Under-bridge-inspection-truck |
| FAA | = | Federal aviation administration |
| = | The aggregated expert judgment consequences weight of an unwanted event | |
| = | The aggregated expert judgment probability of an unwanted event | |
| = | The aggregated expert judgment safety consequence of an unwanted event | |
| = | The aggregated expert judgment economic consequence of an unwanted event | |
| = | The aggregated expert judgment environmental consequence of an unwanted event | |
| = | The average weight of criteria k for expert i. | |
| = | The total weight for expert i. | |
| [OS] | = | The row of original pairwise comparison matrix |
| [ | = | The average column of normalized matrix |
| = | The same row average of normalized matrix | |
| = | The pivot ratio of criteria k between categories i and j | |
| = | The average weight of representative criteria in category i | |
| = | The average weight of representative criteria in category j | |
| = | The total weight of criteria k | |
| = | The average weight of criteria k in category i | |
| = | The global weight of criteria k | |
Disclosure statement
No potential conflict of interest was reported by the authors.
Additional information
Funding
References
- Aven, T., Renn, O., & Rosa, E. A. (2011). On the ontological status of the concept of risk. Safety Science, 49(8-9), 1074–1079. doi:https://doi.org/10.1016/j.ssci.2011.04.015
- Ayele, Y. Z. (2019). Drones for inspecting aging bridges. Paper presented at the International Conference on Natural Hazards and Infrastructure. ISSN 2623-4513., Chania, Crete Island, Greece.
- Ayele, Y. Z., Barabadi, A., & Barabady, J. (2016). Dynamic spare parts transportation model for Arctic production facility. International Journal of System Assurance Engineering and Management, 7(1), 84–98.
- Ayele, Y. Z., & Droguett, E. L. (2019). Application of UAVs for bridge inspection and resilience assessment. Paper presented at the 29th European Safety and Reliability Conference, Hannover, Germany.
- Barabadi, A., & Markeset, T. (2011). Reliability and maintainability performance under Arctic conditions. International Journal of System Assurance Engineering and Management, 2(3), 205–217.
- Belcastro, C. M., Newman, R. L., Evans, J., Klyde, D. H., Barr, L. C., & Ancel, E. (2017). Hazards identification and analysis for unmanned aircraft system operations. Paper presented at the 17th AIAA Aviation Technology, Integration, and Operations Conference. doi:https://doi.org/10.2514/6.2017-3269
- Benamara, F., Kaci, S., & Pigozzi, G. (2010). Individual opinions-based judgment aggregation procedures. Paper presented at the International Conference on Modeling Decisions for Artificial Intelligence.
- Burdett, H., Stoker, J., & Simpson, A. (2009). Functional Hazard Assessment (FHA) report for unmanned aircraft systems. Eurocontrol, 1, 1–81.
- Cai, H., & Lin, Y. (2011). Modeling of operators' emotion and task performance in a virtual driving environment. International Journal of Human-Computer Studies, 69(9), 571–586. doi:https://doi.org/10.1016/j.ijhcs.2011.05.003
- Cha, Y.-J., Choi, W., & Büyüköztürk, O. (2017). Deep learning-based crack damage detection using convolutional neural networks. Computer-Aided Civil and Infrastructure Engineering, 32(5), 361–378. doi:https://doi.org/10.1111/mice.12263
- Cha, Y.-J., Choi, W., Suh, G., Mahmoudkhani, S., & Büyüköztürk, O. (2018). Autonomous structural visual inspection using region-based deep learning for detecting multiple damage types. Computer-Aided Civil and Infrastructure Engineering, 33(9), 731–747. doi:https://doi.org/10.1111/mice.12334
- Ciampa, E., De Vito, L., & Pecce, M. R. (2019). Practical issues on the use of drones for construction inspections. Paper presented at the Journal of Physics: Conference Series. doi:https://doi.org/10.1088/1742-6596/1249/1/012016
- Clothier, R. A., & Walker, R. A. (2015). The safety risk management of unmanned aircraft systems. In: Valavanis K., Vachtsevanos G. (eds). Springer, Dordrecht. doi:https://doi.org/10.1007/978-90-481-9707-1_39
- DeYoung, R. (2018, December). Aviator pro, drones, and falling into the vortex ring state. Retrieved from https://www.agi.com/articles/aviator-pro-drones-and-falling-into-the-vortex-rin.
- Foreman, V. L., Favaró, F. M., Saleh, J. H., & Johnson, C. W. (2015). Software in military aviation and drone mishaps: Analysis and recommendations for the investigation process. Reliability Engineering & System Safety, 137, 101–111.
- Gielo-Perczak, K., & Karwowski, W. (2003). Ecological models of human performance based on affordance, emotion and intuition. Ergonomics, 46(1-3), 310–326. doi:https://doi.org/10.1080/00140130303536
- Gudmestad, O., Alhimenko, A., Løset, S., Shkhinek, K., Tørum, A., & Jensen, A. (2007). Engineering aspects related to Arctic offshore developments. St. Petersburg, Lan, 1–255.
- Hayhurst, K. J., Maddalon, J. M., Miner, P. S., DeWalt, M. P., & McCormick, G. F. (2006). Unmanned aircraft hazards and their implications for regulation. Paper presented at the 2006 ieee/aiaa 25TH Digital Avionics Systems Conference. doi:https://doi.org/10.1109/DASC.2006.313735
- Hora, S. C. (2009). Expert Judgement in Risk Analysis. Retrieved from http://create.usc.edu/sites/default/files/publications/expertjudgmentinriskanalysis_0.pdf.
- Southam, J. (2018). GPS common problems and how to mitigate them. Retrieved from https://safety4sea.com/gps-common-problems-and-how-to-mitigate-them/.
- Jung, H.-J., Lee, J.-H., & Kim, I.-H. (2018). Challenging issues and solutions of bridge inspection technology using unmanned aerial vehicles. Paper presented at the Sensors and Smart Structures Technologies for Civil, Mechanical, and Aerospace Systems 2018. doi:https://doi.org/10.1117/12.2300957
- Kang, D., & Cha, Y.-J. (2018). Autonomous UAVs for structural health monitoring using deep learning and an ultrasonic beacon system with geo-tagging. Computer-Aided Civil and Infrastructure Engineering, 33(10), 885–902. doi:https://doi.org/10.1111/mice.12375
- Kumar, R., Barabady, J., Markeset, T., & Kumar, U. (2009). Improvement of performance of oil and gas production facilities in Arctic regions by applying human factors/ergonomic principles at the design phase. Paper presented at the. Proceedings of the 20th International Conference on Port and Ocean Engineering under Arctic Conditions: June 9-12, 2009, Luleå, Sweden.
- Liu, M., Frangopol, D. M., & Kim, S. (2009). Bridge system performance assessment from structural health monitoring: A case study. Journal of Structural Engineering, 135(6), 733–742. doi:https://doi.org/10.1061/(ASCE)ST.1943-541X.0000014
- Lootsma, F. A. (1991). Scale sensitivity and rank preservation in a multiplicative variant of the AHP and SMART.
- Lu, C., Lan, J., & Wang, Z. (2006). Aggregation of fuzzy opinions under group decision-making based on similarity and distance. Journal of Systems Science and Complexity, 19(1), 63–71. doi:https://doi.org/10.1007/s11424-006-0063-y
- Maldonado, E., Casas, J., & Canas, J. A. (2019). Modelos de vulnerabilidad sísmica de puentes basado en" conjuntos difusos. Monograph Series in Earthquake Engineering, Editor A.H. Barbat, 1, 1–63.
- Markeset, T. (2008). Design for high performance assurance for offshore production facilities in remote harsh and sensitive environments. OPSEARCH, 45(3), 275–290. doi:https://doi.org/10.1007/BF03398819
- Moud, H. I., Shojaei, A., Flood, I., Zhang, X., Hatami, M., & Rinker, M. (2018). Qualitative and quantitative risk analysis of unmanned aerial vehicle flights over construction job sites. Paper presented at the Proceedings of the Eighth International Conference on Advanced Communications and Computation (INFOCOMP 2018), Barcelona, Spain.
- NCHRP. (2017). New guidelines for NDE bridge inspection methods. Retrieved from https://onlinepubs.trb.org/onlinepubs/nchrp/nchrp_readyresult_08.pdf.
- Ortiz, N., Wheeler, T., Breeding, R., Hora, S., Meyer, M., & Keeney, R. (1991). Use of expert judgment in NUREG-1150. Nuclear Engineering and Design, 126(3), 313–331. doi:https://doi.org/10.1016/0029-5493(91)90023-B
- Phares, B. M., Rolander, D. D., Graybeal, B. A., & Washer, G. A. (2001). Reliability of visual bridge inspection. Public Roads, 64(5), 64.
- Rakha, T., & Gorodetsky, A. (2018). Review of Unmanned Aerial System (UAS) applications in the built environment: Towards automated building inspection procedures using drones. Automation in Construction, 93, 252–264. doi:https://doi.org/10.1016/j.autcon.2018.05.002
- Ramanathan, R., & Ganesh, L. (1994). Group preference aggregation methods employed in AHP: An evaluation and an intrinsic process for deriving members' weightages. European Journal of Operational Research, 79(2), 249–265. doi:https://doi.org/10.1016/0377-2217(94)90356-5
- Seddon, J. M., & Newman, S. (2011). Basic helicopter aerodynamics (Vol. 40). New Jersey, USA: John Wiley & Sons.
- Seo, J., Wacker, J. P., & Duque, L. (2018). Evaluating the use of drones for timber bridge inspection. Gen. Tech. Rep. FPL-GTR-258. Madison, WI: US Department of Agriculture, Forest Service, Forest Products Laboratory, 1-152(258)1152.
- Tummala, V. M. R., & Ling, H. (1996). Sampling distribution of the random consistency index of the Analytic Hierarchy Process (AHP). Journal of Statistical Computation and Simulation, 55(1-2), 121–131. doi:https://doi.org/10.1080/00949659608811754
- Tummala, V. M. R., & Ling, H. (1998). A note on the computation of the mean random consistency index of the analytic hierarchy process (AHP). Theory and Decision, 44(3), 221–230. Retrieved from < Go to ISI>://WOS:000075460100002
- Tummala, V. M. R., & Wan, Y. (1994). On the mean random inconsistency index of analytic hierarchy process (Ahp). Computers & Industrial Engineering, 27(1-4), 401–404.
- Tung, S. L., & Tang, S. L. (1998). A comparison of the Saaty's AHP and modified AHP for right and left eigenvector inconsistency. European Journal of Operational Research, 106(1), 123–128. doi:https://doi.org/10.1016/S0377-2217(98)00353-1
- Wackwitz, K., & Boedecker, H. (2015). Safety risk assessment for uav operation. Drone Industry Insights, Safe Airspace Integration Project, Part One, Hamburg, Germany.