
 ?Mathematical formulae have been encoded as MathML and are displayed in this HTML version using MathJax in order to improve their display. Uncheck the box to turn MathJax off. This feature requires Javascript. Click on a formula to zoom.
Abstract
For practical decisions on common recurring maintenance actions, the information from routine inspections form a decision basis for the bridge manager. It is often difficult to assess whether this information is sufficient for deciding on a repair action, or if more information is needed. For many bridges the information for supporting decisions may be limited, although those bridges cause large yearly maintenance costs for the society. The purpose of the study presented in this paper is to show how two different models for decision making based on Bayesian decision theory, a point-in-time decision model and a sequential updating decision model, can be used to improve the decision-making process for common maintenance decisions. The models use information from routine inspections and incorporates time dependent aspects such as material degradation and time value of money to improve the decision-making process. The focus is on presenting the methodology with a case study of a concrete bridge in Sweden where the edge beams may have to be replaced. Three assessment approaches are considered: (i) no assessment, (ii) desktop evaluation and (iii) measurements. The main finding is that sequential updating decision making will provide a higher benefit than a point-in-time decision, and thus give higher Value of Information. This value becomes even higher when the measurements are selected for the assessment. The results also show that the edge beams should be replaced. The general approach presented can be applicable to many decision scenarios related to maintenance of deteriorating structures.
1. Introduction
To support decisions concerning maintenance of bridges, infrastructure owners need information about the actual performance and condition of these assets and the expected efficiency and longevity of subsequent repairs and other remedial actions. Such information is initially often obtained through routine inspections performed with prescribed intervals where possible damages and other signs of insufficient structural performance can be observed. In most cases, the bridge is deemed to be in an adequate state and no further measures have to be taken. In other cases, there is clear evidence from the initial inspection that some kind of actions are needed, either enhanced assessment or direct interventions.
Enhanced assessments, such as advanced theoretical modelling and experimental testing, may be carried out to determine the actual condition of the structure; such assessments, which may be performed by third party consultants, can be costly. On the other hand, enhanced assessments are often cheaper than to repair or replace the structural members and any information that may delay intrusive measures is often deemed valuable for the bridge owner since the allocated resources can then be used elsewhere. However, waiting too much with necessary repair or not uncovering hidden defects in time might have serious consequences and even lead to structural collapse.
There has been significant development in recent years of approaches and strategies that can support maintenance decisions. The focus has often been to maximize the benefits provided during the service life of the assets and to optimize the inspection and maintenance activities to reduce negative impacts to the environment and the society, all within a frame of available funds for maintenance, see e.g. Gubbi, Buyya, Marusic, and Palaniswami (Citation2013), Frangopol, Dong, and Sabatino (Citation2017), Nielsen and Sørensen (Citation2018) and Gkoumas et al. (Citation2019).
In practice, however, more simple procedures are often used for bridge assessment and the subsequent decision making is somewhat intuitive. In Sweden, e.g. the Transport Administration has its own Bridge and Tunnel Management (BaTMan) system for nationally owned infrastructure, which contains information concerning the condition of an asset based on past inspection, maintenance and repair/strengthening activities (Trafikverket, Citation2015). While there is substantial guidance concerning the collection of information from main inspections, there is a lack of decision support for the bridge manager regarding how this information should be utilized and whether more information is needed before any decision on maintenance actions is taken. Since information from the main inspections is afflicted with uncertainties depending on e.g. type and level of damage, probability of detection, etc., more information could be useful for reducing such uncertainties. Additionally, decisions on further assessments are recurring events since inspections are performed regularly. This means that the decisions regarding if additional information on the structural condition is needed is a time dependent problem, where effects of e.g. degradation and changes in costs over time may have an influence on the decisions.
The increasing interest for digitalization in asset management, see e.g. Isailović, Petronijević, and Hajdin (Citation2019), has shown that more formalized and automatized decision processes may be needed. This is not only relevant for important structures as there is also a great potential for using more formalized decision-making methods for more common maintenance situations which occur regularly for many bridges. In order to successfully implement a risk-based life-cycle management framework in practice, the framework needs to be synchronized with the relevant information from bridge management systems. There may also be a need for collecting and registering additional information in the system to be able to use a more automatized decision process, information regarding e.g. the state of the structure in relation to the reliability of the inspection results.
Another benefit of using more formalized decision-making methods is that the value of information (VoI) can be assessed explicitly. VoI-analysis focuses on evaluating the expected gain from collecting more information about the structure, thus reducing uncertainty, through experiments. In the context of inspection planning and monitoring of structures, VoI-analysis has gained significant popularity in recent years. Straub (Citation2014) presented a framework for the determination of the VoI when information is collected to improve the structural system reliability and illustrated its application for fatigue monitoring. Elsewhere, Thöns (Citation2018) presented an approach for the quantification of the value of structural health monitoring (SHM) to provide a rational basis for the optimization of the structural risk and integrity management considering utility gains via SHM and inspection information. The previous work and collaborations in the international research community led to the COST Action TU1402, which was focused on quantifying the value of structural health monitoring, which in turn have provided guides for operators, practicing engineers and scientists on how to make this quantification (Sousa, Wenzel, & Thöns, Citation2019b, Diamantidis, Sykora, & Sousa, Citation2019, Thöns, Citation2019).
The actual decision-making process will also influence the decision, where there may be differences in the preferred enhanced assessments and subsequent actions if the decision making is a point-in-time decision or if it is a sequence of decisions where future decision points can be included. Few studies exist of the difference between point-in-time decision making and sequential updating decision making; Sousa, Santos, and Chryssanthopoulos (Citation2019a) explored the differences for such approaches for creep deformation prediction where it was found that there was a larger benefit by using sequential updating over point-in-time decision making.
The purpose of this paper is to present a study using two models for decision making, a point-in-time decision model and a sequential updating decision model, based on Value of Information (VoI) and Bayesian decision theory and to illustrate how the decision models can improve the management of bridges by incorporating time dependent aspects such as structural degradation and time value of money. In many bridge management systems, the life-cycle costs of measures are directly used for prioritization between different options, where the most beneficial one, from a societal point of view, should be chosen. It is then possible that a more expensive measure will be chosen if the benefit outweighs the extra costs. There is however, at least not in the Swedish bridge management system, no direct link between the decision on whether a measure should be performed directly or if an extra assessment is needed, and the decision on which measure that should be taken. Another purpose of this study is to bridge this gap, and to integrate the two decisions.
The procedures of the two models are exemplified by a case study of a concrete bridge in Sweden, where maintenance decisions have to be made regarding the replacement of edge beams due to weathering of the concrete and subsequent reinforcement corrosion. The main novelty with the research presented here is the application of a more advanced decision framework using two different decision models to a common decision problem, where time dependent aspects such as degradation and time value of money are incorporated in the decision framework.
2. Practical framework for decision support
2.1. Previous studies
The methodology used for the analyses in this paper is based on decision graphs and the underlying theories, with the fundamental description found in Björnsson, Larsson Ivanov, Honfi, and Leander (Citation2019). In the paper, a framework was presented which considered different strategies for improved decision making through (more costly) higher levels of enhanced condition assessment and incorporated these considerations explicitly into a decision model. An optimal assessment method, as well as subsequent interventions, was then evaluated using Bayesian decision theory. The assessment methods, which incorporated the possibility for collecting more structural health information, were considered as possible experiments for obtaining new useful information about the condition of the structure. A fundamental and simplified decision model was used to exemplify this, showing the influence of the reliability of methods used for gathering structural health information, the effect of direct and indirect costs on the maintenance decision and if more information needs to be gathered.
The fundamental decision case is presented in the influence diagram in and in a related decision tree in . Here it can be seen that the nodes in the influence diagram represent the various parts of the decision tree, with the prior information obtained represented by the original state, θ. In this fundamental case, the utility u includes costs for assessment methods, e, and direct and indirect costs of actions a, e.g. direct costs repairing or replacing a structure or structural part or indirect costs of doing nothing which could be costs for traffic restrictions or costs for eventual failure, but also costs that can represent environmental impacts or social aspects.
Figure 1. Influence diagram for the fundamental decision case, from Björnsson et al. (Citation2019).
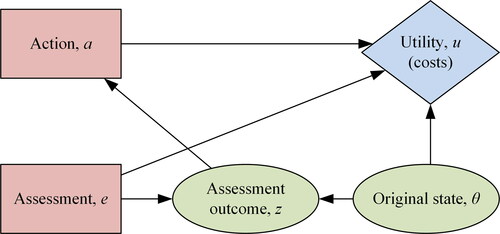
Figure 2. Decision tree for the fundamental case, related to the influence diagram in and EquationEquations 1(1)
(1) and Equation2
(2)
(2) , from Björnsson et al. (Citation2019).
![Figure 2. Decision tree for the fundamental case, related to the influence diagram in Figure 1 and EquationEquations 1(1) u*=maxe(∑z∈ZP(z|e)·(maxa(∑θ∈Θu(e,z∼,a,θ∼)·P″(θ|z))))(1) and Equation2(2) maxa(E[u(a|e,z∼)]=maxa(∑θ∈Θu(e,z∼,a,θ∼)·P″(θ|z)))(2) , from Björnsson et al. (Citation2019).](/cms/asset/e91f0abf-1a8d-460c-bb46-3d1a461382bd/nsie_a_1890141_f0002_c.jpg)
In order to determine which assessment e to choose for obtaining better knowledge about the uncertain structural condition θ, and then which maintenance action a to be selected, based on the uncertain outcome z of the experiment, the expected utility should be maximized. Mathematically, this maximal expected utility u∗ is expressed as:
(1)
(1)
where P(z|e) is the marginal probability of z for given e and unspecified θ; P′′(θ|z) is the posterior conditional probability of θ given z. and u(e, z, a, θ) is the utility, or cost, associated to a particular combination of e, z, a and θ with the tilde denoting random variables (as opposed to particular values). This can also be related visually to the decision tree in where the probabilities are inserted, this equation can then also be connected to . The optimal decision concerning which maintenance action should be chosen will also depend on this outcome (i.e. the pair {e, z}), this can be found in a part of EquationEquation (1)
(1)
(1) as:
(2)
(2)
More details about pre-posterior decision analysis can be found, e.g. in Raiffa and Schlaifer (Citation1961), Benjamin and Cornell (Citation1970). A more in-depth description of the fundamental decision model presented here can be found in Björnsson et al. (Citation2019).
To find the expected gain from additional information obtained through an experiment, the relation between the optimal experiment and no experiment can be used, which is often referred to as Value of Information (VoI) (Howard, Citation1966; Howard, Citation1967). It represents the maximal amount the decision maker would be willing to pay to obtain more information (Ponssard, Citation1976). It can be defined as the difference between the maximum expected utility with and without obtaining additional information, i.e. conducting an experiment, according to the following equation:
(3)
(3)
where u∗(ei) is the maximized (by appropriately selected action a, based on outcome z) expected utility when selecting experiment ei, and u∗(e0) is the maximized expected utility when choosing no experiment e0. The cost for the experiment itself is not included when calculating the VoI.
The framework for the fundamental case was applied to the fatigue assessment of a steel bridge detail for the old Söderström bridge in Stockholm, presented in Leander, Honfi, Larsson Ivanov, and Björnsson (Citation2018), showing the benefit of collecting more information and making more in-depth analyses instead of taking direct actions based on limited knowledge. It was also extended to incorporate decisions based on successive assessments, which is a common practice in bridge management, see e.g. Kühn et al. (Citation2008) and ISO 13822:2010 (Citation2010). It was shown in Honfi, Björnsson, Larsson Ivanov, and Leander (Citation2020) that successive assessments potentially provide a greater Value of Information (VoI) than single assessments, especially for important structures where the indirect costs of malfunction or restrictions would be large.
2.2. Bridge management information
Applying the decision framework and methodology presented in the previous section requires input information from bridge management systems (BMS), such as the system used by the Swedish Transport Administration (Trafikverket, Citation2015). Key information in a BMS includes the current condition of the assets, i.e. the current state of the bridges listed in the system. This condition governs whether a bridge is estimated to function as intended or if some measures should be applied for improving the condition.
In the BMS used by the Swedish Transport Administration, the functionality of an infrastructure asset such as a bridge can be evaluated using an index-based approach. The current functionality of the overall structure is governed by the condition of the individual bridge parts, where the condition of a part is classified from Condition Class (CC) 0 to CC3, with definitions on estimated consequences according to . Lack of function stated in is related to the estimated effect from the individual parts on the normal condition of the entire bridge structure, i.e. no interruptions of traffic or other restrictions. The inspection interval used is 6 years, with the possibility of follow-up inspections or assessments in between if deemed necessary. After an inspection, the condition class is set for individual components of a bridge based on given limit values and the information is registered in the BMS.
Table 1. Condition classes in the Swedish bridge management system (Trafikverket, Citation2015).
How the condition for individual components affects the overall functionality of the bridge is assessed by the responsible bridge manager based on the influence of different degradation mechanisms on the bridge structure. Little guidance is given on how this assessment should be made; thus, it is now mainly based on experience. The bridge manager can, if the inspection is performed by e.g. a hired external inspector, decide whether any measures such as repair should be explored directly or if more information is needed to further establish the actual condition of the bridge. According to personal communications with the Swedish Transport Administration, it is not uncommon that an external inspector sets a high condition class meaning that the actual state of the bridge may be better than registered in the system. This is also in line with the findings by Quirk, Matos, Murphy, and Pakrashi (Citation2018) who showed that the variability between inspectors is significant. The condition of a structure with a structural part that falls into CC0 or CC1 will be deemed sufficient until the next inspection, while a structure with a part in CC2 or CC3 must be followed up, either with a deeper condition assessment or with an active measure. Such measures may include repair or replacement of the structure or structural part but may also mean traffic restrictions until more information can be gathered.
To be able to utilize the decision support methodology presented in Björnsson et al. (Citation2019), described briefly in section 2.1, it is necessary to have an estimation of the probability of the bridge actually being in a certain condition class when this class is reported in the system. This is commonly not directly stated in bridge management systems but can be obtained by performing a study of the entire output on conditions classes from the BMS which is out of the scope of this paper. Studies exist where the reliability of results from visual inspections have been investigated along with subjective differences depending on the inspector, see e.g. Özgür, Ward, and Alp (Citation2012), Tenžera, Puž, and Radić (Citation2012), Moore, Phares, Graybeal, Rolander, and Washer (Citation2001). An extensive study by the Federal Highway Administration in the US, found in Moore et al. (Citation2001), showed that for bridge elements that could have one of six possible condition ratings, as many as four or five ratings were designated by different inspectors. 95% of bridge element ratings varied on average by two ratings, showing the possible variability in the outcomes of the inspections. A demonstration of the influence of different CC ratings is given in the case study presented in this paper.
2.3. Influence of degradation on maintenance decisions
The simplified decision model presented in Björnsson et al. (Citation2019), also shown in and , focused on a single point-in-time decision for cases where the preliminary assessment suggests immediate actions, i.e. there is no direct consideration of the time aspect on the decisions. Time, however, can be of a large importance for the bridge manager, since degradation of a structure or structural part can have a significant influence on which action that should be preferred. The degradation of a structural component can be directly linked to the condition class that can be given through the limits set in the bridge management system (Trafikverket, Citation2015), a high degradation rate may thus give a rapid decrease in function and can give the bridge manager unwanted surprises between two routine inspections.
Many degradation processes, such as reinforcement corrosion after initiation and weathering of concrete, are time dependent, see e.g. Penttala (Citation2009) and Dhawan, Bhalla, and Bhattacharjee (Citation2014). Even though there is a clear time dependent relation, the magnitude of the degradation is uncertain and the consequences hard to predict. A schematic description of degradation and its relation to the consequence classes described in the previous section is shown in . The figure shows the degree of degradation over a section of the lifetime of a structure, with the different condition classes related to this degree of degradation. The degradation curve represents the time dependent degradation of the structure, which is then restored to its original position after a repair.
Figure 3. Schematic representation on the degree of degradation dependence on time, with uncertainty represented by distribution around the degradation curve, for a section of the lifetime for a structure.
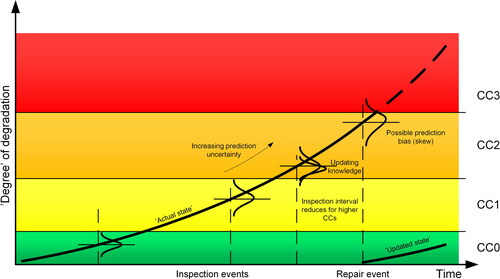
The small distributions at each inspection event represent the uncertainty, in both predicting the actual degradation as well as the variability of the inspector, at any given inspection. The change of shape for the distribution represents the increasing difficulty for the inspector to provide accurate information with increasing degradation. The degradation curve and distributions also show the importance of making sequential decisions and not just base the analysis of a specific point-in-time, since a point-in-time decision analysis may give information on the future degradation that might not be accurate. The figure is meant to show the possibility that a specific condition class can be assigned to a bridge part, even though the “actual state” of the part would give another condition class, thus showing the uncertainty in the prediction.
Time aspects can be included in decision analysis through the use of dynamic Bayesian networks (DBN) relating variables to each other over subsequent time steps. One example where DBN was used to consider degradation for bridge maintenance decisions was presented by Rafiq, Chryssanthopoulos, and Sathananthan (Citation2015), who showed that a dynamic network can be useful for handling complex interdependencies. The difficulty in incorporating dynamic networks for more practical decisions at the bridge manager level is related to the inclusion of decision nodes and the increased complexity of the model.
2.3.1. Point-in-time decision making
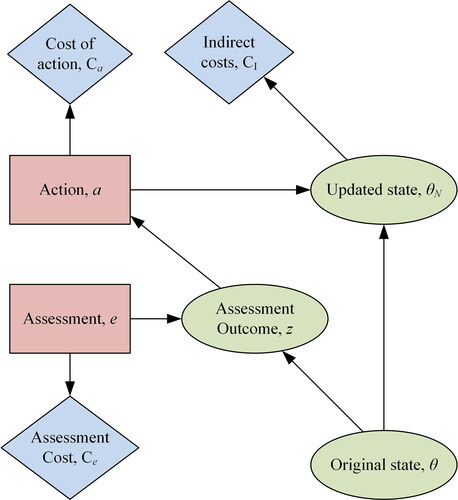
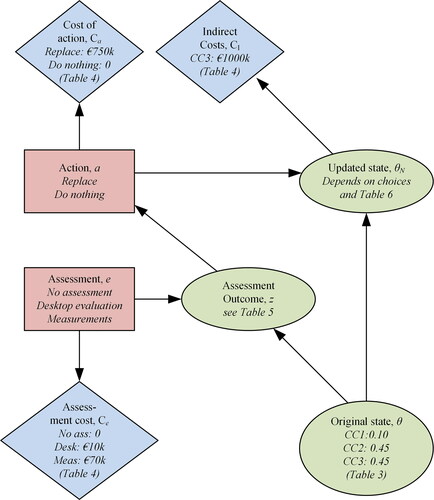
To introduce temporal aspects in the fundamental decision model, an additional state is added to the influence diagram from . The extended diagram is presented in , with an updated state θN that includes results from the decision concerning the chosen action a and the original state θ. The utilities (costs) u in the fundamental case is now divided into costs of assessment methods Ce, costs of actions Ca and indirect costs CI related to the chosen action, e.g. repair/replace a structure or doing nothing. The updated state θN can now include time dependent effects such as degradation and/or imperfect maintenance actions.
Figure 4. Updated influence diagram for the extended fundamental case (original influence diagram can be found in ).
The original state θ in can be based on the information available from the initial regular inspection and be related to the consequence class of the structure or structural part that is of interest. It can also, for other decision problems, be related to the probability of failure of the structure or the importance of the bridge to the surrounding network; however, this is not considered in this paper. The prior probabilities defined in the original state are thus directly related to information from the bridge management system. Related to the consequence classes, there is an uncertainty related to the information from the routine inspections however, it could therefore be appropriate to define the original state as a probability of a certain state given the reported consequence class such as was done by Quirk et al. (Citation2018), who gave a distribution for the overall bridge states in regions of Ireland. The probability of a certain state given that the inspection showed a particular condition class should be estimated by the bridge manager if such information is not provided from the BMS. The manner with which this can be interpreted is shown in the case study in section 3 of this paper.
2.3.2. Sequential updating decision making
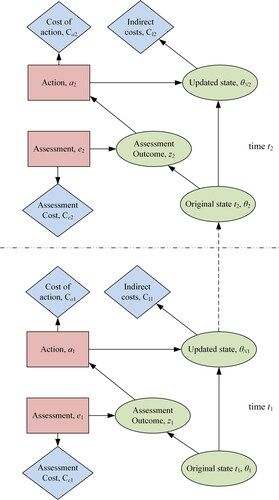
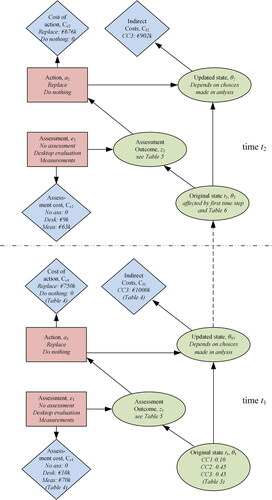
The information concerning degradation of the particular structure or structural part of interest can, together with information from an assessment z, form the basis for updating information about the state of the structure. This new information is then incorporated in another sequence of the bridge management decision making, thus forming the basis for incorporating the future decisions into the decision model. This can be represented by a further extension of the influence diagram in with another node sequence related to the first, as illustrated in . This subsequent (future) decision may affect the decision done at the present time t1. The time between t1 and t2 can be related to inspection intervals, but also represents a sequential decision where the outcome of the first decision governs when the second decision should be made (e.g. if a bridge component is in CC2 an action must be taken in three years, where the time is represented by t2-t1). Since a new time step is included directly in the model, the effect of degradation can now be included where it occurs in reality, i.e. between the two time steps, by incorporating the time dependent aspects in θ2 instead of having to incorporate them in the updated state in the first time step as in .
Figure 5. Extended influence diagram to incorporate time aspects such as updates in bridge state and benefits for the overall bridge stock if do nothing is chosen at the first decision point (extended from and 4), where t2 occurs after t1.
2.4. Time influence on costs
In addition to a change in the state of the structure, the costs of the actions and the indirect costs will also change over time. In theory, the repair costs could be assumed proportional to the level of degradation for most of the lifetime of the structure. Rapid increases can occur however, if there is a change in overall costs, due to e.g. a financial crisis or rapid increase in material costs, or if the damage spreads to other structural parts. In practice, the relationship between degradation and costs can be seen as constant over time (excluding the effect of discount rate) in fixed discrete steps. This represents the fact that the costs for many common maintenance actions, e.g. replacement of edge beams for concrete bridges or change of panels for cladded timber bridges, are not dependent on the degradation unless significant damages can be seen.
The discount rate will also impact the costs in a time dependent analysis, as stated in numerous previous studies, see e.g. Thoft-Christensen (Citation2009), Safi (Citation2013). The discount rate considers how costs increase over time due to inflation but may also incorporate the uncertainty of an investment not yet made into a Life-Cycle Cost Benefit analysis, which can be used to estimate and compare costs and/or benefits for investments considering the whole lifespan of e.g. a bridge. Thus, the timing of expenditures has important economic consequences, which is often recognized as the time value of money (Gitman, Citation2003). How this effect should be considered in infrastructure investments is regulated in Sweden by the Transport Administration (Trafikverket, Citation2018), who provide guidelines and rules for cost-benefit analysis. Similar international guidelines exist, e.g. on a European level (Bickel et al., Citation2006).
Maintenance investments for individual structures are also related to the infrastructure network, where it is of importance to relate the costs of maintenance for one bridge to the overall costs for all bridges (Frangopol, Gharaibeh, Kong, & Miyake, Citation2000). There can often be a benefit of being able to delay a repair for an individual bridge, since the resources can then be used elsewhere during the delay time (NCHRP 14-20 Citation2011; Trafikverket, Citation2018). To consider the benefit for the bridge manager of being able to delay the repair into the future, thus being able to use the resources elsewhere, the future value has to be transformed to the current rate. This transformation can be done by using the so called net present value (NPV) (e.g. Norman & Chisholm, Citation2014), which is often used to compare the value of investments made at different points in time. To recalculate a future investment in the decision framework presented in , the cost can be reduced for the future decision step to account for the benefit of the delay according to:
(4)
(4)
where Rt is the future cost at time t (years), i is the annual discount rate and t is the point in time when the investment will be made in years from the present time.
In the sequential updating decision model presented in , this means that inclusion of benefits of delaying repair is done by adjusting all costs at time t2. To exemplify this, consider a maintenance action with the cost of 100 units if carried out today. However, if the action is to be made 3 years from now, with a discount rate of 3.5%, the NPV will be 90.2 units. This then can be used in the decision model when calculating the expected utilities. The benefit of waiting with the repair can by this methodology be included by a simple procedure, where the currently used information can be utilized without any further assumptions of future values than the discount rate.
3. Case study concrete bridge
3.1. Bridge information
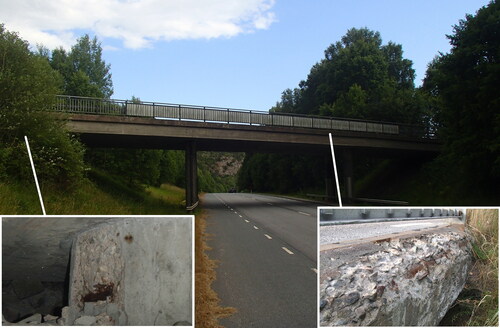
The bridge that will be used to exemplify the procedure shown in the previous sections is a concrete bridge built in 1963 shown in . It is a continuous concrete slab bridge with three spans of 10.9, 14 and 14 meters. At the edges of each slab an edge beam is placed to carry the railings. The overall condition of the bridge is more than enough to carry the loads from traffic on the structure. During the last main inspection in 2017, however, there were indications that the edge beams have to be replaced along with a minor repair of the columns.
Figure 6. Picture of the bridge with details of the damaged column (bottom left) and damaged edge beam (bottom right), courtesy of the Swedish Transport Administration.
3.2. Edge beam – inspection results
The results from the routine inspection performed in 2017 are shown in , for the edge beams and columns of the bridge. The result for weathering of the edge beam relates to the loss of bond capacity between the reinforcement and the concrete; see for an image of the damage. This loss is measured for reinforcement that is exposed, i.e. not encased in concrete, within a length of 1 m at the section where the highest damage is observed. The average loss in bond capacity for all exposed bars over this 1 m is then calculated and noted in the bridge management system and compared with a limit value for rating the damage on the edge beam. In the case presented here, the reported loss in bond capacity was just at the limit for CC3, the inspector rated the edge beams in CC3 as a consequence of this.
Table 2. Results from routine inspection.
As described in section 2.2 of this paper, the consequence of rating a bridge part in CC3 is that a measure must be taken directly. The bridge manager must decide whether more information is needed or if an invasive measure should be taken. A common decision, as has been described earlier, is to choose between different assessment options. A more detailed assessment, such as a more advanced measurement technique or a more extensive inspection, could also reveal more severe conditions, which is of great importance for the safety of the structure. In the edge beam case, the benefit of being able to rate the bridge in CC2 would be that a physical intervention could be postponed at least 3 years and the allocated resources spent elsewhere. There is therefore an incentive for the bridge owner to have more information about the condition of the bridge and bridge parts, since it is more advantageous to perform measures further on in time due to financial restraints as described in section 2.4. There is also the possibility in case of a choice of repair to limit the traffic during a short time, if other bridges are deemed more important, which may be beneficial for the bridge owner (NCHRP 14-20, Citation2011; Trafikverket, Citation2018).
The decision problem for the bridge owner, in this case concerning the edge beams, is therefore two-folded; one decision is whether it would be beneficiary to perform another assessment, either desktop evaluation or measurements, and the other decision is if the edge beams should be replaced as soon as possible or if it is reasonable to wait. In this case study, two alternative models of the decision analysis were chosen to study effects of including various time dependent aspects:
Point-in-time decision making regarding assessment and action using the influence diagram in .
Sequential updating decision making with a specified time increment between the decision points, where future degradation of the edge beams and consideration of net present value influence the current decision using the influence diagram in .
The commercial software GeNIe 2.4 (BayesFusion, Citation2019) was used to perform the calculations necessary for using the influence diagrams in and .
To be able to perform the calculations within the presented decision framework, the model requires certain inputs, which are not always easy to quantify. The first regards the original state of the structure, θ in , which is uncertain. Since the inspection shows that the condition has just reached CC3, the original state of the edge beam is distributed in the model around this inspection result. The distribution between the consequence classes used in this example is presented in , with an assumption that there is a low probability of CC1, but equal probability of CC2 or CC3. The numbers can be based on statistics from the bridge management system over the normal connection between results from routine inspections and the resulting condition class; such numbers may however not be published in this paper due to restrictions by the Swedish Transport administration. In this case, the values are an estimation based on engineering judgement knowing that the value from the routine inspection which was right on the border between CC3 and CC2.
Table 3. Distribution of probability of original state in a specific condition class.
When the information regarding the initial state has been acquired, the next step is to identify the costs and precision, so called sample likelihoods, of the possible enhanced assessment methods for obtaining more information on the state of the structure. Such methods are numerous and must be defined for each specific case. For the edge beams, the chosen alternatives are a desktop evaluation, which is cheap but might not give sufficiently reliable results, or to perform an additional deeper on-site investigation with measurements, which is more reliable but also more costly. Such information is often difficult to find in bridge management systems but is normally available for the bridge manager. There is, however, seldom any support on what kind of method that should be chosen, and the decision is instead based on the experience of the bridge manager. As a result, it might become less transparent why and how a specific decision has been made. The assessment costs for this case study are estimated by the authors based on discussions with the bridge manager to €10k for the desktop evaluation and €70k for performing measurements on the bridge, see also where all costs used in this study are summarized.
Table 4. Costs used in the study.
The sample likelihoods, i.e. the precision of the methods, for the assessment methods, represented by node z in and , are given in . For both methods, there is a probability of getting an adjacent state compared to the true state, with larger probability of more credible results with the measurements. This means that the assessment methods are not perfect and therefore it is necessary to assess the probability of false results.
Table 5. Sample likelihoods, z, used for the assessment methods.
The final information needed from the BMS is the cost of the action, CA, and indirect costs, CI, if no action is chosen. For this case study, the cost of replacing the edge beams, €750k, is obtained from the project database in the Swedish BMS (BaTMan) and is the procured cost for repair by the bridge manager. The indirect costs due to traffic restrictions and further damage of the structure are estimated to zero for CC0, CC1 and CC2, since if the edge beams are classified into these categories there are no future costs before the next decision point, which occurs in 6 years (CC0 and CC1) or 3 years (CC2). For CC3, an indirect cost of €1000k is related to; 1) the risk of the damage propagating in the structure if the beams are not replaced; 2) the risk for damage to the railing which may reduce driver safety; 3) costs for delays if the bridge is not fully functional. The value chosen is an estimate, since consequence modelling requires further investigations. The effect of changing the indirect cost was explored in Björnsson et al. (Citation2019). If an action is chosen, the indirect costs are set to zero since all costs in such a situation will be related to replacement of the edge beams.
Within the extended decision model in , the point-in-time decision model, an updated state θN was defined, where information about the structure after the action, such as risk for continuous degradation, can be included. For the edge beam case, the numbers used to represent the updated state are presented in . Replacing the beams is estimated to restore the functionality of the beams to CC0 without any imperfections, thus no probability of imperfect repair is included, and the probability can be set to 1. If do nothing is chosen as action, there is a continuous degradation of the edge beams, represented by the probability of reaching a higher CC and thus reflecting the uncertainty of the degradation process.
Table 6. Probabilities of updated state after action is chosen, including probability of degradation if “Do nothing” is the chosen action.
The updated state probabilities can be estimated from BMS information about how many structural elements of the same type show an increase in CC between two inspections, this requires further investigations. The numbers chosen here are based on information from literature, see e.g. NCHRP 14-20 (Citation2011), and discussions with the Swedish Road Administration. Since the main purpose of this paper is to illustrate the simplicity and transparency of the applied approach, this was deemed as an adequate solution for the study. To illustrate the model with the actual information as input, was updated with the information presented here; this is shown in . The final updated state θN depends on the information in and the decision made regarding assessment method and action.
Figure 7. Point-in-time decision model as illustrated in , with actual inputs in the various nodes.
For the sequential updating decision model, the influence diagram from is used, with the same basic input values as for the point-in-time decision model. The difference is that the information from the second decision point will now affect the first decision, which means that the effect of degradation and time value of money is included in a sequential decision. To cover effects of time preference, a discount rate of 3.5% is used for the base case which is the discount rate currently used by the Swedish Transport Administration. The discount rate is accounted for using EquationEquation 4(4)
(4) in section 2.4 applied to all costs, which includes assessments, actions and indirect costs, to account for the benefit of waiting with the repair. The motivation for this is that if a cost is paid in the future, that money can be used elsewhere during those years that they are not used for this structure.
For the example given here, it was assumed that the next decision point occurs 3 years from now, i.e. the edge beams are classed in CC2. This means that with a discount rate of 3.5% the costs for the two assessment methods will be set to €90k for the desktop evaluation and €63k for the measurements. The replacement cost is set to €676k, with the indirect costs for CC3 adjusted to €902k. Another difference is that effects of degradation can be included where they occur, in the time step between the decision points, i.e. included in the original state θ2 for time step t2 in . This is illustrated in , where has been updated with the actual information used in the various nodes. The final updated state at t2 depends on the decisions made regarding assessment methods and actions in both time steps.
Figure 8. Sequential updating decision model as illustrated in , with actual inputs in the various nodes.
3.3. Case study results
3.3.1. Point-in-time decision model
Using a point-in-time decision model for the edge beams gives a preferable option of performing an enhanced assessment, in this case desktop evaluation, which can be seen from the expected costs presented in . There is a small difference between the options, which would be expected due to the small difference between replacement costs and indirect costs for CC3. All expected utilities are here presented as expected costs: the lowest value is thus the most beneficial. The Value of Information (VoI) is higher for the measurements however, €48k for desktop evaluation and €102 for measurements according to EquationEquation (3)(3)
(3) , when the costs of the assessment methods are not considered. This shows that there is a drawback in using expected costs as the only basis for the decision, since the value of the information itself can be misinterpreted.
Table 7. Expected costs for the different assessments using point-in-time decision model and sequential updating decision model. (€).
If either of the assessment methods is chosen, the beams should be replaced if the assessment indicates CC3, while do nothing is the preferred option if the assessment indicates CC0, CC1 or CC2. In the expected costs of the different actions are shown for the two assessment methods related to the outcome of the assessment. If no assessment is chosen, the preferred option is also to do nothing which can be seen in the results in (expected utility of €585k for do nothing compared to €750k if the beams are replaced).
Table 8. Expected costs for the two possible actions using point-in-time decision model and sequential updating decision model, related to the two available assessment methods.
3.3.2. Sequential updating decision model
When including effects of degradation and time value of money on the decision using the sequential updating decision model, the outcome is that an assessment using measurements should be chosen, see for the expected costs. This is different from the results using the point-in-time decision model with no consideration of future decisions. The Value of Information (VoI) obtained from the two different assessment options has increased, with VoI being €78k for desktop evaluation and €164k for measurements, thus showing the influence of the second time step.
If no assessment is chosen, the beams should be replaced (Expected cost of €750k compared to €1070k if you do nothing). Which action to perform if an assessment is chosen is also affected by the inclusion of a second time step, the preferred option is now to replace the beams for both CC2 and CC3 if the desktop evaluation is chosen, see for the full results. All costs for doing nothing have increased for both assessment options, reflecting the fact that if nothing is done at the first time step it is likely that the beams must be replaced at the next decision point due to the continuous degradation. This means that for the case presented here, a sequential updating including the next decision point has a large influence on the decision that has to be made at the present time and this changes the preferred options both regarding which assessment method that provides the lowest expected costs and which subsequent action that is preferable.
4. Discussion of the results
The decision model alternatives presented in this paper show that different ways of including time dependent aspects provide different results regarding which assessment that should be chosen. To use a sequential updating decision model, and thus include the next decision point that will occur in the future when making a decision at present time, will affect the results from the decision analysis and which option that is preferable, and change the Value of Information for the assessment options. The model alternatives are related to a number of uncertainties, most relating to the availability of input data from bridge management systems and the costs. There is also an inherent sensitivity of the calculation model itself to the chosen input data, which can have a large influence on the possible decisions available for the bridge manager.
The lack of reliable input data and use of deterministic approaches are large obstacles for utilizing decision models and frameworks based on Bayesian decision theory in bridge maintenance decisions for common structures with no additional structural health information apart from information obtained during routine inspections. Decisions are still made by bridge managers, however, and the use of more developed models can be helpful in assessing different options and providing an informed basis for discussions. For the structure presented in this paper, the decision was to perform a desktop evaluation of the damages by the bridge manager, which led to a reduction in condition class to CC2 with the beams planned to be replaced during 2021. Both decisions are in line with the results using the decision support methodology presented in this paper. The measurement option had the greater value according to the analysis presented here however, indicating that a higher benefit would have been possible to gain for this case.
In Björnsson et al. (Citation2019) the impact of the chosen input values on the preferred decisions in a generic bridge maintenance decision scenario was presented and discussed. In the generic scenario, the prior probabilities, i.e. the original state of the structure, were related to the probability of failure, thus providing low values as a base line. The generic model does not capture the common maintenance case that is shown in this paper, where a deficiency is already found in the bridge that, however, will not influence the structural safety directly. Here, the prior information is introduced in a different way, reflecting more appropriately the actual decision of the bridge manager of assigning a certain condition class to the structure.
To check the sensitivity in the decision models towards these new priors, and how this sensitivity affects the value of information for the assessment options, the same input values for the edge beam was used along with a varying distribution in the prior probabilities. Starting with the point-in-time decision model, if the same relation between the priors for CC1 and CC2 was kept as for the original case, with the probability of CC2 4.5 times as large as probability of CC1, a relation for the expected costs of the three assessment types and the prior probability of CC3 could be established along with the VoI of the two assessment methods. This can be seen as the change in expected cost or VoI related to the change in prior probability of the original state of the structure being in CC3, the relation is shown in . If the probability of CC3 increases, it increases the expected costs of the assessment options (including no assessment) and changes the Value of Information (VoI). This was expected, since the benefit of carrying out further assessments should be limited the more certain the decision maker is of having the edge beams in CC3. The relation between CC2 and CC1 is set since if the likelihood of CC3 decreases, the likelihood of CC2 and CC1 should both increase, a fixed value was chosen for illustrative purposes.
Figure 9. Relation between expected costs (left y-axis) for the assessment options and the likelihood of the edge beams being in CC3 for point-in Time model (left) and sequential updating model (right), with a relation CC2/CC1 of 4.5; along with the Value of Information (VoI; right y-axis) of the two assessment options (desktop evaluation (B) and measurements (C)), defined as the difference between expected costs for no assessment and the expected costs for the respective assessment option, minus the cost of the assessment method.
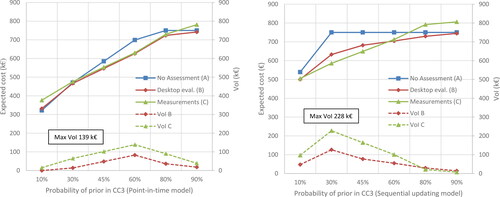
Using the same relations for the priors in the sequential updating model gave a slightly different result, as can be seen in . Here the decision maker can be more certain that repair should be chosen if no assessment is done for lower percentage of CC3 classification. The figure also shows that there is a window for when the measurements is the assessment option with the greatest value, if the edge beams is more likely to be in CC3 the value of the measurements is reduced and the preferred option changes to the desktop evaluation. In it can also be seen that the preferred assessment option varies with varying likelihood of CC3. This is not only related to the prior, but also to the combination of assessment costs and sample likelihoods for the assessment methods. For other combinations of input values this choice may be different, which was also shown in Björnsson et al. (Citation2019).
What can also be observed in the results in and is that the Value of Information increases for both assessment options when a sequential updating model is used compared to the point-in-time decision model. This means that when time dependent aspects such as time value of money and risk for degradation are included in the decision making, information about the condition of the structure is more valuable since the time dependent aspects will influence also future decisions.
The impact of the indirect costs on the results is also significant. If the point-in-time decision model is adjusted to include indirect costs also for CC2, the analysis shows that the preferred action changes to replace edge beams also if the assessments show CC2. This show the importance of the indirect costs, an importance that should be the focus of future developments of the decision model. One way forward could be, as mentioned earlier in the paper, to divide the indirect costs into three components: 1) repair/rehabilitation costs, 2) traffic delays and 3) potential human consequences.
The repair costs can be based on an estimate of bridge construction costs, which can be obtained from the bridge owner. Delay costs are the sum of the value of time per traffic type times the average daily volume of traffic affected times the delay time. An equivalent value for value of time per traffic of all types of vehicles (weighted based on statistics) in Sweden is about 20 €/hour (Björnsson, Citation2017). Potential human consequences can be due to a reduction in road safety, which must be estimated by the bridge manager (driver fatality or injury), while the value of risk reduction for road related fatalities and sever injuries is approximated to €2400k and €450k respectively (Björnsson, Citation2017).
5. Conclusions
Information from inspections of bridges is today gathered in advanced bridge management systems, with an abundance of information available from routine inspections performed at regular intervals. It is sometimes unclear, however, how information from past inspection can be utilized for decision making. The potential of including a methodology based on formal decision theory and value of information is substantial, leading to more informed decisions.
The extended decision support methodology presented in this paper shows two possible methods, a point-in-time decision model and a sequential updating decision model, for including time dependent aspects such as material degradation and time value of money into the decision process. It also shows the practical implications of including decision theory concepts in the daily operation of bridge managers and the usefulness of structured structural health information. The general approach developed can be applicable to many decision scenarios related to maintenance of deteriorating structures. This methodology is also applicable for more simple structures and common maintenance actions. Other conclusions that can be drawn are:
The Value of Information (VoI) is larger when the sequential updating decision model is used, and this model also show that a replacement of the edge beams is recommended since it considers both degradation and time value of money.
The largest VoI is found for the measurement assessment method for both models. For the point-in-time decision model however, the expected costs are lower for using the desktop evaluation.
When the condition of the edge beams is uncertain, i.e. when the assessment of the inspector is close to the limit between two condition classes, the two models give similar results. The sequential updating model gives a higher VoI if the condition of the beams is better than expected, since the time value of money is included in the analysis.
If the inspection results show that the condition of the edge beams is almost certain to be in the worst condition class, there is no value to be gained by collecting more information. The preferred action is then to repair directly.
The accuracy of the routine inspection is important for decisions concerning if more information is needed or if an invasive action, in this case replacing degraded edge beams, should be taken directly.
If information about degradation and time value of money is incorporated in the decision support method, this clearly affects both present and future maintenance decisions.
The possibility of including more formal decision methods applicable for more common structures and typical problems is valuable for bridge managers, since large funds are spent on maintenance of deteriorating structures each year with relatively similar issues and related decisions.
| List of notations | ||
| a | = | Repair or maintenance action |
| e | = | assessment method |
| i | = | annual discount rate |
| t | = | time |
| z | = | outcome of assessment |
| u | = | utility |
| θ | = | original state of nature, can relate to structural condition |
| θN | = | updated state after chosen action or non-action |
| Ce | = | cost of assessment method e |
| CC | = | condition class |
| Ca | = | cost of action a |
| CI | = | indirect costs |
| NPV | = | net present value |
| Rt | = | future cost at time t |
| VoI | = | Value of Information |
Disclosure statement
No potential conflict of interest was reported by the authors.
Additional information
Funding
References
- BayesFusion. (2019). GeNIe, version 2.4, www.bayesfusion.com
- Benjamin, J. R., & Cornell, C. A. (1970). Probability, statistics, and decision for civil engineers. New York: McGraw-Hill Book Company.
- Bickel, P., Friedrich, R., Burgess, A., Fagiani, P., Hunt, A., de Jong, G., Laird, J., Lieb, C., Lindberg, G., & Mackie, P. (2006). Proposal for harmonised guidelines. Deliverable 5, Developing Harmonised European Approaches for Transport Costing and Project Assessment (HEATCO).
- Björnsson, I. (2017). Holistic approach for treatment of accidental hazards during conceptual design of bridges – A case study in Sweden. Safety Science, 91, 168–180. doi:https://doi.org/10.1016/j.ssci.2016.08.009
- Björnsson, I., Larsson Ivanov, O., Honfi, D., & Leander, J. (2019). Decision support framework for bridge condition assessments. Structural Safety, 81, 101874. doi:https://doi.org/10.1016/j.strusafe.2019.101874
- Dhawan, S., Bhalla, S., & Bhattacharjee, B. (2014). Reinforcement corrosion in concrete structures and service life predictions – A review. 9th International Symposium on Advanced Science and Technology in Experimental Mechanics, New Dehli, India.
- Diamantidis, D., Sykora, M., & Sousa, H. (2019). Quantifying the value of structural health information (SHI) for decision support – Guide for practising engineers (COST Action TU1402).
- Frangopol, D. M., Dong, Y., & Sabatino, S. (2017). Bridge life-cycle performance and cost: analysis, prediction, optimisation and decision-making. Structure and Infrastructure Engineering, 13(10), 1239–1257. doi:https://doi.org/10.1080/15732479.2016.1267772
- Frangopol, D. M., Gharaibeh, E. S., Kong, J. S., & Miyake, M. (2000). Optimal network-level bridge maintenance planning based on minimum expected cost. Transportation Research Record: Journal of the Transportation Research Board, 1696(1), 26–33. doi:https://doi.org/10.3141/1696-39
- Gitman, L. (2003). Principles of managerial finance. 10th ed. Upper Saddle River, NJ: Prentice Hall.
- Gkoumas, K., Marques dos Santos, F., Van Balen, M., Tsakalidis, A., Ortega Horteland, A., Grosso, M., Haq, A., & Pekar, F. (2019). Research and innovation in bridge maintenance, inspection and monitoring – A European perspective based on the Transport Research and Innovation Monitoring and Information System (TRIMIS). https://ec.europa.eu/jrc/en/publication/research-and-innovation-bridge-maintenance-inspection-and-monitoring
- Gubbi, J., Buyya, R., Marusic, S., & Palaniswami, M. (2013). Internet of Things (IoT): A vision, architectural elements, and future directions. Future Generation Computer Systems, 29(7), 1645–1660. doi:https://doi.org/10.1016/j.future.2013.01.010
- Honfi, D., Björnsson, I., Larsson Ivanov, O., & Leander, J. (2020). Informed successive condition assessments in bridge maintenance. Journal of Civil Structural Health Monitoring, 10(4), 729–737. doi:https://doi.org/10.1007/s13349-020-00415-2
- Howard, R. A. (1966). Information value theory. IEEE Transactions on Systems Science and Cybernetics, 2(1), 22–26. doi:https://doi.org/10.1109/TSSC.1966.300074
- Howard, R. A. (1967). Value of information lotteries. IEEE Transactions on Systems Science and Cybernetics, 3(1), 54–60. doi:https://doi.org/10.1109/TSSC.1967.300108
- Isailović, D., Petronijević, M., & Hajdin, R. (2019). The future of BIM and bridge management systems. IABSE Symposium – Towards a Resilient Built Environment – Risk and Asset Management, Guimarães, Portugal.
- ISO 13822:2010. (2010). Bases for design of structures – Assessment of existing structures. Geneva, Switzerland: The International Organization for Standardization.
- Kühn, B., Lukic, M., Nussbaumer, A., Günther, H. P., Helmerich, R., Herion, S. M. H. K., … Bucak, O. (2008). Assessment of existing steel structures: Recommendations for estimation of remaining fatigue life. Prepared under the JRC-ECCS cooperation agreement for the evolution of Eurocode 3 (programme of CEN/TC 250).
- Leander, J., Honfi, D., Larsson Ivanov, O., & Björnsson, I. (2018). A decision support framework for fatigue assessment of steel bridges. Engineering Failure Analysis, 91, 306–314. doi:https://doi.org/10.1016/j.engfailanal.2018.04.033
- Moore, M., Phares, B., Graybeal, B., Rolander, D., & Washer, G. (2001). Reliability of visual inspection for highway bridges, Volume 1 – Final report [FHWA-RD-01-020]. Federal Highway Administration, US Department of Transportation.
- NCHRP 14-20. (2011). Consequences of delayed maintenance. National Cooperative Highway Research Board.
- Nielsen, J. S., & Sørensen, J. D. (2018). Computational framework for risk-based planning of inspections, maintenance and condition monitoring using discrete Bayesian networks. Structure and Infrastructure Engineering, 14(8), 1082–1094. doi:https://doi.org/10.1080/15732479.2017.1387155
- Norman, G., & Chisholm, D. C. (2014). Dictionary of industrial organization. Cheltenham, UK: Edward Elgar Publishing.
- Özgür, A., Ward, N. M., Jr., & Alp, C. (2012). Identifying bridge rehabilitation needs using an analytical method developed for interpretation of visual inspection data. Journal of Performance of Constructed Facilities, 26(3), 312–319.
- Penttala, V. (2009). Failure, Distress and Repair of Concrete Structures: 1 - Causes and mechanisms of deterioration in reinforced concrete. Cambridge, UK: Woodhead Publishing.
- Ponssard, J. P. (1976). On the concept of the value of information in competitive situations. Management Science, 22(7), 739–747. doi:https://doi.org/10.1287/mnsc.22.7.739
- Quirk, L., Matos, J., Murphy, J., & Pakrashi, V. (2018). Visual inspection and bridge management. Structure and Infrastructure Engineering, 14(3), 320–332. doi:https://doi.org/10.1080/15732479.2017.1352000
- Raiffa, H., & Schlaifer, R. (1961). Applied statistical decision theory. Boston: Harvard University Press.
- Rafiq, M. I., Chryssanthopoulos, M. K., & Sathananthan, S. (2015). Bridge condition modelling and prediction using dynamic Bayesian belief networks. Structure and Infrastructure Engineering, 11(1), 38–50. doi:https://doi.org/10.1080/15732479.2013.879319
- Safi, M. (2013). Life-cycle costing: Applications and implementations in bridge investment and management (Doctoral thesis). Stockholm, Sweden: Royal Institute of Technology (KTH).
- Sousa, H., Santos, L. O., & Chryssanthopoulos, M. (2019a). Quantifying monitoring requirements for predicting creep deformations through Bayesian updating methods. Structural Safety, 76, 40–50. doi:https://doi.org/10.1016/j.strusafe.2018.06.002
- Sousa, H., Wenzel, H., & Thöns, S. (2019b). Quantifying the value of structural health information (SHI) for decision support – Guide for operators. COST Action TU1402.
- Straub, D. (2014). Value of information analysis with structural reliability methods. Structural Safety, 49, 75–85. doi:https://doi.org/10.1016/j.strusafe.2013.08.006
- Tenžera, D., Puž, G., & Radić, J. (2012). Visual inspection in evaluation of bridge condition. Građevinar, 64(9), 717–726.
- Thoft-Christensen, P. (2009). Life-cycle cost-benefit (LCCB) analysis of bridges from a user and social point of view. Structure and Infrastructure Engineering, 5(1), 49–57. doi:https://doi.org/10.1080/15732470701322818
- Thöns, S. (2018). On the value of monitoring information for the structural integrity and risk management. Computer-Aided Civil and Infrastructure Engineering, 33(1), 79–94. doi:https://doi.org/10.1111/mice.12332
- Thöns, S. (2019). Quantifying the value of structural health information (SHI) for decision support – Guide for scientists. COST Action 1402.
- Trafikverket. (2015). BaTMan handbook (In Swedish). Swedish Transport Administration. https://batmanhandbok.trafikverket.se
- Trafikverket. (2018). Analysmetod och samhällsekonomiska kalkylvärden för transportsektorn: ASEK 6.1, Swedish Transport Administration (In Swedish).