
 ?Mathematical formulae have been encoded as MathML and are displayed in this HTML version using MathJax in order to improve their display. Uncheck the box to turn MathJax off. This feature requires Javascript. Click on a formula to zoom.
Abstract
Computer-generated holography has been anticipated in augmented reality (AR) since it can fully provide multi-depth 3D information to users, but speckle noises are often accompanied as one of the most significant degradation factors. Since complex amplitude encoding can suppress speckle noises, applying double-phase encoding to a lensless holographic projection system using a double-step Fresnel diffraction (DSF) algorithm has been reported to reduce those noises. However, a single filtering focus at a virtual focal plane might significantly reduce the projection region compared to the maximum diffraction bandwidth of the spatial light modulator. In this paper, we applied multiple foci for the focal plane of the DSF method with off-axis phase encoding, which can expand the projection region and is applicable to display multi-depth images with DSF. Numerical analysis conducted for image quality compared with conventional single focus DSF algorithm shows that the speckle performance does not degrade so much as the number of foci increase. We expect the proposed method to be useful for holographic projection optical systems such as AR head-up display.
1. Introduction
Computer-generated holography has been expected to be one of the most promising technologies for expressing dynamic three-dimensional images due to its advantages of reproducing optical wavefront by controlling the amplitude and phase of light. While augmented reality (AR) systems utilized by conventional 2D micro-display make users feel uncomfortable and dizzy due to vergence-accommodation conflict (VAC), holographic displays can solve the problem by providing complete depth cues [Citation1–3], so various studies have been conducted to employ the holography in the AR fields [Citation4–7].
In most cases, current holographic displays generate object images in three-dimensional space by applying a computer-generated hologram (CGH) that contains phase-only information into a spatial light modulator (SLM) with coherent light source illumination. However, this process may cause serious speckle noise due to the random phase distribution and self-interference of the coherent light source [Citation8,Citation9]. To reduce these speckle noises, CGH can also be calculated based on the time-multiplexed methods or the iterative methods [Citation10–12]. However, such iterative algorithms are quite difficult to be applied to systems that require real-time and high frame rate contents, such as AR-HUD. Using an incoherent light source, such as light emitting diode (LED), to generate a holographic image can also reduce the speckle noises. However, issues such as image blurring and weak brightness might limit the practical use of incoherent light-based holographic displays in AR-HUD systems [Citation13,Citation14].
To solve this problem, various CGH generation techniques for expressing complex amplitude information with phase-only SLM have been reported in recent years, which can be classified as encoding-based methods [Citation15–18] and device-based methods [Citation19–21]. For systems that simply use commercialized SLM without specific device-level modification, encoding-based methods might be preferred for the compactness of the overall system. One way to encode complex amplitude information with phase-only SLM is a double-phase hologram encoding method (DPHM), in which one complex amplitude information is decomposed into two pure phase values of constant amplitude [Citation15]. To apply DPHM, focusing lens and iris for removing the unnecessary light are required, which make the entire system bulky.
Many studies on the propagation algorithms with two succeeded Fresnel diffraction, usually for obtaining holograms with desired magnification, have been conducted [Citation18,Citation22,Citation23]. In a precedent study, a double-step Fresnel diffraction (DSF) algorithm with off-axis encoding was designed, which applied converging wavefront in SLM to generate a speckle-reduced projection-type hologram without a lens system [Citation18]. This method can also achieve a zoomable image size by applying aliasing-reduced Fresnel diffraction with scale and shift operations (ARSS) algorithm [Citation24]. The DSF method with off-axis encoding should be properly used for the holographic projection system such as AR-HUD in terms of speckle mitigation by reducing aliasing noise, adjustable sampling pitch between the image and hologram plane, and high-contrast by blocking non-diffractive DC-noise. However, since the position and shape of the focus on the filtering plane were fixed in DSF system, the holographic projection zone was significantly limited based on the triangular ratio between the SLM-to-filtering plane distance and the filtering-to-image plane distance. Therefore, the projection zone using the DSF algorithm is much smaller than the maximum diffraction region determined by the pixel pitch of SLM. In other words, using the maximum diffraction bandwidth of SLM with a fixed single focus filter was impossible when conventional DSF method was applied. In addition, since the entire area of SLM was not utilized, a problem of increasing ringing artifacts and intensity reduction was observed.
In this research, we propose the multi-focus DSF (MDSF) method that applies the multi-focus filtering plane to improve the spatial region of the holographic projection zone, which is also applicable for multi-focus image generation. By appropriately designing the locations of multi-focus of the filtering plane with off-axis phase encoding, the proposed method can use a much larger diffraction region of the SLM to reconstruct multi-depth images than the conventional DSF method. The feasibility of the proposed method is checked through numerical simulations and optical reconstructions. Furthermore, the numerical results show that the speckle performance measured by image quality assessment methods, such as peak signal-to-noise ratio (PSNR), mean structural similarity index measure (MSSIM), and speckle contrast (C), does not degrade so much as the number of focus increases. Hence, we expect that the proposed work can be useful in various systems that use the projection-type holographic display such as AR-HUD system [Citation25–27].
2. Principles of the proposed method
Prior to describing the details of the CGH calculation process, we would like to briefly state the major differences between the conventional DSF and MDSF methods, which are illustrated in Figure (a) and (b). Since the MDSF method is based on conventional DSF, both methods have a similar reconstruction process that needs a virtual focus plane located at an intermediate depth between CGH and image planes. For calculating CGH, the virtual plane indicates the position where the wavefront from the image converges to a certain focus. This plane also indicates the position where physical iris is located for image reconstruction, to filter unnecessary light such as high-order diffraction, non-diffracted light from SLM, and conjugated fields. Here, we define the distance between CGH and the virtual plane as and between the virtual and image plane as
, where i indicates the image plane number. The reconstructed distance between CGH and the image plane is defined as
. Figure (a), shows the conventional DSF method with an off-axis encoding that uses single focus at the virtual plane must have a restricted projection region at the image plane compared to the maximum region that Fresnel diffraction from SLM can provide, which is indicated by the black solid square of the image plane. On the other hand, in an ideal case, the proposed method can utilize the maximum diffraction region as the same possible diffraction bandwidth of SLM by increasing the number of apertures at the virtual focus domain. Moreover, as shown in Figure (b), the image generated through each focus can provide various information at different depths even though only a single virtual plane exists. As depicted in Figure (b), sampling pitches of the image plane, virtual plane, and CGH plane are defined as
,
,
, which have different values but tightly related to each other for calculation.
Figure 1 (a) Illustration of the conventional DSF method for image reconstruction, and (b) that of the proposed MDSF method, respectively. (c) Conceptual schematic of the overall CGH calculation process of the proposed method.
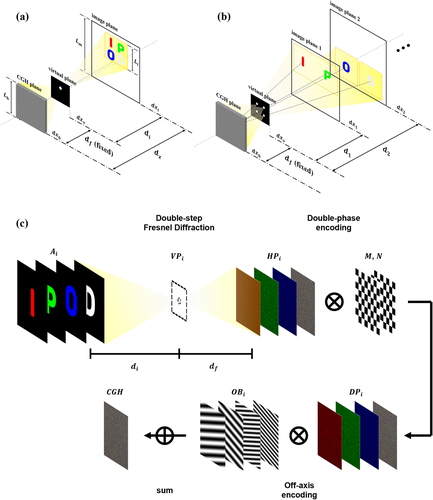
Figure (c) describes the CGH calculation process of the proposed MDSF method. At first, a spherical phase factor with a focal length of :
=
is multiplied by the amplitude of each image
. This spherical phase factor converges each image at a point on the virtual plane. Therefore, the complex amplitude at each image plane is given as
.
After that, the CGH calculation of the proposed MDSF method is conducted in two steps. The first step applies the ARSS algorithm to convergence from the image to the virtual plane. If we use the complex amplitude in the image plane , the complex amplitude in the virtual plane is expressed by.
(1)
(1) Here,
is the scaling parameter which means
,
and
indicate fast Fourier transform calculation and a rectangular-shaped function to reduce aliasing error, respectively. The detailed expressions of
can be found in the reference list [Citation24].
The second step applies the single FFT-based Fresnel diffraction to calculate the divergence from the virtual plane to the CGH plane. The complex amplitude of the CGH plane can be obtained by implementing the single Fresnel diffraction from . It can be calculated as follows:
(2)
(2) The complex amplitude wavefront information on the CGH plane for each image can be obtained through the above algorithm. From the Fresnel diffraction formula, the sampling pitches of the virtual plane and CGH plane (
and
) have a relationship of
by Nyquist theorem, where
is the sampling number. Here, the ARSS scaling parameter ‘
’ might provide a degree of freedom to rescale image projection zone size. Based on this degree of freedom, we define an MDSF scale parameter ‘
’, which represents the overall ratio of the image projection zone size relative to CGH size. Therefore, the sampling pitch of the image plane can be represented by
, and the ARSS scaling parameter for each plane can be calculated as
or in other expression as
(3)
(3) Equation (3) implies that
of the image plane can be differently designed for each image plane number i, only with a single virtual plane (because
can be fixed if we Tune
in Eq. [3]) by appropriately tuning the ARSS scaling parameter of each plane number. The upper limit of
is determined by a possible range of
that does not produce an aliasing error, which can be found in the previous work [Citation24].
If we want to design wavefronts generated from the objects that fully arrived at the region of the CGH plane without distortion, is recommended to be set as
, which is an optimized MDSF scale parameter. The value of
is determined by triangular relations, expressed as
. The size of an image is
, where the
is the size of CGH given as
. If the parameter
is smaller than
, the wavefronts generated from the objects are recorded in a restricted region of the CGH, while the rest of the region remains unused. As a result, the optical intensity or quality of the reconstructed image can be reduced, but it can still reconstruct the image. On the other hand, if the parameter
is larger than
, an aliasing noise can occur because the wavefront is recorded incompletely [Citation18].
To express the complex amplitude information with a phase-only SLM, double-phase encoding of is applied by decomposing the complex amplitude into two pure phase components;
and
. If we define the amplitude and phase of
as
and
,
(4)
(4)
(5)
(5) where
is the maximum value of
. Therefore, we can see
, which means
is the sum of the two waves
and
. Using phase-only SLM, a superposition of two-phase information by spatial-multiplexing can lead to expressing complex amplitude information [Citation28]. As a result, double-phase hologram
can be expressed as
(6)
(6) where
and
are the two-dimensional complementary binary checkerboard pattern.
Finally, an off-axis phase encoding can be applied on to place the image in the intended location within a Fresnel diffraction region of SLM and to split the image information from non-diffractive dc noise. For multiple images generation at different projection regions, phase information with different oblique incidence
is multiplied by each double-phase encoded pattern,
. Here, the relation between the position of virtual focus and the off-axis encoding pattern is as follows:
(7)
(7) where the angles
and
are the inclination and azimuthal angles, and the coordinates
indicate the location of virtual focus for ith image plane. The final expression for the CGH can be expressed by
(8)
(8)
3. Results and discussions
3.1 Projection zone expansion using the proposed MDSF method
Throughout the paper, the wavelengths used for red, green, and blue (RGB) light sources are set to 638, 520, and 450 nm, respectively, in simulation and experiment. Figure (a) and (b) are the reconstructed image results show the major differences between the DSF and the MDSF methods. At first, to focus on the projection zone expansion characteristics of the proposed method, the distance from the virtual plane to the image plane () is fixed to 1.6 m for all images, and
is set to 0.4 m. Considering the specification of the SLM that we used in experiments, the sampling pitch of the CGH is designed to
= 3.6 μm. The dotted-lined red rectangle represents the region where the experiment might have had non-diffractive reflected light from the SLM. Since the maximum diffraction angle from the given CGH is
, the length of the full projection region with Fresnel approximation will be given as
. The scale of Figure (a) and (b) are given as
, so that these figures intuitively show how a large projection region can be used concerning the full Fresnel diffraction region of the given SLM.
Figure 2 Reconstructed amplitude of letter ‘IPOD’ by using (a) the conventional DSF method and that using (b) the proposed MDSF method that have four foci at the virtual plane. (c) Amplitude of light at the virtual plane and (d) the calculated double-phase encoded CGH that is used for reconstructing the result shown in (b). The overall size of (a) and (b) is set to full Fresnel diffraction region.
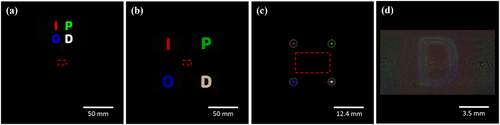
The original image of Figure (a) comprises a single image, ‘I P O D,’ with RGB and white colors, projected through a single focus positioned at (0, 7.7 mm). Figure (b) is composed of four images, ‘I’, ‘P’, ‘O’, and ‘D,’ which are projected through the different coordinate values of focus points:
(−7.7, 7.7 mm),
(7.7, 7.7 mm),
(−7.7 mm, −7.7 mm), and
(7.7 mm, −7.7 mm), respectively. The MDSF scale parameter of every image is set as
= 3, sampled with 4096
4096 pixels with pixel pitch
= 10.8 μm. Figure (c) illustrates the light at the virtual plane which clearly shows that the proposed MDSF method is applied. The initially multiplied spherical phase and
make the multi-focused light on the virtual plane at the intended location. The white circles of Figure (c) indicate the filter function multiplied by the result of the virtual plane. Figure (d) illustrates the relevant double-phase encoded CGH design for reconstructing Figure (b), calculated by the initial resolution of 4096 × 4096 and cropped into 3840 × 2160, considering the practical resolution of the SLM device that will be used in experiments.
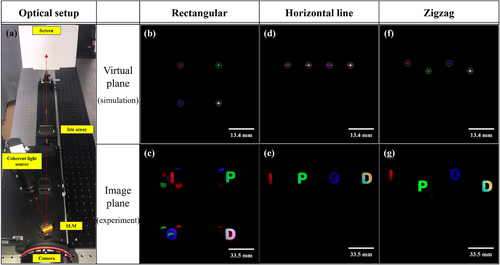
Figure 3 (a) Experimental setup for optical reconstruction. Simulation results at a virtual plane and relevant experimental results at an image plane with various iris arrangements of the rectangle (b) and (c); horizontal line (d) and (e); and zigzag (f) and (g).
From the above simulation results, we verified that by applying the multi-focus filtering plane at the virtual plane, multiple images can be reconstructed by the double-phase encoded CGH recorded with the MDSF method, with each image imposed with a different oblique incidence angle. By comparing Figure (a) and (b), while maintaining the high-quality reconstruction achieved by the DSF algorithm, we can use a much wider area within the Fresnel diffraction region of the SLM in the same image information expression than the conventional DSF method. Furthermore, when different depths are given to each image, more abundant application is possible. As proof of this concept, both numerical and experimental results for such multi-depth images using theh MDSF method will be shown in the following section.
3.2 The iris layout optimization for avoiding conjugate field and high-order diffraction
Since the results in the previous section are based on quantitative simulation, double-phase encoding is ideally conducted so conjugate fields do not appear and higher-order diffractions are very weakly observed. However, in practical experiments, these conjugated images and higher-order diffracted fields are much stronger than the numerical simulation; therefore, these unwanted light portions can pass through the iris and generate ghost images at the projection plane. In the case of the single-focus filter, these noises are almost negligible, but for the proposed MDSF method, these noises cannot be ignored as the number of foci increases. Therefore, the iris layout optimization is needed to practically use the proposed method, as shown in Figure .
First, the experimental setup that we used is shown in Figure (a). The red line indicates a light path in the reconstruction process. The phase-only CGH loaded on the SLM is illuminated by laser diode sources of RGB (638, 520, and 450 nm) after beam collimation. The built-in type hologram generation kit (Holographic kit PEONY_62a, May) contains LCoS type SLM with 3840 × 2160 resolution and pixel size 3.6 μm × 3.6 μm is used, which can be operated with the time-multiplexed feature of RGB information with 360 Hz (120 Hz at each color) synchronized with laser diode sources. A multi-focus filter is placed at the designed distance of virtual plane . An experimental image is observed by placing the diffuser screen at the designed reconstruction distance
from the SLM and the scattered lights are captured by CMOS camera (Canon EOS 6D) placed right above the SLM.
In Figure (b)–(g), our strategy for designing the iris location for reducing the noise signal is shown step by step. If the rectangular layout, such as in Figure (b), is applied, the projection zone can be used as wide as possible. However, the blurred conjugate image of each object will be located at the odd-symmetry position. For example, the conjugate image of the image focused on the upper-left side may pass through the lower-right side iris and vice versa, which can make unwanted noise, as shown in Figure (c).
To avoid such odd-symmetric noises, the iris configuration of off-axis focal arrangement along the same side, as shown in Figure (d), can be applied to avoid image distortion caused by the conjugate field. However, if the apertures of virtual plane are positioned in-line, the convergent light of each image on the virtual Fourier plane generally affects teach other since higher-order diffraction field diffracts the horizontal and vertical sides due to the square-type pixel arrangement of the SLM as shown in Figure (e). Therefore, it would be advantageous to use zigzag-type arrangements, as shown in Figure (f), which cause fewer interactions between each image at the virtual plane, and finally, provide a reconstructed field without an unwanted image, as shown in Figure (g). Here, we would like to note that there can be various arrangement types, and zigzag-type arrangement is only one of these examples. In general, we recommend a structure in which adjacent filtering foci are not located on the same line along the horizontal and vertical directions as much as possible.
Figure shows the numerical and experimental results for reconstructed holographic projection images using the MDSF method designed for multi-depth images. Figure (a)–(d) present the simulation results and 4(e) – 4(h) demonstrate the optical experiments results. The projected beam from the SLM transmits through a multi-focus spatial filter that consists of a zigzag-type iris arrangement whose diameters are 3.0 mm and foci locations of (−16.5, 11 mm),
(−5.5, 7 mm),
(5.5, 11 mm), and
(16.5, 7 mm), respectively. Four original images of Mars, Earth, Venus, and Mercury are used with the different depth parameters,
= 0.25 m,
= 0.50 m,
= 0.75 m and
= 1 m, respectively. The distance from the SLM to the virtual plane is given as
= 0.50 m, and the MDSF scale parameter of each image is
= 0.5,
= 1,
= 1.5 and
= 2. Therefore,
of each projected images are
6.35 mm,
12.7 mm,
19.05 mm, and
25.4 mm (image size of the first image ‘Mars’ is 6.35 mm). In Figure , the reconstruction distance is
, so the images Mars, Earth, Venus, and Mercury are focused respectively in order of figures from left to right.
Figure 4 Simulation ((a)–(d)) and experimental ((e)–(h)) results for reconstructed hologram using zigzag-type layout with multi-depth image conditions. Focused on Mars, = 0.25 m ((a) and (e)); Earth,
= 0.5 m ((b) and (f)); Venus,
= 0.75 m ((c) and (g)); and Mercury,
= 1 m ((d) and (h)), which are indicated by yellow markers, respectively.
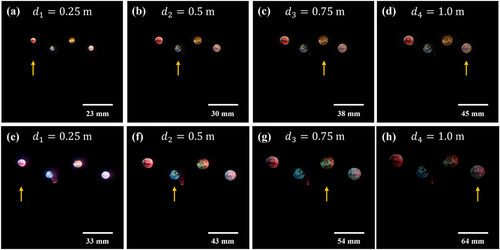
It can be observed that multi-depth full-color images through the MDSF method are well-reconstructed with less speckle noise. A small spot-like signal around the ‘Earth’ image, shown in the optical reconstruction results, originates from a leakage of non-diffractive light that passed through a nearby iris on the virtual plane. To avoid such noise, it is helpful to set a sufficiently far distance between the filtering focus and non-diffractive light on the virtual plane, as shown in the case of the Venus image.
3.3 Image quality assessment with various metrics
As stated in the introduction, compared to the single-step Fresnel diffraction method with random phase (SSF), the proposed MDSF method may provide better image quality since it uses complex amplitude information to reconstruct. On the other hand, the degradation of image quality between conventional DSF and MDSF is quite small, even though we can use a much larger projection region in the MDSF method. To verify this, Figure shows the reconstruction images for image quality assessment of the proposed method to previous approaches, which are numerically calculated with monochromatic light of 520 nm wavelength. Here, we compared the reconstruction images by using SSF (Figure (a)), conventional DSF method (Figure (b)), and the proposed MDSF method with three (Figure (c)) and five (Figure (d)) foci, respectively. Similar to previous sections, coordinate values of the multiple foci for the case of Figure (d) are given as (−13.8, 7 mm),
(−6.9, 11 mm),
(0 mm, 7 mm),
(6.9, 11 mm), and
(13.8, 7 mm). Among them, a middle focus and three middle foci are only used for the cases of Figure (b) and (c), respectively. For all cases, the distance parameters are set to
= 0.25 m,
= 0.75 m, and the reconstructed image length with
22.1 mm, using the image ‘Baboons’ composed with the resolution of 2048 × 2048. From the red box region of the whole image, magnified images of the blue box are shown for visual comparison.
Figure 5 Comparison of the image quality using simulation results. (a) Single-step Fresnel diffraction method with random phase. (b) The conventional DSF method. (c) The MDSF method with three foci. (d) The MDSF method with five foci.
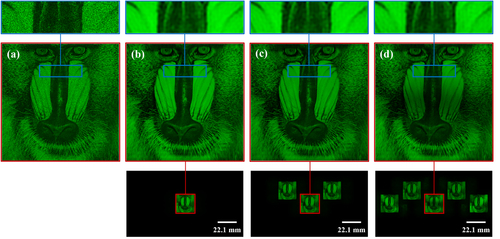
Before the comparison using quantitative data, we can also directly observe the differences k image qualities. Due to the random phase multiplication in the Fresnel diffraction method, Figure (a) shows significant speckle noise and unclear boundaries in the reconstructed image compared to other figures. In addition, if we compare Figure (b)–(d), although the small amount of degradation in reconstructed image quality exists as the number of foci increases, it still maintained sufficiently high image uniformity and low speckle noise compared to the SSF case.
To assess the quality of the reconstructed images quantitatively, we adopt three representative measurement methods—PSNR, MSSIM, and the speckle contrast [Citation29–31]. The PSNR, which is based on structural mean squared error (MSE) between two images, is defined as
(9)
(9) where
and
are the number of pixels vertically and horizontally for the sample image, and
is the dynamic range of allowable image pixel intensities, which is
in 8-bits/pixel gray-level image.
The structural similarity index measure (SSIM) can be the method of image quality assessment with better reliability, which is used for measuring similarity between the original and reconstructed images based on three parameters: luminance (), contrast (
), and structure (
). The formula of SSIM is
(10)
(10) Here, the detailed expression of each component can be found in reference [Citation29]. The MSSIM index to evaluate the overall image quality is represented as follows:
(11)
(11) Finally, the speckle contrast (
) is the quantitative image quality method that does not need the reference image, often used to measure the spatial noise for laser-projected images. The speckle contrast is represented as
(12)
(12) where
is the standard deviation of the pixel intensity, and
is the mean value of the pixel intensity [Citation31].
According to the above equations, the higher value of PSNR and MSSIM indicates a better image quality, whereas the lower value of parameter suggests the better case. The assessment results of Figure , including other sample images (‘Baboon,’ ‘Lena,’ ‘Cameraman,’ ‘Earth,’ and ‘Parrots’), using three metrics are summarized in Table . Figure outlines the normalized data after averaging all the cases of sample images.
Figure 6 Normalized average image quality assessment results of 5 sample images.
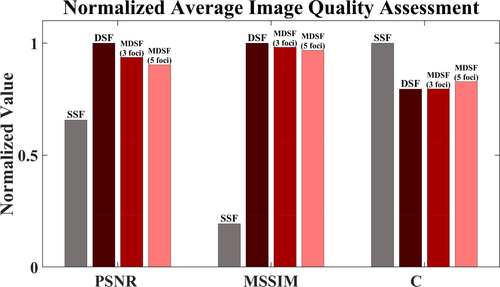
Table 1 Image quality assessment results of each sample image.
Through these data, regardless of the image type, it is shown that the proposed MDSF method has higher performance regarding all quality assessment metrics than the SSF. On the other hand, as the number of foci increases, there is only small degradation of the evaluation values, especially in MSSIM. Therefore, the quantitative assessment results match well with the observation results. We expect that this small image degradation occurs due to the crosstalk of a higher-order diffraction field into the misallocated iris. However, it is verified that complex amplitude encoding with a multi-focus filtering plane is more effective on speckle noise suppression than the random phase distribution in aspects of numerical results.
4. Conclusion
In this paper, we proposed the MDSF method for enlarging the projection region with a multi-focus filtering plane, which can display the different depths of images at different locations. In addition, we studied the practical iris layout based on the diffraction principle by avoiding the conjugate field and crosstalk of higher-order diffraction field on the virtual plane. Experiment results of four different images located at multi-depth condition were demonstrated. We also verified the image quality using numerical results compared with SSF with random phase and conventional DSF method. As a result, we found that increasing the number of foci has only a small degradation effect in image quality, while it can use much larger projection region. We hope this study can be useful for the various projection type holographic display or AR-HUD in automobiles.
Disclosure statement
No potential conflict of interest was reported by the author(s).
Additional information
Funding
Notes on contributors

Young-Jun Ann
Young-Jun Ann received his B.S. degree from the School of Electronics Engineering, Kyungpook National University, Daegu, Republic of Korea, in 2022. He is currently taking his M.S. degree at Kyungpook National University. His research focuses on three-dimensional (3D) displays, AR/VR systems, and holographic display applications.

Seung-Yeol Lee
Seung-Yeol Lee received Ph.D. in 2014 from the School of Electrical Engineering, Seoul National University, Republic of Korea. In 2016, he was a researcher at Electronics and Telecommunications Research Institute (ETRI). He is currently an associate professor at the School of Electronic and Electrical Engineering, Kyungpook National University, Daegu, Republic of Korea.
References
- J. Xiong, E.L. Hsiang, Z. He, T. Zhan, and S.T. Wu, Light Sci. Appl. 10 (1), 1–30 (2021). doi:10.1038/s41377-021-00658-8
- C. Chang, K. Bang, G. Wetzstein, B. Lee, and L. Gao, Optica 7 (11), 1563–1578 (2020). doi:10.1364/OPTICA.406004
- H.J. Jang, J.Y. Lee, J. Kwak, D. Lee, J.H. Park, B. Lee, and Y.Y. Noh, J. Inf. Disp. 20 (1), 1–8 (2019). doi:10.1080/15980316.2019.1572662
- J. Skirnewskaja, and T.D. Wilkinson, Adv. Mater. 34 (19), 2110463 (2022). doi:10.1002/adma.202110463
- A. Maimone, A. Georgiou, and J.S. Kollin, ACM Transactions on Graphics 36 (4), 1–16 (2017). doi:10.1145/3072959.3073624
- Y. Huang, E. Liao, R. Chen, and S.T. Wu, Appl. Sci. 8 (12), 2366 (2018). doi:10.3390/app8122366
- B. Mullins, P. Greenhalgh, and J. Christmas, SID Symposium Dig. Tech. Pap. 48 (1), 886–889 (2017). doi:10.1002/sdtp.11770
- R. Bräuer, U. Wojak, F. Wyrowski, and O. Bryngdahl, Opt. Lett. 16 (18), 1427–1429 (1991). doi:10.1364/OL.16.001427
- J.W. Goodman, Speckle phenomena in optics: theory and applications ((SPIE Press, Bellingham, 2020)).
- Y. Mori, T. Fukuoka, and T. Nomura, Appl. Opt. 53 (35), 8182–8188 (2014). doi:10.1364/AO.53.008182
- S. Choi, M. Gopakumar, Y. Peng, J. Kim, M. O’Toole, and G. Wetzstein, in Proceedings of the ACM SIGGRAPH Conference (2022), p. 1–9.
- R.W. Gerchberg, Optik 35 (2), 237–246 (1972).
- Y. Deng, and D. Chu, Sci. Rep. 7 (1), 1–12 (2017). doi:10.1038/s41598-017-06215-x
- J.H. Park, J. Inf. Disp. 18 (1), 1–12 (2017). doi:10.1080/15980316.2016.1255672
- C.K. Hsueh, and A.A. Sawchuk, Appl. Opt. 17 (24), 3874–3883 (1978). doi:10.1364/AO.17.003874
- X. Li, J. Liu, T. Zhao, and Y. Wang, Opt. Express 26 (3), 2349–2358 (2018). doi:10.1364/OE.26.002349
- H. Song, G. Sung, S. Choi, K. Won, H.S. Lee, and H. Kim, Opt. Express 20 (28), 29844–29853 (2012). doi:10.1364/OE.20.029844
- C. Chang, Y. Qi, J. Wu, J. Xia, and S. Nie, Opt. Express 25 (6), 6568–6580 (2017). doi:10.1364/OE.25.006568
- L.G. Neto, D. Roberge, and Y. Sheng, Appl. Opt. 35 (23), 4567–4576 (1996). doi:10.1364/AO.35.004567
- S. Reichelt, R. Häussler, G. Fütterer, N. Leister, H. Kato, N. Usukura, and Y. Kanbayashi, Opt. Lett. 37 (11), 1955–1957 (2012). doi:10.1364/OL.37.001955
- S. Choi, J. Kim, Y. Peng, and G. Wetzstein, Optica 8 (2), 143–146 (2021). doi:10.1364/OPTICA.410622
- F. Zhang, I. Yamaguchi, and L.P. Yaroslavsky, Opt. Lett. 29 (14), 1668–1670 (2004). doi:10.1364/OL.29.001668
- N. Okada, T. Shimobaba, Y. Ichihashi, R. Oi, K. Yamamoto, M. Oikawa, T. Kakue, N. Masuda, and T. Ito, Opt. Express 21 (7), 9192–9197 (2013). doi:10.1364/OE.21.009192
- T. Shimobaba, T. Kakue, N. Okada, M. Oikawa, Y. Yamaguchi, and T. Ito, J. Opt. 15 (7), 075405 (2013). doi:10.1088/2040-8978/15/7/075405
- K. Wakunami, P.Y. Hsieh, R. Oi, T. Senoh, H. Sasaki, Y. Ichihashi, M. Okui, Y.P. Huang, and K. Yamamoto, Nature Communications 7 (1), 1–7 (2016). doi:10.1038/ncomms12954
- W. Wang, X. Zhu, K. Chan, and P. Tsang, Presented at 2018 IEEE 27th International Symposium on Industrial Electronics (ISIE), Vancouver, BC, Canada (2018).
- S. Kazempourradi, E. Ulusoy, and H. Urey, J. Inf. Disp. 20 (2), 45–59 (2019). doi:10.1080/15980316.2019.1606859
- O. Mendoza-Yero, G. Mínguez-Vega, and J. Lancis, Opt. Lett. 39 (7), 1740–1743 (2014). doi:10.1364/OL.39.001740
- Z. Wang, and A.C. Bovik, Modern image quality assessment (Springer International Publishing, New York, 2007).
- D.R.I.M. Setiadi, Multimed. Tools. Appl. 80 (6), 8423–8444 (2021). doi:10.1007/s11042-020-10035-z
- J. G. Manni, and J. W. Goodman, Opt. Express 20 (10), 11288–11315 (2012). doi:10.1364/OE.20.011288