
Abstract
We propose a new climatological background error covariance matrix suitable for the so-called BlendVar scheme, which deals with a problem on how to best preserve large-scale information of the global coupling system in the high-resolution limited area model (LAM) analysis. The BlendVar scheme is composed from a Digital Filter (DF) Blending step, treating the inclusion of the global model analysis, and from high resolution 3D-Var. The new background error covariance matrix forces 3D-Var to act mainly at smaller scales. We created a LAM assimilation ensemble forecasting system, where the DF Blending step is present, to sample the new matrix. To build and demonstrate properties of such a background error covariance matrix, we use the high-resolution model ALADIN coupled to the global model ARPEGE. The DF Blending step is taking advantage of ARPEGE 4D-Var assimilation system while 3D-Var is improving the small-scale part of ALADIN analysis. We assess the impact of using the new background error covariances in the BlendVar scheme with the full data assimilation cycle over the period of one month. We also compare performance of the new BlendVar set-up with respect to DF Blending and 3D-Var used alone. Objective scores with respect to radiosonde and aircraft observations favour the BlendVar scheme with the newly specified background error statistics.
1. Introduction
Moving limited area models (LAM) to higher and higher resolution gives an urgent need for a good quality of initial conditions at relevant finer scales. Higher resolution of LAMs allows better representation of small-scale phenomena, on the other hand, large scales are not so well specified in a LAM analysis compared to a hosting global model analysis (Berre, Citation2000). The size of the LAM domain is not the only factor, but also the analysis method used in the respective models. Since LAMs already depend on host (usually global) models through lateral boundary conditions, several ideas were proposed to also use a host model analysis to improve LAMs initial conditions to compensate a lack of information on the largest scales. The idea is to include a large-scale part of a host model analysis into a meso-scale background or analysis provided by LAM. This allows for the preservation of large-scale circulation structures from the host model analysis and to profit from its data assimilation method, which is often more advanced than in LAM (e.g. 4D-Var vs. 3D-Var, etc.). Brožková et al. (Citation2001) introduced the Digital Filter (DF) Blending method, which is applied in spectral space, and it uses a low-pass digital filter in order to incrementally blend a large-scale analysis with small scales of LAM. This method became popular and was used in ensuing applications. Brožková et al. (Citation2006) used DF Blending to improve near coastal atmosphere-ocean fluxes for the forcing of fine-scale oceanographic models. DF Blending is also used in limited area ensemble forecasting (Derková and Belluš, Citation2007). Široká et al. (Citation2001) proposed to combine DF Blending with a three-dimensional variational data assimilation (3D-Var) method, with DF Blending applied either before (BlendVar) or after (VarBlend) the 3D-Var method. Guidard et al. (Citation2006) shows a positive impact of the BlendVar scheme on a 24 h assimilation of observations from intensive observing period 14 of the Mesoscale Alpine Programme. A conceptually similar method to VarBlend with a low-pass spatial filer is proposed by Yang (Citation2005), without explicitly saying what analysis method was used. Wang et al. (Citation2014) tested Blending, BlendVar and VarBlend by adapting the method of Yang (Citation2005). Wang et al. (Citation2014) found the results of blending-based schemes promising with respect to 3D-Var alone.
Since DF Blending has no relationship with statistical concepts such as maximum likelihood and error representation,Guidard and Fischer (Citation2008) proposed to use the host model analysis as an extra source of information to be added to the cost function of LAM 3D-Var. Dahlgren and Gustafsson (Citation2012) used conceptually the same approach but assimilating only the vorticity field from the host model and using error covariances that were not simplified by a diagonal matrix as in Guidard and Fischer (Citation2008). Peng2010; Liu2011; Xie2010 incorporate the host model information by a scale-selective assimilation that could be described by several steps: (1) a low-pass filtering of a host model analysis; (2) separation of large and small scales of a LAM background; (3) an assimilation of the low-pass filtered host model analysis as pseudo observations to the low-pass filtered LAM background; and (4) addition of the small-scale background to the large-scale LAM analysis. Kretschmer et al. (Citation2015) propose to not only use host model information in LAM but also to use LAMs to improve the host model analysis by performing assimilation over a composite state of several LAMs and the host model.
To tackle spatial and temporal variations of background error covariances, many meteorological centres run global ensemble data assimilation systems (Isaksen et al., Citation2010; Berre et al., Citation2015; Buehner et al., Citation2015). The systems are computationally costly, however they help to adapt background error covariances to the weather situation of the day. In this context, it becomes even more desirable to preserve results of such advanced schemes deployed by global models in relevant scales of the LAM analysis. To reach this goal, DF Blending presents couple of advantages in comparison with other approaches. It is technically easier in contrast to a possible deriving of host model covariances of the day in the term of Guidard and Fischer (Citation2008) proposal, for example. The digital filter techniques make it possible to combine smoothly scales of a host analysis and a high-resolution guess without a need of simplifications (e.g. simplifying assumptions for error covariances of the
term or absence of a water vapour treatment).
The DF Blending method, when applied to construct a cycled update of the LAM initial conditions, preferably in a synchronous way with the global model assimilation cycle, can be viewed as a poor-man indirect data assimilation method. Despite its simplicity, it outperforms not only a downscaling (Brožková et al., Citation2001; Derková and Belluš, Citation2007) but also the 3D-Var method used alone, as confirmed by results discussed in Section 5. Of course the question is whether DF Blending and/or its combination with 3D-Var can still compete with LAM 4D-Var for example. We do not address this issue here, since it is going out of the scope of this paper. In addition, opting for more complex 4D variants of data assimilation methods means higher computing cost not always easily affordable with respect to growing demands on timeliness of the high-resolution forecast production.
Combining DF Blending and 3D-Var (BlendVar) brings further improvements to the quality of forecasts, as shown by Guidard et al. (Citation2006). In this paper, we are enhancing the BlendVar scheme by a new construction of the background error covariance matrix (B matrix) suitable for it. Berre (Citation2000) pointed out that background error sampling for scales larger than the quarter of the longest wave over the area (here the LAM domain size) becomes questionable. Berre et al. (Citation2006) shows that the analysis process uses the observations to reduce the amplitude of the large-scale part of the background errors. Knowing these two pieces of information one should expect that application of 3D-Var after DF Blending might distort largest scales taken from a global analysis. First natural idea to overcome this limitation is to create a covariance matrix sampled from an ensemble which consists of DF Blending and 3D-Var where DF Blending is used to combine analyses of a global data assimilation ensemble with first guesses of a LAM data assimilation ensemble. However, horizontal resolution of global ensemble data assimilation members is typically much coarser (50 km in our case) than the one of the LAM (
4.7 km). Hence undesirable effects of such an important resolution jump (Caian and Geleyn, Citation1997) may represent a handicap. This is why we explore another approach, we build on the most optimal analysis given by the global data assimilation (estimated horizontal resolution is in our case
25 km) using flow-dependent wavelet correlations (Berre et al., Citation2015). In order to sample background error covariances, we create a LAM BlendVar ensemble where every member is blended with the same global analysis and following 3D-Var is using perturbed observations. It is a kind of an ensemble-based analogue to the constant coupling strategy used by Široká et al. (Citation2003) to derive background error statistics in adaptation of the so-called NMC method. The large-scale error influence of the coupling model is purposefully suppressed to shift impact of 3D-Var towards smaller scales. By doing so, there is of course a certain risk linked to a possible spin-up of the large-scale variance spectra; we address this question in Section 4.
The paper is organized as follows. In Section 2, we briefly describe our experimental framework of the ALADIN system and components we have used to specify and asses background error covariances. Two different background error covariance formulations are derived and discussed in Section 3 and their respective comparison is presented in Section 4. Afterwards we evaluate a performance of two BlendVar schemes using different background error specifications, DF Blending and 3D-Var alone in Section 5.
Figure 1. Vertical profiles of background error standard deviations for ENSBV (red solid line) and ENS (green dashed line) for: (a) specific humidity, (b) vorticity, (c) specific humidity rescaled, (d) vorticity rescaled.
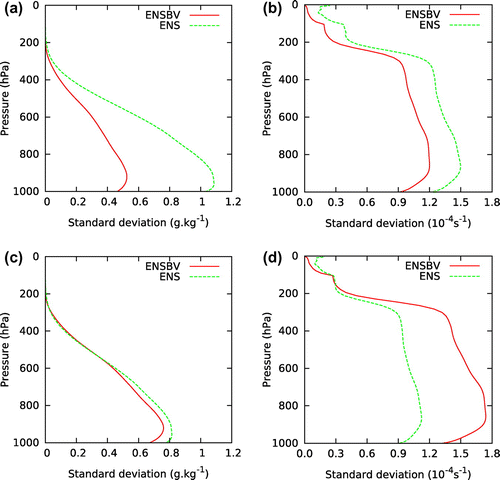
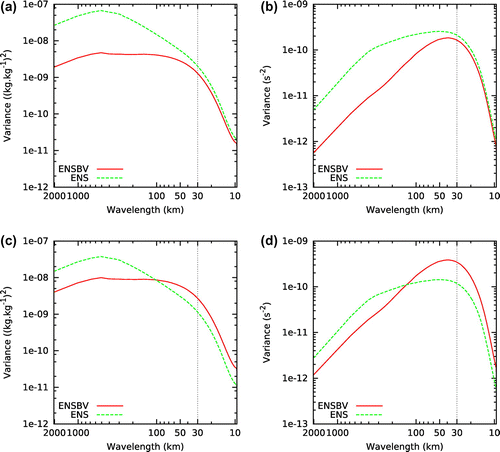
Figure 2. Horizontal variance spectra of background errors at 850 hPa (the model level 63) for (a) specific humidity, (b) vorticity, (c) specific humidity with rescaling, (d) vorticity with rescaling. The red solid line indicates the ENSBV spectra, the green dashed line indicates the ENS spectra and the black dotted line indicates wavelength of the DF Blending cut-off truncation.
2. NWP system and assimilation schemes
We use the numerical weather prediction (NWP) model ALADIN (Radnóti et al., Citation1995; Aladin, Citation1997). It is a spectral model based on the global NWP system IFS/ARPEGE (Integrated Forecasting System/Action de Recherche Petite Echelle Grande Echelle). Our ALADIN set-up comprises 4.7 km horizontal resolution with a linear grid and 87 vertical levels. The computational domain covers a central part of Europe (2500 km x
2000 km). A 3-h coupling frequency is used to couple the model with the global model ARPEGE (Courtier et al., Citation1994), which features a 4D-Var data assimilation with flow-dependent background error correlations (Berre et al., Citation2015).
In our experimental framework, all experiments use 6-hour assimilation cycles synchronous with the ARPEGE assimilation cycle. Initial conditions are obtained by DF Blending or 3D-Var or their combination BlendVar.
DF Blending combines large-scale information coming from the ARPEGE 4D-Var analysis with small scales of the high-resolution ALADIN background. It is applied to the upper-air fields of wind components, temperature and specific humidity. The cut-off wavelength of spectra is 30 km, which corresponds to the blending ratio 3.1 given by the empirical formula (Derková and Belluš, Citation2007). First, the spectra of both models are truncated to the cut-off wavelength. Afterwards the spectra are filtered by a non-recursive Dolph-Chebyshev digital filter (Lynch et al., Citation1997), which is set in agreement with the low-truncated spectra. The difference between both filtered models spectra is inflated back to nominal ALADIN truncation and is added to the ALADIN background. It can be expressed by a symbolic equation:
(1)
where ,
denotes the ALADIN background and the analysis respectively,
is the ARPEGE analysis interpolated to ALADIN resolution, T denotes change of truncation, where subscript H is high (nominal) ALADIN truncation and subscript L denotes low spectral truncation. The bar denotes the digital filter applied at low spectral resolution. We do not modify this DF Blending set-up when used in the BlendVar scheme.
The incremental formulation of 3D-Var is implemented in ALADIN and it profits from IFS/ARPEGE system by common interfaces, data flows and many observation operators, among other things. A general overview of ALADIN 3D-Var is given in Fischer et al. (Citation2005). The formulation of 3D-Var uses a diagonal observation error covariance matrix, since observation error correlations are not accounted for. Two background error covariance matrices are derived and discussed in the following sections. One is appropriate for the use with 3D-Var alone and the new formulated one is suitable for the 3D-Var part of the BlendVar scheme.
3. Background error covariances in 3D-Var
The multivariate formulation of background error covariances used in ALADIN was adapted by Berre (Citation2000) from the global IFS/ARPEGE system. General properties are as follows: the covariances are constructed homogeneous, isotropic and nonseparable, which means dependence of horizontal correlations on height and dependence of vertical correlations on horizontal scale. Linear regressions are used to partition model variables into balanced and unbalanced (regression residuals) components. This allows to reformulate analysis into new control variables: full vorticity, unbalanced divergence, unbalanced temperature, unbalanced surface pressure and unbalanced specific humidity. Then cross-covariances between errors of the model variables are represented by the balance relationship and the control variables have univariate covariances of errors.
3.1. Calculation of covariances for 3D-Var alone
An ensemble-assimilation method (Berre et al., Citation2006) is used for a sampling of background errors similarly to Brousseau et al. (Citation2011) with an offline (i.e. non-real-time) ALADIN ensemble. Four independent 3D-Var assimilation cycles with perturbed observations are used to provide the statistics. The perturbations are constructed as random draws from the normal distribution with zero mean and observation error variance while the background is perturbed implicitly through the forecast step of a 6-hour assimilation cycle. One member of the ALADIN ensemble is coupled with one member of the assimilation ensemble of the global model ARPEGE operationally run at Météo-France (Berre et al., Citation2009). The global ensemble horizontal resolution is 50 km during the sampling. We use the perfect model assumption and run the ALADIN ensemble (called ENS further on) over theperiod of 40 days, from 21 June to 30 July 2014. Assimilated observations are air pressure from ground stations SYNOP, temperature, relative humidity, wind speed and direction from aerological soundings TEMP, radiances from Spinning-Enhanced Visible and Infrared Imager (SEVIRI) on board the geostationary Meteosat-10 satellite, derived satellite product AMV (Atmospheric Motion Vector), temperature, wind speed and direction from aircraft measurements (AMDAR). Conventional observations (e.g. synoptic stations, radiosondes) as well as geostationary satellites measurements valid at analysis time are used while aircraft observations are collected within a 3-hour assimilation window. The most of the observations has already been assimilated in the driving ARPEGE ensemble but with a lower density and with independent perturbations.
Climatological statistics of background errors are then calculated from differences between pairs of ensemble members. The evolution of differences is driven by similar equations as the evolution of background errors and it is expected that they have the same correlation structure as background errors (Berre et al., Citation2006). The differences are computed from 6-h forecasts of the ALADIN ensemble assimilation cycle and the sample of 320 differences is obtained over the considered period. Due to homogeneity and isotropy assumptions, the sample for the computation of correlations is even larger for one particular separation (wave number).
Figure 3. Horizontal background errors correlation functions for temperature at 500 hPa (model level 34) for ENSBV (red solid line) and ENS (green dashed line).
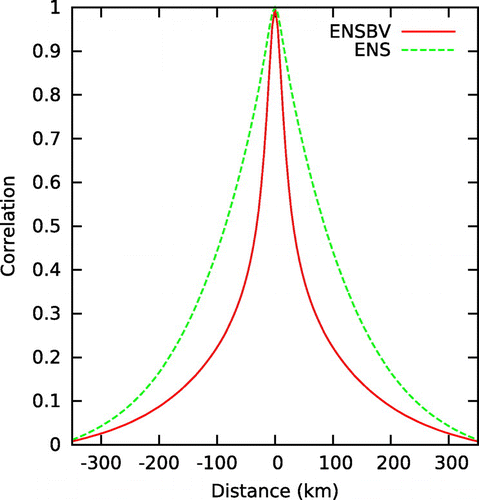
Figure 4. Vertical profiles of horizontal length scales for vorticity (vor) and specific humidity (q) for ENSBV (red lines) and ENS (green lines).
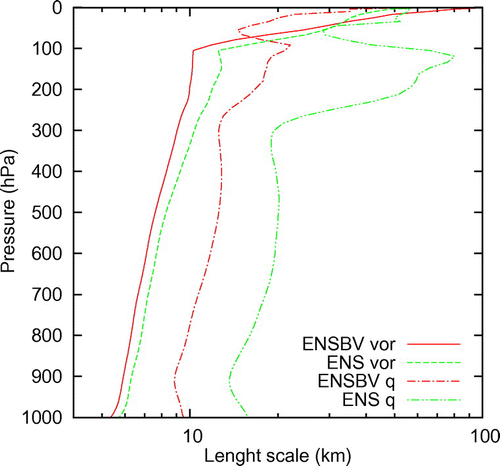
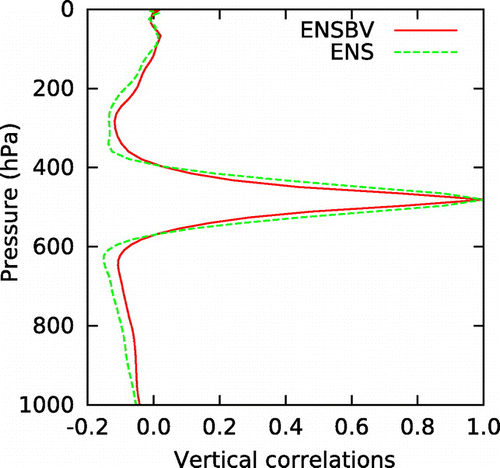
Figure 5. Vertical correlations at 500 hPa (model level 34) of temperature background errors for ENSBV (red solid line) and ENS (green dashed line).
3.2. Calculation of covariances for BlendVar
The DF Blending part of the BlendVar scheme intends to provide the large-scale component of the model initial state based on the 4D-Var ARPEGE analysis. Consequently, complementary 3D-Var should work on finer scales where it is expected to add more value in contrast to the already analysed large scales. Since the analysis acts on all scales according to background error covariances, we construct new ones that have the maximum of background error variance shifted towards small scales. To fulfil our demands, we create an ensemble that has large scales similar (forced to be the same) and small scales freely evolving by an assimilation cycle. Indeed, this is a BlendVar assimilation ensemble (called ENSBV further on) that consists of blending the high-resolution ARPEGE analysis (estimated to 25 km) with each member of ALADIN ensemble by DF Blending. Afterwards, the 3D-Var assimilation is applied with perturbed observations on each member of the ensemble. All four members of ENSBV are coupled with high-resolution ARPEGE forecasts in order to keep their large-scale flow similar within the 6-hour assimilation cycle. The period, the sample of observations and their perturbations are taken the same as in ENS. It is worth to mention that both ENS and ENSBV have the same set-up of 3D-Var, e.g. background errors and observation errors specification.
4. Comparison of covariances
The background errors will be compared in the following section. They are constructed for both ensembles, ENS and ENSBV, over the same period (21 June – 30 July 2014) in order to avoid any weather-related differences. The period was selected arbitrarily but still capturing different weather regimes from very unstable to stable ones. Statistics of background errors will be demonstrated by standard deviations, variance spectra, length-scale profiles, horizontal and vertical correlations and by cross-correlations between control variables. Finally, we will examine spin-up in both ensembles and in their variance spectra.
4.1. Standard deviations and variances
In our setup of 3D-Var, background error standard deviations can vary only vertically. Their vertical profiles for specific humidity and vorticity are shown on Fig. a and b. Standard deviations are reduced in ENSBV against ENS by 50% for specific humidity and temperature (not shown) and by
20% for vorticity and divergence (not shown). The shape of vertical profiles is very similar for both ensembles and all control variables. The vertical profiles even seem to be shifted by a constant for all variables (Fig. b) except humidity. Figure c and d shows vertical profiles after application of a tuning following the a posteriori diagnostic method proposed by Desroziers et al. (Citation2005). According to it, an optimally set system would have diagnosed values of standard deviation equal to values prescribed in the system. The method is based on specific assumptions, e. g. linear observation operator, uncorrelated background and observation errors and others discussed by Berre and Desroziers (Citation2010), which are not met in real systems. Still, the tuning based on this approach is expected to bring improvements. The diagnostics of standard deviations is computed from analysis and background departures from observations by an iterative procedure. Finally, a ratio of diagnosed to predefined standard deviations is used to rescale the system, i.e. to multiply standard deviations by this diagnosed ratio. The diagnostics showed underestimation of ENSBV standard deviations (the ratio equals 1.45) and overestimation of ENS standard deviations (the ratio equals 0.75). Rescaled specific humidity (temperature) standard deviations are very close between ENSBV and ENS while rescaled vorticity (divergence) standard deviations of ENSBV are larger than ENS ones.
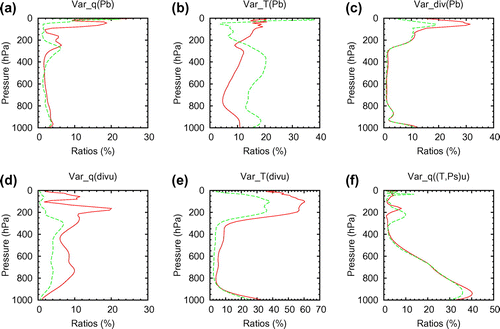
Figure 6. Vertical profiles of percentages of error variances (spectral averages) explained by balanced geopotential for specific humidity (a), temperature (b) and divergence (c), by unbalanced divergence for specific humidity (d) and temperature (e) and unbalanced temperature for specific humidity (f). The red solid line indicates the ENSBV profiles and the green dashed line the ENS profiles.
The variance spectra of background errors indicate that variance of long waves is drastically reduced in ENSBV against ENS (Fig. a and b) while the variance spectra for waves shorter than 30 km are close between ENSBV and ENS. The vertical line at wavelength 30 km indicates the DF Blending cut-off truncation. It is worth noting that the DF Blending cut-off truncation is in the first third of the variance spectra even if the cut-off wavelength seems short. After rescaling, the long-wave variance of ENSBV is still much smaller than ENS but for waves shorter than 100 km the variance of ENSBV become larger than ENS. This is a desired property as the greatest reduction in the background error occurs at the wavenumber for which the background error variance is a maximum (Daley, Citation1991). In other words, we will modify long waves of background fields by 3D-Var in much smaller extent when we use the ENSBV background error specification against the ENS one.
4.2. Auto-correlations
The relative amount of small-scale variance is larger in ENSBV compared to ENS. This has a consequence on sharper horizontal correlations in ENSBV. Figure shows large decrease of background error horizontal correlations in ENSBV compared to ENS for temperature in the middle troposphere (shown for 500 hPa). The horizontal correlations in ENSBV are more than twice smaller at the distance of 100 km than in ENS. To confirm the persistence of this behaviour for all levels and variables, we show vertical profiles of the sharpness of horizontal correlation functions represented by length scales (Fig. ). We use definition of the length scale proposed by Berre (Citation2000) Equation (2).
On the other hand, the difference of vertical correlations is less pronounced between the ensembles. As an example we show vertical temperature correlations in the middle troposphere (500 hPa) on Fig. . There can be seen slightly smaller correlations in ENSBV compared to ENS, although from the overall perspective they are very similar.
Figure 7. Temporal evolution of the surface pressure tendency root mean square averaged over the model domain and 8 forecasts as a function of the forecast range for both ensembles, ENSBV (red solid line) and ENS (green dashed line).
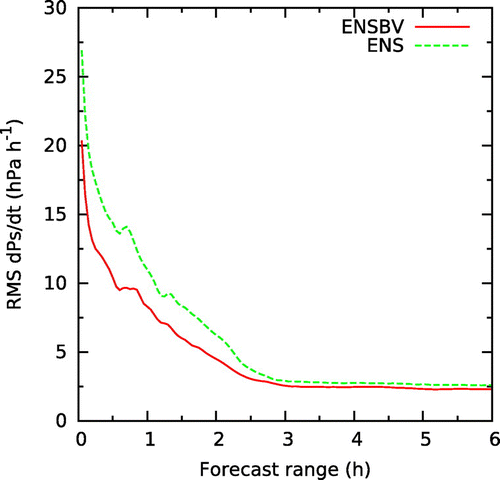
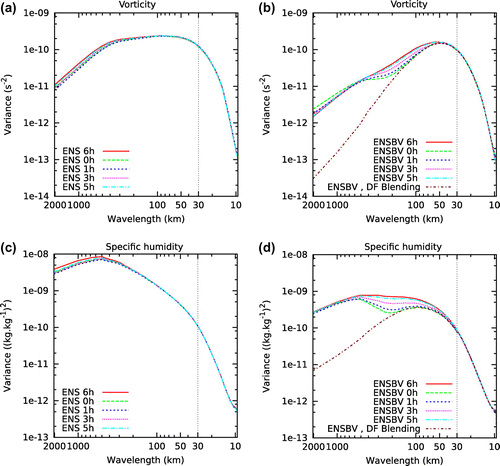
Figure 8. Evolution of horizontal variance spectra of background errors at 500 hPa (model level 34) for (a) vorticity of ENS, (b) vorticity of ENSBV, (c) specific humidity of ENS, (d) specific humidity of ENSBV. The estimated spectra for +6 h (red solid line), +0 h (green dashed line), +1 h (blue short dashed line), +3 h (pink dotted line), +5 h (light blue dashed dotted line) and variance spectra after application of DF Blending in each member of ENSBV (brown short dashed dotted line).
Less correlated background errors in ENSBV make the 3D-Var analysis increments to contain mainly smaller scales and not to distort the long waves already obtained from the DF Blending. Such sharp analysis increments imply a need for high-density observing networks in order to control the data-assimilation system effectively (Brousseau et al., Citation2011), namely at small scales. Beside high resolution of observations it is necessary to have uncorrelated observation errors since to account for their correlation is difficult to implement in practice.
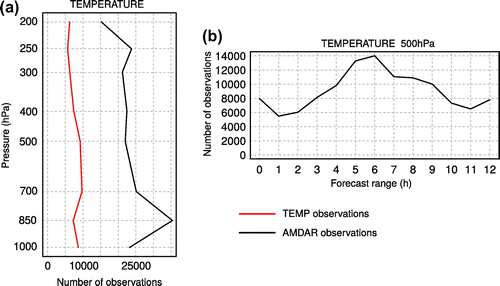
Figure 9. Number of observations used for verification: (a) vertical profile of number of radiosonde (red line) and aircraft (black line) temperature observations used in verification of assimilation cycles; (b) evolution of number of aircraft temperature observations by forecast range. The used observations are divided to vertical bins, where thresholds are halves of intervals between two labelled levels (e.g. level 850 hPa uses the interval 775–900 hPa).
4.3. Cross-correlations
Propagation of information from one control variable to the others is studied by percentage of explained error variance that is defined as a ratio of a balanced part to the full control variable, similarly to Berre (Citation2000). A degree of geostrophism is approximated by a linear regression between vorticity and geopotential in ALADIN. Variance explained by geopotential is low for divergence and specific humidity and it is similar for both ensembles (Fig. a and c). It is not surprising since geopotential could be seen as a predictor of large scales (Berre, Citation2000). Tropospheric variance of temperature is less explained by geopotential in ENSBV than in ENS (Fig. b). This is in agreement with the overall shift of the variance spectra towards small scales in ENSBV (Fig. c and d). The linear balance of temperature and specific humidity with unbalanced divergence is increased in ENSBV against ENS, Fig. d and e. We see this as a property of giving more weight to the small scales. The same is valid for the balance between specific humidity and unbalanced temperature in the lower troposphere, Fig. f.
4.4. Spin-up
Some spin-up effect is always present at the beginning of the model integration due to imbalances introduced by the analysis step and in the case of LAM also by lateral coupling refreshment. This is a spin-up in a classical understanding and is being addressed by initialization techniques and/or deployment of balance-type constraints within the analysis procedure itself. As discussed in Brousseau et al. (Citation2011), it is desirable to reduce its duration namely in case of more frequent analysis updates. Here, we focus on a comparison between ENS and ENSBV ensembles. Figure shows a temporal evolution of the surface pressure tendency measured as the root mean square average over the model domain and over eight assimilation cycle integrations. Higher surface pressure tendency values at the beginning of the forecast present the need for adjusting model fields to their internal balance, in other words they mark the spin-up. Both ensembles get rid of the spin-up roughly at the same forecast length, between two and three hours of integration. Nevertheless, the ENSBV ensemble shows smaller imbalances compared to the ENS one along the whole 6 h guess integration.
Here, we also address the growth of background errors within the assimilation cycle guess computation, in order to examine the respective behaviour of ENS and ENSBV spectra and a spin-up in terms of the spectra shape saturation. Forecast errors naturally grow with forecast length and are also subject to diurnal cycle effects, such as onset and decay of turbulence, moist deep convection life cycle and so on. To alleviate the diurnal cycle dependency, we work with a sample containing computations from all four analysis times of 00, 06, 12 and 18 UTC in one melting pot. Unfortunately, our experimental framework does not allow to work with forecast ranges longer than 6 h since there are no global assimilation cycle data available. Therefore, we concentrate on the variance spectra evolution with respect to their +6 h state.
This can already give a good idea on the spin-up effect saturation in each ensemble. Results are presented for both ensembles on Fig. for vorticity and specific humidity at a model level close to 500 hPa, for forecast ranges +0 h, +1 h, +3 h, +5 h, +6 h and the DF Blending step. In the ENS case, we see some spin-up effect from wavelengths longer than 300 km up to the longest waves, where spin-up is a bit more pronounced. In ENSBV, due to a drastic reduction of larger scale variances by the DF Blending step, one would expect a progressive variance growth starting from wavelengths a bit longer than the DF Blending cut-off till the longest ones. However, since in the first derivation of ENSBV, we used the same B matrix as in ENS, see Section 3.2, variances are increased in the longest wavelengths immediatelyby 3D-Var, and then they are controlled by lateral coupling within the ensuing integration. The progressive growth (spin-up) is thus visible for the intermediate wave lengths. Nevertheless, in both ENS and ENSBV the shape of variances at +5 h is already very close to the one at +6 h, and so this suggests there is a very little room for some remaining spin-up behind +6 h forecast range. We see also that our first derivation of ENSBV can be further improved as discussed in the conclusion.
Figure 10. Vertical profiles of 6-hour forecasts RMSE inside assimilation cycles verified against radiosonde observations: (a) relative humidity profiles, (b) wind speed profiles, (c) temperature profiles. The profiles are shown for BlendVar_ensbv (red line), BlendVar_ens (black line), Blending (yellow line) and 3D-Var_ens (green line). Full circles denotes a statistically significant difference (at the 95% confidence level) with respect to the scores of BlendVar_ensbv.
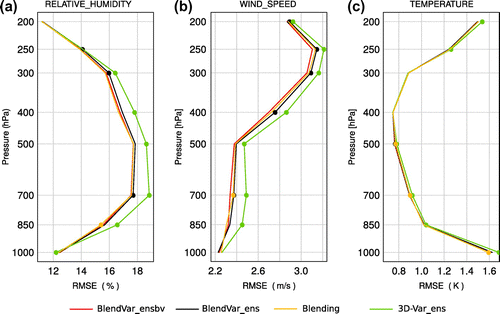
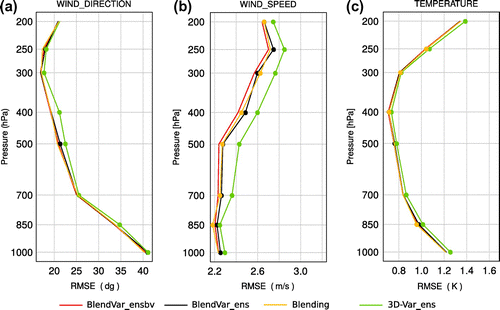
Figure 11. Vertical profiles of 6-hour forecasts RMSE inside assimilation cycles verified against aircraft observations (AMDAR): (a) wind direction profiles, (b) wind speed profiles, (c) temperature profiles. The profiles are shown for BlendVar_ensbv (red line), BlendVar_ens (black line), Blending (yellow line) and 3D-Var_ens (green line). Full circles denotes a statistically significant difference (at the 95% confidence level) with respect to the scores of BlendVar_ensbv.
5. Experiments and verification
5.1. Setup and methods
The ENSBV background errors statistics are more appropriate for the BlendVar scheme than ENS ones according to the aforementioned comparison. In order to verify this, we prepare four experiments. We are comparing not only BlendVar schemes with two different background errors statistics but also two more conservative approaches – DF Blending and the 3D-Var assimilation. The experiments are following:
BlendVar_ensbv contains the BlendVar scheme and the tuned ENSBV background errors statistics.
BlendVar_ens contains the BlendVar scheme and the tuned ENS background errors statistics.
Blending contains the DF Blending scheme only.
3D-Var_ens contains only the 3D-Var scheme with the tuned ENS background errors statistics.
For verification of upper air fields, we use radiosonde observations TEMP (temperature, wind, geopotential, humidity) and aircraft observations AMDAR (temperature, wind). AMDAR observations are binned to one hour slots, centred with respect to verification times. It should be noted that these observation types are also used in the assimilation and production analysis, however, their number depend on cut-off times, binning and the quality control set-up. Figure shows the total number of temperature observations used in the verification period; for other verified parameters the number is very similar. The vertical variability of TEMP and AMDAR data is presented on Fig. a for verification of assimilation cycle guesses. The AMDAR observation number evolution per forecast range at the level 500 hPa, used for verification of the production forecast, is presented on Fig. b. For verification of screen level parameters, we use observations from synoptic stations.
5.2. Verification results
The Blending and both BlendVar experiments forecast accuracy of the assimilation cycles clearly outperforms the 3D-Var_ens experiment quality. We present this by vertical profiles of RMSE of 6-hour forecasts, which are used as guesses (backgrounds) for a following assimilation step in the assimilation cycles. Figures and show the clear positive impact of incorporating DF Blending into our set-up of the assimilation cycles for several variables and against radiosondes and aircraft observations. Although the Blending and both BlendVar experiments RMSE scores of the assimilation cycles are close, the BlendVar_ensbv experiment outperforms the others slightly. The BlendVar_ensbv experiment improves the RMSE of wind speed the most and this is confirmed by the significance T-test (Figs. b and b). BIAS was not significantly different between the experiments.
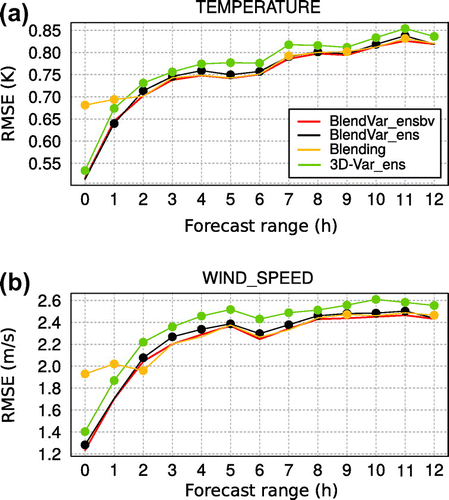
Figure 12. Time evolution of RMSE with forecast range for (a) temperature, (b) wind speed at 500 hPa verified against radiosondes and aircraft observations together. The scores are shown for BlendVar_ensbv (red line), BlendVar_ens (black line), Blending (yellow line) and 3D-Var_ens (green line).
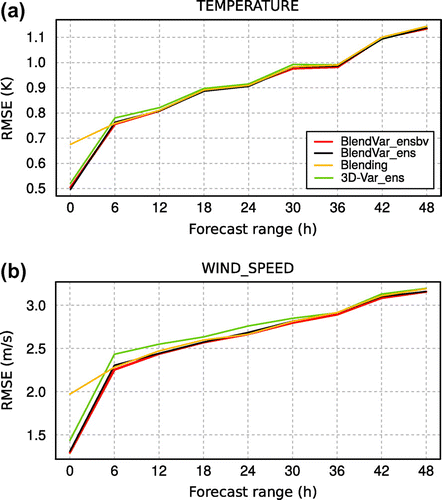
Figure 13. Time evolution of RMSE with forecast range by hour for (a) temperature, (b) wind speed at 500 hPa verified against aircraft observations. The scores are shown for BlendVar_ensbv (red line), BlendVar_ens (black line), Blending (yellow line) and 3D-Var_ens (green line). Full circles denotes a statistically significant difference (at the 95% confidence level) with respect to the scores of BlendVar_ensbv.
The time evolution of RMSE with the forecast range in the production of forecasts is constructed against radiosonde and aircraft observations together. We run the production of forecasts only at 0 and 12 UTC and if we had compared the experiments only with radiosonde observations there would have been too small sample of observations for forecast ranges 6 h, 18 h, 30 h,... A similar problem would have been with aircraft observations because almost no aircraft observations are available at 0 UTC. The comparison against both types of observations together and use of both runs (0, 12 UTC) for computation of the scores minimizes the problem.
The evolution of RMSE with the forecast range is presented on Fig. at 500 hPa for temperature and wind speed. It can be seen that any analysis using 3D-Var is closer to observations at a 0 h forecast than the Blending experiment. It is not surprising since the DF Blending method is taking into account observations indirectly from analyses of the global model ARPEGE while 3D-Var uses observations directly. The situation is different for the 6-hour production forecast range, the 3D-Var_ens experiment is worse than any experiment based on DF Blending. This confirms the verification results of the assimilation cycles. Slight degradation of the 3D-Var_ens experiment RMSE could be seen up to the 24-hour forecast range compared to the DF Blending based schemes. The BlendVar_ensbv experiment has the lowest RMSE of wind speed at the 0-hour and the 6-hour forecasts for most of the vertical levels even if the score is very close to the other experiments based on DF Blending. The impact of BlendVar_ensbv with respect to Blending and BlendVar_ens is neutral for the other verified parameters and also for screen level parameters and pointwise verification of precipitation.
In addition we present a closer look to verification scores for the first 12 h of forecast by verification against aircraft observations on hourly bases (Fig. ). Again the 3D-Var_ens experiment stays clearly apart the other ones due to its highest RMSE, both for temperature and wind speed, and for all verified ranges except the first two hours, where 3D-Var pushes the solution closer to observations - this is of course true for any experiment with 3D-Var. Regarding the experiments using DF Blending, we notice higher RMSE for the BlendVar_ens, marked by the significance T-test for almost all ranges and for both temperature and wind. In short, using background error statistics projecting analysis increments to the largest scales means to reanalyse scales already treated by the ARPEGE analysis as pointed out by Široká et al. (Citation2003). By consequence, we end up with a result which is worse than the one of Blending. In contrast to it, the BlendVar_ensbv experiment shows a slight improvement with respect to Blending, albeit tiny. Moreover, it is interesting to see that the significance T-test marks an improvement also for some forecast ranges longer than 6 h, which means the effect is not limited to the shortest lead times. This result shows the necessity to use appropriate background errors to still improve initial conditions on top of what we obtain by the already quite powerful DF Blending method.
6. Summary and concluding remarks
In this paper, we have described the BlendVar assimilation scheme and the sampling of background error covariances suitable for it. The idea is to profit from the advanced global ARPEGE assimilation system and to improve and maintain small-scale features of the limited area model ALADIN in its initial conditions. Digital filter blending is used to incorporate the large-scale part of the global ARPEGE analysis while small scales are improved by 3D-Var with the new background error specification, which is shifting the impact of 3D-Var towards smaller scales. The new covariance matrix is sampled from the assimilation ensemble (ENSBV) whose members have large scales made similar and small scales evolving with the assimilation cycle. The error characteristics of the new covariance matrix are then compared with the matrix derived from the off-line ALADIN data assimilation ensemble (ENS).
Standard deviations of background errors sampled from ENSBV are reduced with respect to ENS ones. The largest reduction of the variance spectra of ENSBV is located in long waves compared to the ENS spectra. This is desired since the impact of 3D-Var should be shifted towards smaller scales in the BlendVar scheme. The horizontal auto-correlations of background errors also confirm the shift of the impact.
Spin-up effects were analysed for ENS and ENSBV background error statistics within the 6 h integration. There are two results to notice. First, spin-up effects diminish with time comparably in both ENS and ENSBV. Although due to the absence of global model data, we cannot examine spin-up effects for longer ranges, the convergence of variance spectra shapes suggests these are unimportant if any. Second, the use of ENS-based B matrix in the 3D-Var to obtain a first derivation of ENSBV is really suboptimal, since by construction it increases variances at the largest possible scales. This can be clearly seen for ENSBV variances spectra derived at +0 h forecast range (Fig. ). Therefore, the ENSBV background error statistics can be still improved in the spirit of not reanalysing these large scales within the 3D-Var step, either by making a second iteration deploying the previously obtained ENSBV B matrix or by exploiting statistics of the blended background.
We created four experiments in order to assess and verify the performance of the new set-up of BlendVar. We compared two BlendVar experiments with ENSBV and ENS background error statistics, DF Blending and 3D-Var experiments. Objective scores are used to verify the experiments against radiosonde and aircraft observations. All DF Blending-based experiments perform better with respect to the experiment using only 3D-Var over the 1-month period. This indicates that the driving model analysis gives an important improvement to the initial conditions. Although differences between experiments are very small, the new set-up of BlendVar is promising and seems as a good baseline for further examination.
Acknowledgements
We would like to thank Patrik Benáček who provided the new visualization of objective scores and Ján Mašek for help in revising the manuscript. The authors appreciate many valuable comments provided by two anonymous reviewers.
Additional information
Funding
Notes
No potential conflict of interest was reported by the authors.
Related Research Data
References
- Aladin, I. T. 1997. The ALADIN project mesoscale modelling seen as basic tool for weather forecasting and atmospheric research. WMO Bull. 46, 317–324.
- Berre, L. 2000. Estimation of synoptic and mesoscale forecast error covariances in a limited-area model. Mon. Weather Rev. 128(3), 644–667.
- Berre, L. and Desroziers, G. 2010. Filtering of background error variances and correlations by local spatial averaging: a review. Mon. Weather Rev. 138(10), 3693–3720.
- Berre, L., Desroziers, G., Raynaud, L., Montroty, R. and Gibier, F. 2009. Consistent operational ensemble variational assimilation. In: Extended Abstracts Fifth WMO International Symposium on Data Assimilation, Paper N. 196, Melbourne, 1–8
- Berre, L., Ştefănescu, S. E. and Pereira, M. B. 2006. The representation of the analysis effect in three error simulation techniques. Tellus A 58(2), 196–209.
- Berre, L., Varella, H. and Desroziers, G. 2015. Modelling of flow-dependent ensemble-based background-error correlations using a wavelet formulation in 4D-Var at Météo-France. Q. J. R. Meteorol. Soc. 141(692), 2803–2812.
- Brousseau, P., Berre, L., Bouttier, F. and Desroziers, G. 2011. Background-error covariances for a convective-scale data-assimilation system: AROME-France 3D-Var. Q. J. R. Meteorol. Soc. 137(655), 409–422.
- Brožková, R., Derková, M., Belluš, M. and Farda, F. 2006. Atmospheric forcing by ALADIN/MFSTEP and MFSTEP oriented tunings. Ocean Sci. Discuss. 3(3), 319–342.
- Brožková, R., Klaric, D., Ivatek-Sahdan, S., Geleyn, J. F., Casse, V. and co-authors. 2001. DFI blending: an alternative tool for preparation of the initial conditions for LAM. PWPR Report Series No. 31 WMO-TD No. 1064, 1–7.
- Buehner, M., McTaggart-Cowan, R., Beaulne, A., Charette, C., Garand, L. and co-authors. 2015. Implementation of deterministic weather forecasting systems based on ensemble-variational data assimilation at environment Canada. Part I: the global system. Mon. Weather Rev. 143(7), 2532–2559.
- Caian, M. and Geleyn, J.-F. 1997. Some limits to the variable-mesh solution and comparison with the nested-lam solution. Q. J. R. Meteorol. Soc. 123(539), 743–766.
- Courtier, P., Thépaut, J.-N. and Hollingsworth, A. 1994. A strategy for operational implementation of 4D-Var, using an incremental approach. Q. J. R. Meteorol. Soc. 120(519), 1367–1387.
- Dahlgren, P. and Gustafsson, N. 2012. Assimilating host model information into a limited area model. Tellus A. 64, 1–17.
- Daley, R. 1991. Atmospheric Data Analysis. Cambridge University Press, Cambridge, 457 pp.
- Derková, M. and Belluš, M. 2007. Various applications of the blending by digital filter technique in the ALADIN numerical weather prediction system. Meteorol. časopis 10(1), 27–36.
- Desroziers, G., Berre, L., Chapnik, B. and Poli, P. 2005. Diagnosis of observation, background and analysis-error statistics in observation space. Q. J. R. Meteorol. Soc. 131(613), 3385–3396.
- Fischer, C., Montmerle, T., Berre, L., Auger, L. and Ştefănescu, S. E. 2005. An overview of the variational assimilation in theALADIN/France numerical weather-prediction system. Q. J. R. Meteorol. Soc. 131(613), 3477–3492.
- Guidard, V. and Fischer, C. 2008. Introducing the coupling information in a limited-area variational assimilation. Q. J. R. Meteorol. Soc. 134(632), 723–735.
- Guidard, V., Fischer, C., Nuret, M. and Džiedžic, A. 2006. Evaluation of the ALADIN 3D-VAR with observations of the MAP campaign. Meteorol. Atmos. Phys. 92(3–4), 161–173.
- Isaksen, L., Haseler, J., Buizza, R. and Leutbecher, M. 2010. The new ensemble of data assimilations. ECMWF Newsl. 123, 17–21.
- Kretschmer, M., Hunt, B.R., Ott, E., Bishop, C.H., Rainwater, S. and co-authors. 2015. A composite state method for ensemble data assimilation with multiple limited-area models. Tellus A. 67(1), 26495. DOI:10.3402/tellusa.v67.26495.
- Liu, B. and Xie, L. 2011. A Scale-Selective Data assimilation approach to improving tropical cyclone track and intensity forecasts in a limited-area model: a case study of Hurricane Felix (2007). Weather Forecast. 27(1), 124–140.
- Lynch, P., Giard, D. and Ivanovici, V. 1997. Improving the efficiency of a digital filtering scheme for diabatic initialization. Mon. Weather Rev. 125(8), 1976–1982.
- Peng, S., Xie, L., Liu, B. and Semazzi, F. 2010. Application of scale-selective data assimilation to regional climate modeling and prediction. Mon. Weather Rev. 138(4), 1307–1318.
- Radnóti, G., Ajjaji, R., Bubnová, R., Caian, M., Cordoneanu, E. and co-authors. 1995. The spectral limited area model ARPEGE-ALADIN. PWPR Rep. Ser. 7, WMO-TD 699. ISBN TD006266 7, 1–7.
- Široká, M., Boloni, G., Brozkova, R., Dziedzic, A., Fischer, C. and co-authors. 2001. Innovative developments for a 3DVAR analysis in a limited area model: scale selection and blended cycling. WORLD Meteorol. Organ. TD, 1–53.
- Široká, M., Fischer, C., Cassé, V., Brožková, R. and Geleyn, J.-F. 2003. The definition of mesoscale selective forecast error covariances for a limited area variational analysis. Meteorol. Atmos. Phys. 82(1–4), 227–244.
- Wang, H., Huang, X.-Y., Xu, D. and Liu, J. 2014. A scale-dependent blending scheme for WRFDA: impact on regional weather forecasting. Geosci. Model Dev. 7(4), 1819–1828.
- Xie, L., Liu, B. and Peng, S. 2010. Application of scale-selective data assimilation to tropical cyclone track simulation. J. Geophys. Res. Atmos. 115(D17), D17105. DOI:10.1029/2009JD013471.
- Yang, X. 2005. Analysis blending using spatial filter in grid-point model coupling. Hirlam Newslett. 48, 49–55.