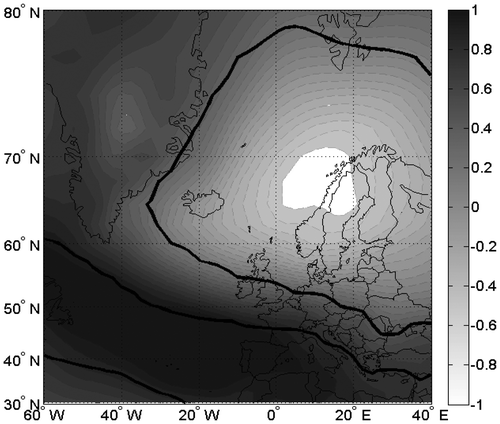
Abstract
Correlations of the North Atlantic Oscillation (NAO) with climate variables in Europe are strong in the north and the south of Europe but there is a zone of statistically not significant correlations in between. This paper presents evidence that the impact of NAO can be ascertained more clearly by decomposing it into its constituent centres of action (COA), the Azores High (AZH) and the Icelandic Low (IL), each of which varies continuously in intensity as well as position. Monthly values of intensity and latitude and longitude positions for each COA are estimated from sea level pressure data. These are used to analyse their impact on interannual variations of winter precipitation and climate of Germany. Correlation of NAO with winter precipitation is weak but statistically significant in north Germany and not significant in south Germany. By separately calculating correlations with the AZH and the IL, it is found that the primary influence on the interannual variations of winter precipitation and surface temperature over both north and south Germany is the zonal migration of the IL. When the IL is situated east of its mean location, there is above normal precipitation and warmer temperatures over Germany and in winters when the IL is situated west of its mean longitudinal position, drier and colder conditions occur over Germany. The impact of this teleconnection is greater in north Germany than in the south, presumably because of the mountainous topography in the south which hinders wind flow.
1. Introduction
The North Atlantic Oscillation (NAO, Hurrell et al., Citation2001) is a large-scale meridional oscillation of the atmospheric surface pressure field between the Azores high (AZH) and the Icelandic low (IL). It has been recognized as one of the major patters of atmospheric variability in the Northern Hemisphere with a strong impact on European climate (Lamb and Peppler, Citation1987; Hurrell, Citation1995; Hurrell and van Loon, Citation1997; Rodo et al., Citation1997; Esteban-Parra et al., Citation1998; Osborn et al., Citation1999; Visbeck et al., Citation2001; Trigo et al., Citation2002). Also, in northern Africa, an influence of the NAO on the temperature (Rogers, Citation1997) and dust storms (Moulin et al., Citation1987) has been reported. Garcia-Herrera et al. (Citation2006) noted that the strong 2004/05 drought in Iberia was linked to the positive phase of NAO. Queralt et al. (Citation2009) reported that extreme precipitation as well as mean winter precipitation in Spain during 1997–2006 were related to the NAO. More recently, Tosic et al. (Citation2014) have demonstrated a relationship between NAO and winter precipitation in Serbia.
In studies relating the NAO to European precipitation, strong correlations are found in northern Europe, and correlations of the opposite sign are found over regions of southern Europe. This is illustrated in Fig. which shows areas where winter (DJFM) precipitation during 1981–2014 is correlated with the NAO with statistically significance of 5%. There is a large zone between the north and the south where the NAO does not yield statistically significant relationships. This feature is seen also in Fig. e of Qian et al. (Citation2000) who correlated an NAO index with European precipitation using data for (1911–1990). It is also seen in Fig. of Wibig (Citation1999) who obtained the NAO index as the principal component of the first rotated EOF of 500 hPa geopotential height and correlated with winter precipitation Europe for 1951–1990. As a result, possible relationships between the NAO climate in regions of middle Europe have not been reported in the literature.
Fig. 1. Correlation map of DJFM precipitation with NAO at 5% significance level for the period from 1981 to 2014.
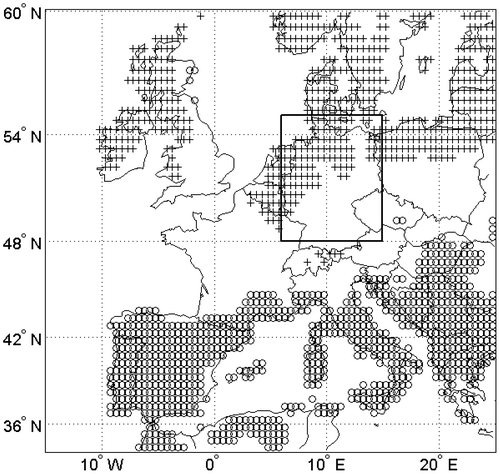
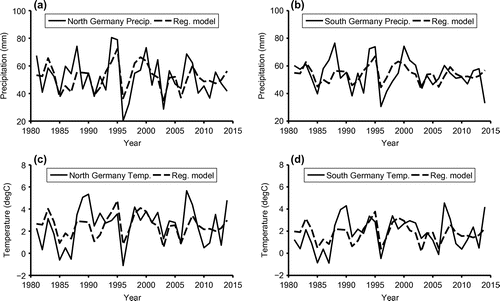
Fig. 2. Time series comparison between (a) observed precipitation over north Germany and the regression model, (b) observed precipitation over south Germany and the regression model, (c) observed temperature over north Germany and the regression model and (d) observed temperature over south Germany and the regression model. In the regression models ILLN is taken as independent variable.
It can be seen in Fig. that precipitation over a large part of Germany is not correlated with the NAO. Analysis of the impact of NAO on Germany’s climate has not been reported in the literature.
The classical explanation of the impact of the NAO on European climate invokes fluctuations in the relative strengths of the Azores High and the Icelandic Low. i.e. a large difference in the pressure between the High and the Low (a positive index year, NAO+) leads to stronger westerlies turning northwards and, consequently mild and wet winters in north Europe and drier weather in the south. In contrast, when the index is negative (NAO-), westerlies are suppressed, northern European areas have cold dry winters because storms tracks shift southwards towards the Mediterranean region. This brings increased precipitation to southern Europe and North Africa.
The commonly used NAO index is based on measurements of the pressure difference between two fixed locations, Lisbon, Portugal (or Azores) and Stykkisholmur, Iceland (Hurrell, Citation1995). However, the Azores High and the Icelandic Low pressure systems have extended structures that migrate considerably on seasonal and interannual time scales. An alternate definition of the NAO index is based on rotated EOF analysis of sea level pressure (SLP) or geopotential heights over the North Atlantic region. The first EOF pattern contains the largest variance, and its principal component is designated as the NAO index (Barnston and Livezey, Citation1987). In this definition also the relative positions of the Azores High and the Icelandic Low remain fixed.
Castro-Diez et al. (Citation2002) investigated the relationship between the NAO and winter temperatures in southern Europe during 1959–1997. By visual examination of SLP maps in different years, the authors noted that temperatures were sensitive not only to the phase of the NAO, but also to the locations of the NAO centres of action.
We propose that a better estimate of the influence of atmospheric pressure fluctuations on European climate can be attained through a quantitative assessment of the fluctuations in the locations as well as pressures of these Centres of Action (COA). Therefore, we consider the variations of the Azores High and the Icelandic Low systems separately. The physical significance for decomposing the NAO into the High and the Low can be seen by considering the limitation imposed by the traditional definition of the NAO index as the normalized difference between the pressure anomaly over Azores pAZ and that over Iceland pIL. If a climate variable R(t) is correlated with NAO, it means that there is a linear relation between them:
(1)
This assumes that the contributions of pressure anomalies at Azores and Iceland to R are equal and opposite. This is unlikely to be correct for most locations.
If the Azores High and the Icelandic Low pressures are considered separately we let the data choose the coefficients
(2)
Depending on the location of the data R, one of the two pressure centres is likely to make a greater contribution. For example, if R is precipitation in the subtropics, the determining factor will be the Azores High, and the Icelandic Low coefficient is likely to be negligible. If on the other hand, R(t) is precipitation over a northern location, then the coefficient of the Azores High will be negligible. This example illustrates the physical reason why considering the High and the Low separately (rather than their difference index, the NAO) is likely to give a better physical explanation.
Furthermore, the position of the AZH or IL can have higher correlations than pressure of either of them, as is the case in this paper where the longitude position of the IL is found to be the dominant factor for the climate of Germany. Another example is provided by the result that the latitude position of the Azores High has a higher correlation with transport of Saharan dust to the Atlantic than the NAO (Riemer et al., Citation2006). The variation of the location of the centre of action is not considered in any previous formulation of the NAO.
To model the pressures and locations of these COA we introduce objective indices for the pressure, latitude and longitude locations for both centres. Previously, application of this approach showed that the frequency of Greenland tip-jet events is better related with the latitude position of the Icelandic Low than with the NAO (Bakalian et al., Citation2007). Also, interannual variations of summer rainfall in the Sahel region is related to the longitudinal migration of the Azores High (Hameed and Riemer, Citation2012) and winter precipitation in the Middle East is impacted by pressure fluctuations of the Azores High (Iqbal et al., Citation2013).
In this paper, we use this approach to investigate interannual variations of winter precipitation and temperature for Germany. The results show that the winter climate of Germany is most directly related to the east-west migrations of the Icelandic Low.
2. Data and methodology
In this paper, the interannual variations of precipitation and temperature in the winter season (DJFM) is analysed separately for north and south Germany because the north is primarily flat and low and the south has mountains and hills with topographic features reaching up to 0.6 km. The analysis is carried out for the region 48°N–55°N, 6°E–15°E, and we take the latitude 52.5°N as the boundary between north and south.
Monthly averaged data are used from which seasonal averages are computed. The sources from where data were obtained and their latitude/longitude resolution are listed in Table . We have also used the NAO index which is available at Climate Prediction Centre (CPC), National Centre of Environmental Prediction (NCEP), USA.
Table 1. Data used, its sources and latitude/longitude resolution.
In order to quantify the changes in the centres of action, objective indices for the pressure, latitude, and longitude locations for the centres can be calculated using gridded SLP data as described by Hameed et al. (Citation1995) and Hameed and Piontovski (Citation2004). By examining the monthly SLP maps since 1948, the latitude-longitude domains over which each of the pressure centres occurs were identified. The pressure index of a COA is defined as an area-weighted pressure departure from a threshold value over its domain (I, J). The pressure index is thus a measure of the anomaly of atmospheric mass over the sector (I, J). The location indices give pressure-weighted mean latitudinal and longitudinal positions of the centre. The domain (I, J) for the Azores High is 20–50°N, 70°W–10°E; and for the Icelandic Low, it is 40–75°N, 90°W–20°E. Note that the domains of the High and the Low overlap and the threshold that separates them is 1014 mb. If the monthly averaged pressure in a grid box is greater than 1014 mb, it is assigned to the Azores High, and for a lower value to the Icelandic Low. The monthly indices of the centres of action updated to 2017 are listed at the website: https://you.stonybrook.edu/coaindices/.
To investigate possible impacts of NAO and its components we have correlated the winter precipitation and temperature with NAO and the three indices of Azores High and those of Icelandic Low. More than one COA index is found to have statistically significant correlations with temperature and precipitation in north and south Germany. In the next step, partial correlations have been calculated with all the indices that have significant correlation with precipitation and temperature of north and south Germany separately, and thus identify the COA variable with the strongest direct relationship with climate. The partial correlation coefficients report the contribution from a given COA index on precipitation while holding all other independent variables fixed. The partial correlation coefficients were calculated as follows:(3)
where the first two subscripts of r, v and w, represent the two variables (one independent, and one dependent) for which the partial coefficient is calculated and the subscripts x, y and z represent those variables that are being held fixed. The partial correlation coefficients for and
are calculated in an analogous manner. A description of the partial correlation method is given by Hamby (Citation1994). Statistical significance of correlations are tested at p < 0.05 level.
3. Results on interannual variations of precipitation
Table shows correlations of the DJFM precipitation of northern and southern Germany with the NAO and the six COA indices, Azores High pressure (AZPS), Azores High Latitude (AZLT), Azores High Longitude (AZLN), Icelandic Low pressure (ILPS), Icelandic Low latitude (ILLT) and Icelandic Low Longitude (ILLN).
Table 2a. Correlation coefficients between precipitation of Northern and Southern Germany and COA indices and NAO.
Table 2b. Correlation coefficients between mean temperature of Northern and Southern Germany and COA indices and NAO.
From the correlation coefficients, we find that north Germany precipitation is possibly influenced by the NAO, AZH pressure and longitude and IL latitude and longitude. We should comment however that the correlation coefficients reflect both direct contributions of a COA index on precipitation and indirect contributions from other COA indices which interact with the given COA and precipitation. To isolate the effects of each COA index, we computed partial correlation coefficients for the significantly correlated COA indices and north Germany precipitation (Table ).
Table 3. Partial correlation between DJFM rainfall of northern Germany and the given variable by controlling all the other variables. The five independent variables considered here are AZH pressure, AZH longitude, IL latitude, IL longitude and NAO.
As shown in Table , the partial correlation of IL longitude and precipitation is the strongest and significant at 0.05 level. Noticeably the partial correlation of NAO and precipitation is nonsignificant because of NAO’s strong correlations with the AZH and IL variables. Based on this information, we then constructed a linear regression model for north Germany DJFM precipitation with IL longitude as the independent variable. We have made the regression equation of standardized variables:(4)
Equation (Equation4(4) ) explains 41% of the variance in precipitation during 1981–2014. Precipitation predicted by this equation is compared with observed values in Fig. a. The regression correctly captures the precipitation maxima in the years 1983, 1995, 1999, 2005 and 2008, and also the minima in 1985, 1991, 1996, 2003 and 2006.
Correlations of south Germany DJFM precipitation with the NAO and the COA indices are also shown in Table . We find that the precipitation has significant correlations with only AZH longitude and IL longitude
. The partial correlation with ILLN
is significant while the partial correlation of AZH longitude
is not significant. We can infer that the longitudinal movement of IL is the primary influence on interannual variation of precipitation in south Germany also. Results of a regression of south Germany’s precipitation with IL longitude as the independent variable is shown in Fig. b. The regression explains only 27% of the interannual variation of precipitation during 1981–2014, but it correctly captures the maxima in precipitation in the years 1983, 1988, 1995, 1999 and 2008 and the precipitation minima in 1985, 1991, 1996, 2003 and 2006. The regression model has of standardized south Germany precipitation with standardized ILLN is as follows:
(5)
4. Results on interannual variations in temperature
We have then correlated the DJFM mean temperature in north Germany with NAO and COA indices as shown in Table . It is very interesting to note that the correlation is statistically significant for NAO and all six COA indices. It should be checked which index reflects the direct contribution to the regional temperature variability so to isolate the effect of mutual correlations between NAO, AZH and IL indices we calculated partial correlations of the temperature with each index by keeping all the other indices fixed. The results are shown in Table , and indicate that the primary influence on interannual variations of temperature in north Germany is IL longitude. Figure c displays a comparison of observed temperature and that explained by IL Longitude as the independent variable. The regression correctly captures the maxima in temperature in the winters of 1983, 1988, 1995, 1999 and 2008 and the minima in the years 1985, 1991, 1996, 2003 and 2006. The regression model of standardized north Germany winter temperature with standardized ILLN explains 33% of the temperature variation during 1981–2014 and the regression equation is:(6)
Table 4. Partial correlation between DJFM mean temperature of northern Germany and the given variable by controlling all the other variables. The seven independent variables considered here are AZH pressure, AZH latitude, IL pressure, IL latitude, IL longitude and NAO.
The same steps have been followed for south Germany temperature. Correlations of the south Germany temperature with NAO and COA indices, displayed in Table , show significant correlations with NAO, AZPS, ILPS, ILLT and ILLN. The comparison of South Germany temperature with regression model by taking ILLN as independent variable is shown in Fig. d. Results of partial correlation analysis are given in Table showing that only ILPS and ILLN remained significantly correlated. ILPS and ILLN are mutually correlated with r = 0.25 which is not statistically significant at 0.05 level; hence they can be used together as independent variables in a regression equation for south Germany’s temperature. The multiple regression equation which explains 63% of the variability of south Germany winter temperature during 1981–2014 is:(7)
Table 5. Partial correlation coefficients between mean DJFM temperature of Southern Germany with a given variable. The five independent variables considered here are AZH pressure, IL pressure, IL latitude, IL longitude and NAO.
5. Composite diagrams
In this section, we examine evidence that regional circulations of the atmosphere are consistent with the empirically determined relationships given above between the Icelandic Low and interannual variations of winter temperature and precipitation in Germany. For this purpose, we use the NCEP/NCAR Reanalysis monthly averaged fields of winds, temperature and sea level pressure. Figure a shows the mean SLP distribution over the north Atlantic during the DJFM season in 1981–2014. The Icelandic Low and the Azores High are clearly identified in Fig. a. SLP less than 1000 hPa in the Icelandic Low is west of Iceland near the south east of Greenland and the pressures exceeding 1020 hPa in the Azores High are over the ocean extending to Iberia and Morocco. Figure b shows the mean SLP distribution in the winters in which the IL was displaced east of its mean position by more than one standard deviation which occurred in 1983, 1994, 1995, 1998, 1999 and 2000. These are called as IL E years in the following discussion. In Fig. b, we can see that the region with pressures less than 1000 hPa is greatly expanded to the east in comparison with the mean pressure distribution in Fig. a. Figure c shows the mean SLP distribution in the winters in which the IL was displaced west of its mean position by more than one standard deviation which occurred in 1985, 1987, 1991, 1996, 2003 and 2006. In these IL W winters the area of pressures less than 1000 hPa in the IL is smaller and shifted slightly to the west in comparison with the mean distribution in Fig. a. Figure b and c show concomitant changes in the distribution of SLP in the subtropics which account for the correlations between the IL and AZH, and result in correlations between the AZH variables and Germany climate. But as discussed earlier, the direct factor in interannual variations of the climate of Germany is the east-west migration of the IL.
Fig. 3. Sea level distribution over north Atlantic (a) averaged for 1981–2014, (b) when Icelandic Low is situated to the east of its mean location by more than one standard deviation and (c) when Icelandic Low is situated to the west of its mean location by more than one standard deviation.
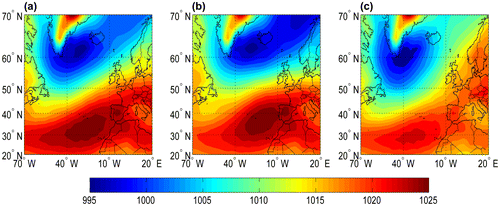
Figure a shows mean DJFM precipitation over Germany for 1981–2010. Figure b shows the difference in precipitation between IL E and IL W years. Increased precipitation is seen everywhere in the region; the largest difference >30 mm occurs in the north-west and the smallest change is over southeast Germany. Similarly, Fig. a shows the mean DJFM temperature and Fig. b gives the difference in temperature between IL E and IL W years. We can see that it is warmer everywhere in Germany when the Icelandic Low is displaced towards east of its mean position in comparison with when it is displaced to the west; warming exceeds 3 °C over a large area of the country in the north and the east.
Fig. 4. (a) Climatological mean of Germany precipitation (in mm) from 1981 to 2010 and (b) difference of mean precipitation between IL E and IL W winters.
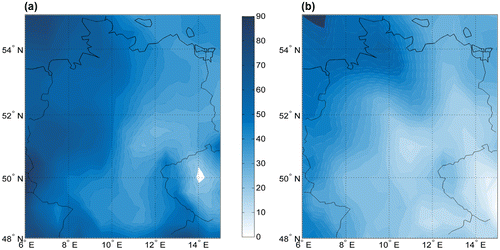
Fig. 5. (a) Climatological mean of DJFM air temperature (°C) from 1981 to 2010 and (b) difference of mean air temperature between IL E and IL W winters.
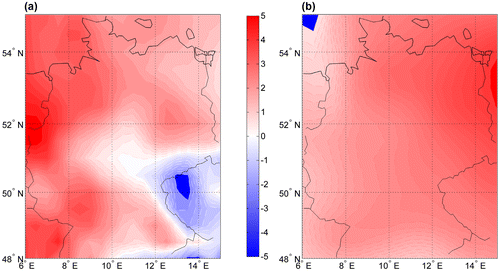
Figure a shows the mean wind at 700 mb level over Western Europe when averaged over the DJFM season for 1981–2010. The winds are westerly with speeds of 7–8 m/s over north Germany, and 5–6 m/s over south Germany.
Fig. 6. (a) Mean wind over western Europe at 700 mb height (1981–2010), (b) composite anomaly map for vector wind at 700 mb level when Icelandic Low longitude is east of its mean value by one standard deviation and (c) composite anomaly map for vector wind at 700 mb level when Icelandic Low longitude is west of its mean value by more than one standard deviation. Shading corresponds to the wind speed.
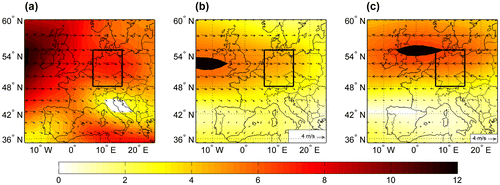
The impact of zonal displacement of the Icelandic Low on wind distribution can be seen in Fig. b and c. Figure b shows the wind anomalies for IL E years. Westerlies are seen to be enhanced over Germany, with anomalies of 3 to 3.5 m/s in the north, and weakening to between 2 and 2.5 m/s in the south. The stronger westerlies bring greater than normal amount of moisture and warmth from the Atlantic, thus contributing to greater than normal precipitation and warmer than normal temperatures over Germany when the IL is situated east of its mean position. The effect is smaller over south Germany than over the north because of the barrier to wind flow in the south offered by topography. Figure c shows the opposite case, i.e. wind anomalies for IL W years. Wind anomalies are now from the east, about 4 m/s in the north, and weakening to nearly 2 m/s in the south. Easterly wind anomalies indicate a smaller contribution of moisture and warmth from the Atlantic to conditions over Germany and greater influence of the dry and cold air masses from Asia. Again, the effect is smaller over south Germany than over the north. A Student’s t-test was done to check where the difference in the winds is statistically different between IL E and IL W years. The results for the difference in wind speeds are shown in Fig. a where the solid line separates regions with p < 0.05. The wind speed difference is statistically different everywhere north of approximately 45°N and in a region in the southwest of the figure. Figure b displays results of the t-test for differences in wind direction between IL E and IL W winters. The difference in wind direction is statistically significant with p < 0.05 for most of west Europe except south of about 42oN and a region in the north east.
Fig. 7. (a) Difference in wind speeds for IL E years and IL W years and (b) difference in angles at each grid point for IL E years and IL W years. Solid black line indicates the grid points where the angles are different at p < 0.05 level.
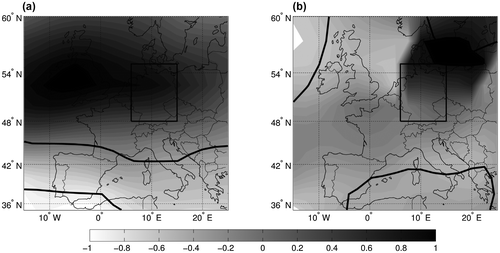
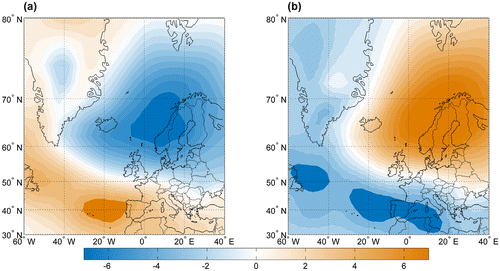
The wind anomaly distributions seen in Figure b and c can be understood by examining how the pressure distribution in this region is affected by longitudinal displacement of the Icelandic Low. Figure a shows the composite SLP anomalies in the winters when the IL was displaced eastward of its mean position by more than one standard deviation. A large anomalous low with values of 4–5 mb at its centre is situated over Scandinavia and the Norwegian sea, driving westerly wind anomalies over most of north Europe including Germany. The opposite case of composite SLP anomalies when IL is displaced west of its mean position by more than one standard deviation is shown on Fig. b. A large anomalous high pressure centre with values of 7 mb at its centre is centred over Scandinavia, driving easterly wind anomalies over most of northern Europe including Germany as seen in Fig. c. The results for the t-test to check for the statistical significance of differences in SLP pressures are shown in Fig. . The SLP differences are significant with p < 0.05 over a large section of the north Atlantic east of Greenland, and over north-west Europe, and also over a belt extending south-eastwards from 40°N–60°N in the west
Fig. 8. (a) Composite anomaly map for SLP in winters when the Icelandic Low is situated east of its mean longitude position by more than one standard deviation and (b) composite anomaly map for SLP in winters when the Icelandic Low is situated west of its mean longitude position by more than one standard deviation.
6. Conclusions
Correlations of NAO with climate variables in Europe show strong correlations in north and south Europe with a zone of weak correlations in between. This paper posits that greater information about the role of NAO can be obtained by separately considering its components, the Azores High and the Icelandic Low, each of which is an extended feature, fluctuates in intensity and also its latitudinal and longitudinal locations.
Correlation of NAO with winter precipitation is weak but statistically significant in north Germany and not significant in south Germany. By considering the interannual fluctuations in the intensities and positions of the Azores High and the Icelandic Low, this paper has shown that the primary influence on the interannual variations of winter precipitation and surface temperature over both north and south Germany is the zonal migration of the Icelandic Low. In winters when the IL is situated east of its mean location, there is above normal precipitation and warmer temperatures over Germany, and opposite anomalies are experienced in winters when the IL is situated west of its mean longitudinal position. The impact of this teleconnection is greater in north Germany than in the south, presumably because of barriers to wind flow by the high topography in the south.
Further work is needed in understanding how the position of the Icelandic Low guides the synoptic scale storms that dominate fluctuation of weather in north and south Germany.
Disclosure statement
No potential conflict of interest was reported by the authors.
References
- Bakalian, F., Hameed, S. and Pickart, R. 2007. Influence of the Icelandic low latitude on the frequency of greenland tip jet events: implications for Irminger sea convection. J. Geophys. Res. 112, C04020. DOI:10.1029/2006JC003807.
- Barnston, A. G. and Livezey, R. E. 1987. Classification, seasonality and persistence of low-frequency atmospheric circulation patterns. Mon. Wea. Rev. 115, 1083–1126. https://doi.org/10.1175/1520-0493(1987)115<1083:CSAPOL>2.0.CO;2.
- Castro-Diez, Y., Pozon-Vasquez, D., Rodrigo, F. and Esteban-Parra, M. 2002. NAO and winter temperature variability in southern Europe. Geophys. Res. Lett. 29, 1-1–1-4. DOI:10.1029/2001GL014042.
- Esteban-Parra, M., Rodrigo, F. and Castro-Diez, Y. 1998. Spatial and temporal patterns of precipitation in Spain for the period 1880–1992. Int. J. Climatol. 18, 1557–1574.
- Garcia-Herrera, R., Peredes, D., Trigo, R., Trigo, I., Hernandez, E. and co-authors. 2006. The outstanding 2004/05 drought in the Iberian Peninsula: associated: atmospheric circulation. J. Hydrometeorol. 8, 483–497. DOI:10.1175/JHM578.1.
- Hamby, D. M. 1994. A review of techniques for parameter sensitivity analysis of environmental models. Env. Moni. and Asses. 32, 135–154. DOI:10.1007/BF00547132.
- Hameed, S. and Piontkovski, S. 2004. The dominant influence of the Icelandic Low on the position of the Gulfstream northwall. Geophys. Res. Lett. 31, L09303. DOI:10.1029/2004GL019561.
- Hameed, S. and Riemer, N. 2012. Relationship between Sahel precepititation and atmospheric centers of action. Adv Meteorol. 2012. DOI:10.1155/2012/953853.
- Hameed, S., Shi, W., Boyle, J. and Santer, B. 1995. Investigation of the centers of action in the North Atlantic and North Pacific in the ECHAM AMIP simulation. 1st International AMIP scientific conference, Monterey, CA, WRCP 92, p. 221.
- Hurrell, J. 1995. Decadal trends in the North Atlantic oscillation: regional temperatures and precipitation. Science 269, 676–679.
- Hurrell, J. W., Kushnir, Y. and Visbeck, M. 2001. The north Atlantic oscillation. Science 291(5504), 603–605.
- Hurrell, J. and Van Loon, H. 1997. Decadal variations climate associated with the North Atlantic oscillation. Climatic Change 36, 301–326.
- Iqbal, M., Hameed, S. and Khan, F. 2013. Influence of Azores high pressure on Middle Eastern rainfall. Theor. App. Climatol. 111, 211–221. DOI:10.1007/s00704-012-0648-4.
- Lamb, P. and Peppler, R. 1987. North Atlantic oscillation: concept and an application. Bull. Amer. Meteor. Soc. 68, 1218–1225.
- Moulin, C., Lambert, C., Dulac, F. and Dayan, U. 1987. Control of atmospheric export dust from North Africa by the North Atlantic Oscillation. Nature 387, 691–694.
- Osborn, T., Briffa, K., Tett, S., Jones, P. and Trigo, R. 1999. Evaluation of the North Atlantic Oscillation as simulated by a coupled climate model. Clim. Dyn. 15, 685–702.
- Qian, B., Corte-Real, J. and Xu, H. 2000. Is the North Atlantic Oscillation the most important atmospheric pattern for precipitation in Europe? J. Geophys. Res. 105, 11901–11910.
- Queralt, S., Hernández, E., Barriopedro, D., Gallego, D., Ribera, P. and co-authors. 2009. North Atlantic Oscillation influence and weather types associated with winter total and extreme precipitation events in Spain. Atmos. Res. 94, 675–683.
- Riemer, N., Doherty, O. and Hameed, S. 2006. On the variability of African dust transport across the Atlantic. Geophys. Res. Lett. 33, 1176.
- Rodo, X., Baert, E. and Comin, F. 1997. Variations in seasonal rainfall in southern Europe during present century: relationships with the North Atlantic Oscillation and El-Nino Southern Oscillation. Clim. Dyn. 13, 275–284.
- Rogers, J. 1997. North Atlantic storm track variability and its association to the North Atlantic Oscillation and climate variability of Northern Europe. J. Clim. 10, 1635–1647.
- Tošić, I., Hrnjak, I., Gavrilov, M., Unkašević, M., Marković, S. B. and co-authors. 2014. Annual and seasonal variability of precipitation in Vojvodina, Serbia. Theor. Appl. Climatol. 117, 331–341.
- Trigo, R., Osborn, T. and Corte-Real, J. 2002. The North Atlantic Oscillation influence on Europe: climate impacts and associated physical mechanisms. Clim. Res. 20, 9–17.
- Visbeck, M., Hurrell, J., Polvani, L. and Cullen, H. 2001. The North Atlantic Oscillation: Past, present, and future. PNAS 98, 12876–12877. DOI:10.1073/pnas.231391598.
- Wibig, J. 1999. Precipitation in Europe in relation to circulation patterns at the 500 hPa level. Int. J. Climatol. 19, 253–269.

